Print Label Market Size 2025-2029
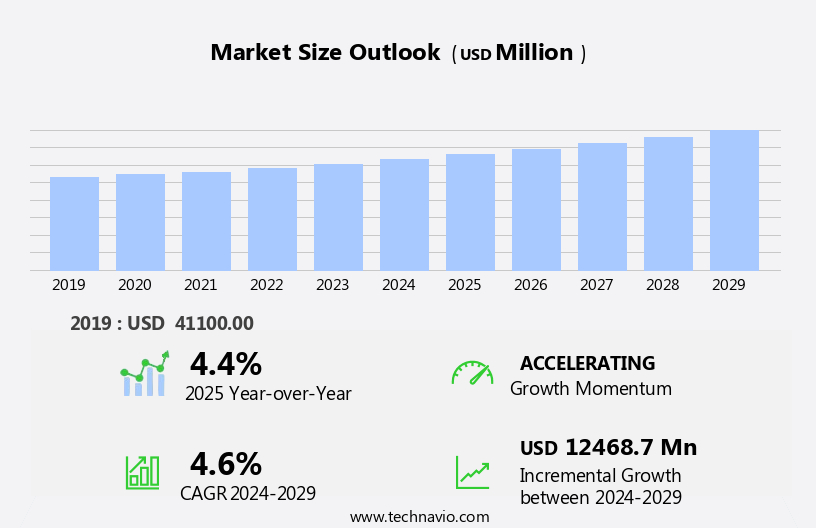
The print label market size is forecast to increase by USD 12.47 billion at a CAGR of 4.6% between 2024 and 2029.
- The market is experiencing significant growth, driven by the increasing demand from the organized retail sector. This trend is attributed to the need for more efficient inventory management and supply chain optimization, which is leading to a higher adoption rate of labeling solutions. Another key driver is the increased implementation of barcode technology, which offers numerous benefits such as faster checkout processes, improved accuracy, and enhanced customer experience. Furthermore, the recycling of PET plastic is gaining momentum, creating new opportunities for the market as this material is widely used in label production. However, challenges such as the rising cost of raw materials and increasing competition from alternative labeling solutions like RFID tags and QR codes, may hinder market growth.
- To capitalize on opportunities and navigate challenges effectively, companies in the market should focus on innovation, cost reduction, and strategic partnerships. By staying abreast of market trends and consumer demands, they can differentiate themselves and maintain a competitive edge. Additionally, PET plastic recycling is gaining traction, providing a sustainable solution for label production and reducing environmental impact. These trends are expected to continue shaping the market In the coming years. The implementation of barcode label technology, in particular, is revolutionizing the way labels are used for tracking and tracing products, making it an essential component of modern business operations.
What will be the Size of the Print Label Market during the forecast period?
- The market encompasses a diverse range of industries, including pharmaceuticals, food and beverage, and organized retail. This market is driven by the need for effective branding, consumer engagement, and regulatory compliance. In the pharmaceutical sector, labels serve crucial functions such as anticounterfeit measures, providing essential consumer information, and ensuring traceability throughout the supply chain. Labels for packaged food and beverages require clear and concise information, including storage instructions, precautions, and nutritional facts. Operational efficiency and quality are key considerations in the label printing industry. Digital printing technology has gained popularity due to its versatility and reduced setup costs.
- Barcode technology and RFID solutions enhance supply chain management and inventory control. Label design plays a significant role in consumer engagement and brand recognition. Sustainability is a growing trend in the label market, with eco-friendly materials and recycling initiatives gaining traction. The beverage sector is embracing innovative label designs and smart labels to enhance consumer experience. The market encompasses a diverse range of materials, including paper, plastic, polymer, cloth, metal, foil, and fabric, used to affix critical information to containers and other surfaces. Pharmaceutical labeling continues to evolve, with a focus on regulatory compliance and patient safety. Overall, the market is expected to grow steadily, driven by the increasing demand for high-quality, efficient, and sustainable labeling solutions.
How is this Print Label Industry segmented?
The print label industry research report provides comprehensive data (region-wise segment analysis), with forecasts and estimates in "USD million" for the period 2025-2029, as well as historical data from 2019-2023 for the following segments.
- Type
- Pressure-sensitive
- Glue-applied
- Sleeving
- In-mold
- Others
- End-user
- Food
- Non-food retail
- Industrial and logistics
- Beverage
- Others
- Raw Material
- Plastic or polymer labels
- Metal labels
- Method
- Flexography
- Offset lithography
- Gravure
- Inkjet
- Others
- Geography
- APAC
- Australia
- China
- India
- Japan
- South Korea
- Europe
- France
- Germany
- UK
- North America
- US
- South America
- Brazil
- Middle East and Africa
- APAC
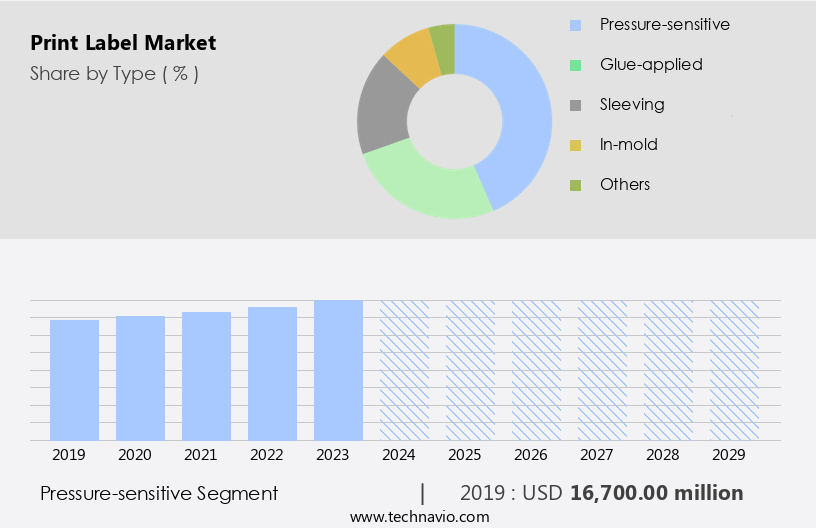
By Type Insights
The pressure-sensitive segment is estimated to witness significant growth during the forecast period. Pressure-sensitive labels, also known as self-adhesive labels, have become increasingly popular due to their convenience and versatility. Manufactured using materials such as paper, coated paper films, and plastic films, these labels do not require fasteners, glue, heat, or water for application. Their advantageous properties, including design and graphic options, quick application process, and time-saving efficiency, have led to their widespread use in industries like food and beverage and healthcare, where they are replacing traditional glue-applied labels. Pressure-sensitive labels offer operational efficiency by reducing application time and are available in various formats, including wet-glue labels, pressure-sensitive labels, linerless labels, and multi-part tracking labels.
Get a glance at the market report of share of various segments Request Free Sample
The Pressure-sensitive segment was valued at USD 16.70 billion in 2019 and showed a gradual increase during the forecast period.
Regional Analysis
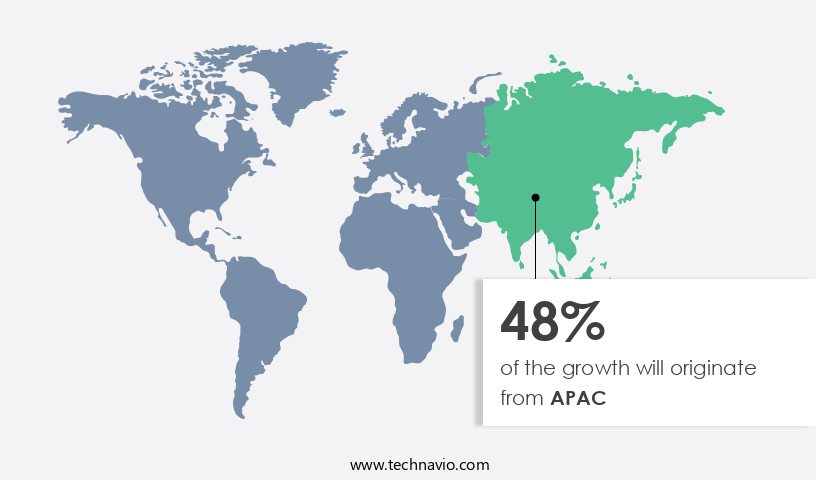
APAC is estimated to contribute 48% to the growth of the global market during the forecast period. Technavio's analysts have elaborately explained the regional trends and drivers that shape the market during the forecast period.
For more insights on the market size of various regions, Request Free Sample
The market in APAC held a substantial share in the global market in 2024. Fueled by demographic shifts and rising disposable incomes, particularly in developing countries like India and China, the demand for packaged food and beverages is surging. This trend is significantly boosting the need for print labels in this sector. Moreover, the region's growing export economy, particularly from ASEAN countries, is further fueling market growth. This market is driven by the demand for effective tracking, consumer engagement, and anticounterfeit measures across various industries, such as pharmaceuticals, food and beverage, and logistics. In the last decade, US imports from this region have seen a notable increase of over 120%. Consumer engagement, product ingredients, manufacturing details, expiry dates, personalized products, inventory management, and traceability are crucial factors influencing the market.
Label formats, such as wet-glue labels, pressure-sensitive labels, linerless labels, and in-mold labels, cater to various industries, including food and beverages, pharmaceuticals, healthcare, personal care, industrial, and consumer electronics. Sustainability is a growing concern, with eco-friendly, sustainable labels gaining popularity. Printing technologies, such as digital printing, offset lithography, flexography, screen printing, and letterpress, are employed to meet diverse labeling requirements. The market is expected to continue growing due to waste minimization, energy use reduction, and increasing operational efficiency.
Market Dynamics
Our researchers analyzed the data with 2024 as the base year, along with the key drivers, trends, and challenges. A holistic analysis of drivers will help companies refine their marketing strategies to gain a competitive advantage.
What are the key market drivers leading to the rise in the adoption of Print Label Industry?
- Growing demand from organized retail sector is the key driver of the market. The market has experienced significant growth due to the expansion of hypermarkets and supermarkets. In China, retail sales of consumer goods reached a record USD6894 billion in 2024, marking a 3.5% increase year-on-year. This growth can be attributed to various factors, including government policies promoting duty-free shopping zones, the removal of trade barriers, reduced import duties on consumer goods, and increased support for cross-border e-commerce. The organized retail sector's increasing presence in several developing countries has intensified competition among consumer goods brands, making it essential for manufacturers to differentiate their products on the shelf. Consequently, the demand for print labels that enhance a product's visual appeal and provide crucial product information has surged. This trend is expected to continue as retailers and manufacturers seek to capture consumers' attention in an increasingly competitive market.
- These labels are essential for inventory management, ensuring product traceability and supply chain transparency. In addition, they are used in various sectors, including food and beverage, pharmaceutical, healthcare, industrial, household care, consumer electronics, and personal care. Pressure-sensitive labels are also eco-friendly, with options for renewable, recyclable, and compostable materials, contributing to environmental sustainability. Regulations and environmental standards play a crucial role in the labeling industry, and pressure-sensitive labels comply with these requirements.
What are the market trends shaping the Print Label Industry?
- Increased implementation of barcode technology is the upcoming market trend. Barcode print labels play a crucial role in product identification and supply chain management by documenting essential information such as manufacturing date, location, batch number, and expiry date. These labels act as security features for products. The global demand for barcode print labels has witnessed significant growth, particularly in the food and beverage industry. This sector is increasingly adopting pressure-sensitive print labels with advanced 2D and 3D barcode technology. Pressure-sensitive labels, a type of self-adhesive label, have become increasingly popular due to their convenience and versatility. Manufactured using materials such as paper, coated paper films, and plastic films, these labels offer several advantages over other label types. For instance, Avery Dennison's pressure-sensitive labels incorporate 2D and 3D barcodes, enabling more data encoding in a smaller space. This technology enhancement caters to the industry's requirement for enhanced traceability and product security.
- The manufacturing process for pressure-sensitive labels includes various printing technologies, such as offset lithography, flexography, screen printing, letterpress, and electrophotography. These labels are essential for product brand recognition, anticounterfeit measures, consumer engagement, and product safety, with essential information such as product ingredients, manufacturing details, expiry dates, personalized products, storage instructions, precautions, and traceability.
What challenges does the Print Label Industry face during its growth?
- Recycling of PET plastic is a key challenge affecting the industry growth. The market faces unique challenges in the recycling of PET plastic labels due to their density and difficulty in separation from the polymer material. For instance, the complex structure of a snack chip bag, consisting of multiple layers of plastic and foil, poses a significant challenge in the recycling process. These layers hinder efficient separation before recycling, making it an ongoing issue for label manufacturers. Despite the benefits of PET plastic, such as its lightweight and cost-effective properties, its disposal complications necessitate continuous innovation and development in recycling technologies. The need for advanced machinery to separate and process these layers effectively is crucial for the sustainable growth of the print label industry.
- Consumer engagement is also a major focus in the label market. Brands are looking for ways to connect with consumers through their labels, whether it be through personalized messaging or interactive elements. This can help build brand loyalty and differentiate products in a crowded market. Inventory management is another important consideration in the label market. Labels play a crucial role in tracking and managing products throughout the supply chain, from raw materials to the end consumer. Efficient inventory management can help reduce waste and improve operational efficiency. The food and beverage industry is a major consumer of labels, with a particular focus on expiry dates and storage instructions.
Exclusive Customer Landscape
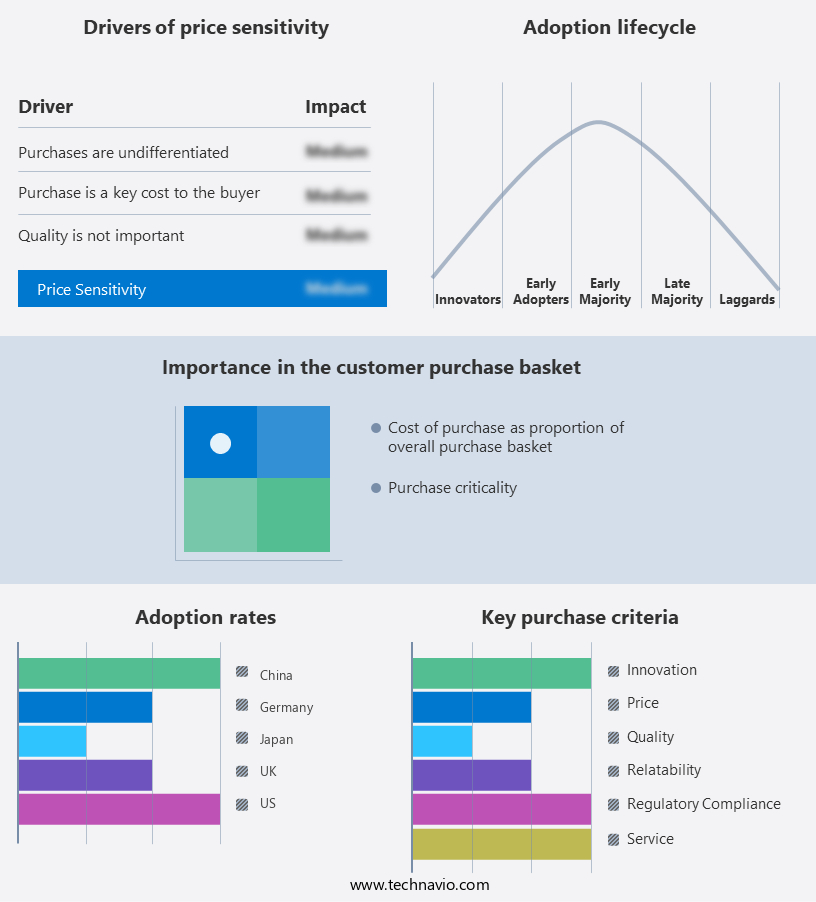
The print label market forecasting report includes the adoption lifecycle of the market, covering from the innovator's stage to the laggard's stage. It focuses on adoption rates in different regions based on penetration. Furthermore, the print label market report also includes key purchase criteria and drivers of price sensitivity to help companies evaluate and develop their market growth analysis strategies.
Customer Landscape
Key Companies & Market Insights
Companies are implementing various strategies, such as strategic alliances, print label market forecast, partnerships, mergers and acquisitions, geographical expansion, and product/service launches, to enhance their presence in the industry.
3M Co. - The company provides a range of print labels, including 3M Tamper Evident Label Material 7380 and 7384, enhancing product security and authenticity.
The industry research and growth report includes detailed analyses of the competitive landscape of the market and information about key companies, including:
- 3M Co.
- Aditya Polymers
- Ahlstrom
- Al Ghurair Group
- Avery Dennison Corp.
- Barspell Technologies India Pvt. Ltd.
- Cimarron Label
- Concept Labels and Packaging Co.
- Fuji Seal International Inc.
- Huhtamaki Oyj
- JK Labels Pvt. Ltd.
- Label Aid Systems Inc.
- M. R. Labels Co.
- Mondi Plc
- Multi Color Corp.
- Ravenwood Packaging Ltd.
- Resource Label Group LLC
- SATO Holdings Corp.
- Taylor Corp.
- The Label Printers LP
Qualitative and quantitative analysis of companies has been conducted to help clients understand the wider business environment as well as the strengths and weaknesses of key industry players. Data is qualitatively analyzed to categorize companies as pure play, category-focused, industry-focused, and diversified; it is quantitatively analyzed to categorize companies as dominant, leading, strong, tentative, and weak.
Research Analyst Overview
The market encompasses a diverse range of applications and technologies, serving various industries such as healthcare, personal care, industrial, household care, consumer electronics, food and beverages, and more. One of the key drivers in this market is the importance of brand recognition, which is achieved through the use of high-quality labels that accurately represent a product's identity. Another significant trend in the label market is the implementation of anticounterfeit measures. As consumers become increasingly aware of the risks associated with counterfeit products, there is a growing demand for labels that can help prevent counterfeiting. This can include the use of holograms, microprinting, and other security features.
Ensuring that labels accurately reflect the necessary information is essential for maintaining product safety and quality. The pharmaceutical industry also relies heavily on labels for traceability and regulatory compliance. Precautions and side effects must be clearly communicated to consumers, and labels must meet strict environmental standards and regulations. The label printing industry is constantly evolving, with new technologies and materials being developed to meet the changing needs of various industries. The market encompasses various sectors, including healthcare, personal care, industrial, household care, consumer electronics, food and beverages, and eco-friendly labels. Digital printing, for example, offers greater flexibility and customization, while renewable and recyclable materials are becoming increasingly popular for eco-friendly and sustainable labels. Manufacturing details, such as label format and printing technologies, also play a role in the label market.
Wet-glue labels, pressure-sensitive labels, linersless labels, multi-part tracking, in-mold labels, and sleeves all have unique advantages and applications. The healthcare, personal care, industrial, household care, consumer electronics, food and beverages, and other industries all have specific labeling requirements. Meeting these requirements while minimizing waste and reducing energy use is a key challenge for label printers and manufacturers. Alliances and partnerships between companies in the label industry can help drive innovation and improve operational efficiency. Collaboration on research and development, as well as supply chain optimization, can help companies stay competitive in a rapidly evolving market. The market is a dynamic and diverse industry that serves a wide range of applications and industries.
From brand recognition and consumer engagement to inventory management and regulatory compliance, labels play a crucial role in ensuring the safety, quality, and success of products in the marketplace. The use of innovative technologies and materials, as well as collaborative partnerships, will continue to drive growth and innovation in the label market.
|
Market Scope |
|
|
Report Coverage |
Details |
|
Page number |
232 |
|
Base year |
2024 |
|
Historic period |
2019-2023 |
|
Forecast period |
2025-2029 |
|
Growth momentum & CAGR |
Accelerate at a CAGR of 4.6% |
|
Market growth 2025-2029 |
USD 12.47 billion |
|
Market structure |
Fragmented |
|
YoY growth 2024-2025(%) |
4.4 |
|
Key countries |
China, US, Japan, India, Germany, UK, South Korea, Australia, Brazil, and France |
|
Competitive landscape |
Leading Companies, Market Positioning of Companies, Competitive Strategies, and Industry Risks |
What are the Key Data Covered in this Print Label Market Research and Growth Report?
- CAGR of the Print Label industry during the forecast period
- Detailed information on factors that will drive the growth and forecasting between 2025 and 2029
- Precise estimation of the size of the market and its contribution of the industry in focus to the parent market
- Accurate predictions about upcoming growth and trends and changes in consumer behaviour
- Growth of the market across APAC, Europe, North America, South America, and Middle East and Africa
- Thorough analysis of the market's competitive landscape and detailed information about companies
- Comprehensive analysis of factors that will challenge the print label market growth of industry companies
We can help! Our analysts can customize this print label market research report to meet your requirements.
 RIA -
RIA - 
