RF Amplifier Market Size 2024-2028
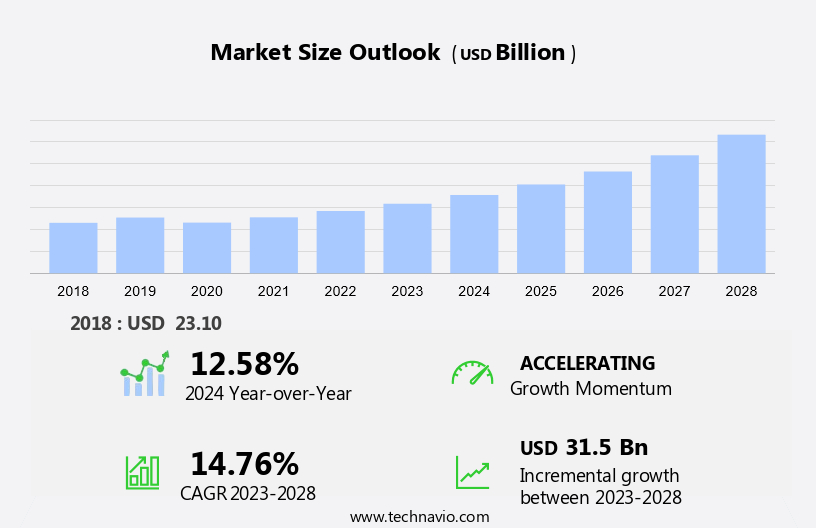
The RF amplifier market size is forecast to increase by USD 31.5 billion at a CAGR of 14.76% between 2023 and 2028. The market is experiencing significant growth due to the increasing number of 5G mobile subscriptions and the deployment of 5G base stations. The demand for RF front-end modules, including power amplifiers, transceiver filters, RF switches, and PA devices, is surging to support the rollout of 5G technology. This trend is not limited to the consumer electronics sector, as the automotive industry is also witnessing a rise in wireless RF integration for applications such as automotive radar and vehicle-to-vehicle communication. The economic downturn has not deterred market growth, as smartphone sales remain strong, and OEMs continue to invest in advanced RF components. Additionally, the use of RF amplifiers in defense equipment is a growing trend. The high cost associated with GaAs-based RF amplifiers presents a challenge for market growth. However, companies such as Qualcomm and Taoglas are innovating to offer cost-effective solutions, making RF amplifiers an essential component in various industries.
What will be the Size of the Market During the Forecast Period?
The market is experiencing significant growth due to the increasing demand for wireless communication technologies and advanced defense applications. RF amplifiers play a crucial role in enhancing the signal strength and quality of various wireless systems, including cellular phones, radios, Bluetooth, Wi-Fi technology, and the Internet of Things (IoT). Wireless connectivity is becoming an integral part of modern consumer electronics, with smartphone sales continuing to rise and the automotive industry integrating wireless RF technology into vehicles. The market is expected to benefit from this trend, as the demand for stronger and more reliable wireless signals increases.
Moreover, the defense sector is another significant contributor to the market. Defense contractors rely on RF amplifiers for various applications, such as electronic warfare, radar systems, satellite communication (Satcom), and Unmanned Aerial Vehicles (UAVs). The market is expected to grow as defense budgets continue to increase and new technologies are developed. The market is also driven by the increasing use of GaN (Gallium Nitride) and PA (Power Amplifier) devices in wireless applications. These devices offer higher power efficiency, smaller size, and lower power consumption compared to traditional RF components. However, the market is not without challenges. Economic downturns and fluctuations in vehicle sales can impact the demand for RF amplifiers in the automotive sector.
Additionally, the development and integration of new RF technologies, such as 5G and 6G, may disrupt the market dynamics and create new opportunities. To stay competitive in the market, companies must focus on innovation, cost-effectiveness, and quality. Collaborating with leading RF component manufacturers, such as Qualcomm and Taoglas, can help OEMs (Original Equipment Manufacturers) develop advanced RF solutions and meet the evolving demands of the market. In conclusion, the market is expected to continue growing due to the increasing demand for wireless communication technologies and advanced defense applications. Companies must focus on innovation, cost-effectiveness, and quality to stay competitive in this dynamic market.
Market Segmentation
The market research report provides comprehensive data (region-wise segment analysis), with forecasts and estimates in "USD billion" for the period 2024-2028, as well as historical data from 2018-2022 for the following segments.
- Type
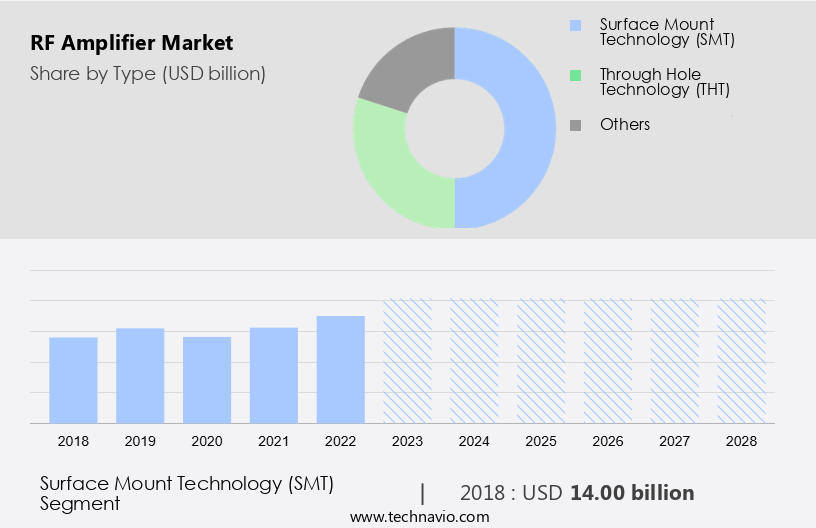
- Surface mount technology (SMT)
- Through hole technology (THT)
- Others
- Geography
- APAC
- China
- Japan
- South Korea
- North America
- US
- Europe
- Germany
- Middle East and Africa
- South America
- APAC
By Type Insights
The surface mount technology (SMT) segment is estimated to witness significant growth during the forecast period. The market in North America is primarily driven by the increasing number of 5G mobile subscriptions and the deployment of 5G base stations. RF front-end modules, which include power amplifiers, transceiver filters, RF switches, and PA devices, play a crucial role in enabling seamless 5G connectivity. According to industry reports, the market for RF front-end modules is projected to grow at a steady pace, driven by the demand for smartphones and the expansion of 5G networks. Moreover, the automotive industry is also expected to contribute significantly to the market. The integration of wireless RF technology in automobiles, including automotive radar and vehicle-to-vehicle communication, is driving the demand for RF amplifiers.
Additionally, key players in the market include Qualcomm, Taoglas, and various OEMs. However, the economic downturn and the decline in vehicle sales due to the pandemic have impacted the market growth. Nevertheless, the adoption of RF amplifiers in consumer electronics and defense equipment is expected to offset the decline in the automotive sector. The use of surface mount technology (SMT) in the packaging of RF amplifiers is a major trend in the market, as it ensures the protection of the amplifier from external hazards and facilitates easy assembly on PCBs. In conclusion, the market in North America is poised for growth, driven by the increasing adoption of 5G technology and the expanding automotive industry. The use of SMT technology in the packaging of RF amplifiers is a significant trend, and key players are focusing on innovation and product development to cater to the evolving market demands.
Get a glance at the market share of various segments Request Free Sample
The Surface mount technology (SMT) segment was valued at USD 14.00 billion in 2018 and showed a gradual increase during the forecast period.
Regional Insights
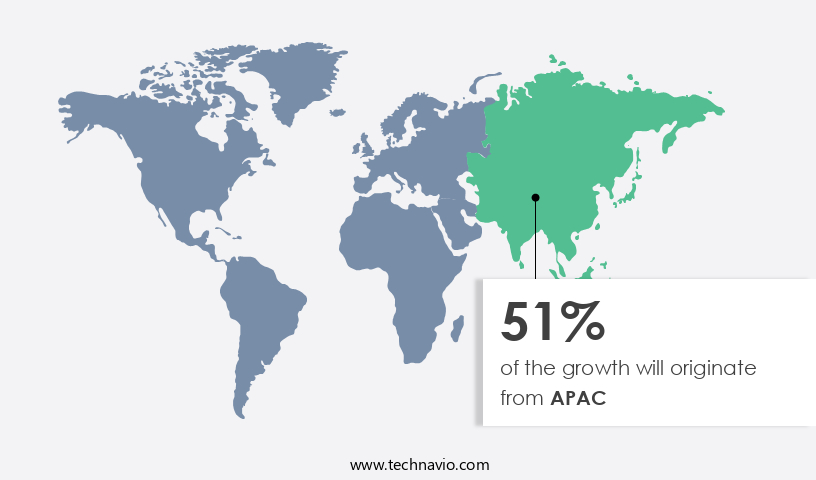
APAC is estimated to contribute 51% to the growth of the global market during the forecast period. Technavio's analysts have elaborately explained the regional trends and drivers that shape the market during the forecast period.
For more insights on the market share of various regions Request Free Sample
The market in the Asia Pacific region is experiencing significant growth due to the increasing use of mobile and wireless systems. The widespread adoption of 4G technology and the growing enthusiasm for 5G deployment are key factors driving this expansion. In APAC, the consumer demand for LTE is on the rise, leading telecom infrastructure providers to enhance their mobile network connectivity in the region. According to Cisco's Annual Internet Report, internet penetration in APAC is projected to reach 72% in 2023, up from 52% in 2018, with a compound annual growth rate (CAGR) of 37% between 2018 and 2023. Telecom firms are investing heavily in cellular network expansion to meet the surging demand for data-intensive applications, such as smartphones and tablets, in this rapidly digitizing region.
Additionally, beyond telecoms, industries like aerospace, manufacturing, and wireless sensors are also adopting Rf Amplifiers for their unique properties, including energy efficiency, miniaturization, and waste heat elimination. Patent methods for these applications continue to evolve, ensuring the market remains competitive and innovative. However, high costs and large size remain challenges for high-power Rf Amplifiers, potentially limiting their profit margins. Despite these hurdles, the market's potential for growth is vast, particularly in the context of next-generation wireless technologies like 5G.
Our researchers analyzed the data with 2023 as the base year, along with the key drivers, trends, and challenges. A holistic analysis of drivers will help companies refine their marketing strategies to gain a competitive advantage.
Market Driver
Growing internet penetration is the key driver of the market. Mobile data traffic is experiencing significant growth due to the increasing use of data-enabled devices and high-bandwidth applications. According to the Cisco Visual Networking Index, global mobile and fixed internet traffic is projected to increase substantially by 2023. Specifically, the average mobile network connection speed is anticipated to reach 43.9 Mbps, while the average 5G connection speed will reach an impressive 575 Mbps during the same period. In addition, the global average Wi-Fi speed is expected to reach 92 Mbps by 2023. Furthermore, it is estimated that 299.1 billion mobile applications will be downloaded and 628 million public Wi-Fi hotspots will be available by this date.
Additionally, the fixed broadband speed is projected to grow at a compound annual growth rate (CAGR) of 20% between 2018 and 2023. Complex designs and engineering are essential considerations in the manufacturing process of RF amplifiers to meet the functional properties and gain values required for mobile networks. Noise factors, crosstalk attenuation, and nonfunctional properties are crucial elements that must be addressed in the overall RF design. Long-term reliability and thermal constraints are also essential factors to ensure the RF amplifiers perform optimally under various conditions. Established market players dominate the market, but higher initial investments and linearity issues may pose challenges for new entrants.
Market Trends
The growing number of mergers and acquisitions (M and A) is the upcoming trend in the market. The RF technology market has experienced significant activity in the form of mergers and acquisitions (M&A) among key players. These companies are strategically expanding their offerings to maintain a competitive edge in the industry. Notable transactions include STMicroelectronics' acquisition of Somos Semiconductor SAS, a RF amplifier manufacturer, in October 2020. Calian Group Ltd. Also acquired Tallysman Wireless Inc., an antenna and RF component manufacturer, in September 2020. Analog devices Inc. Followed suit in August 2021 with the acquisition of Maxim Integrated Products Inc., another RF amplifier manufacturer. In October 2021, Guerrilla RF completed a reverse merger with Laffin Acquisition Corp.
Furthermore, these M&A activities will lead to a more consolidated market as prominent companies expand their global reach. The RF technology landscape is marked by the integration of various communication systems such as cellular phones, radios, Bluetooth, Wi-Fi technology, and the Internet of Things (IoT). This growing demand for wireless connectivity spans across various sectors, including Electronic Warfare, defense contractors, energy frequencies, radar, and satellite communication (SATCOM). Gallium Nitride (GaN) technology, UAV, and Wi-Fi project are also driving the market's growth. As the industry evolves, companies must stay agile and innovative to meet the demands of this dynamic market.
Market Challenge
The high cost associated with Gallium arsenide (GaAs) based RF amplifiers is a key challenge affecting the market growth. Gallium arsenide (GaAs) is a semiconductor material with distinct advantages over silicon for certain applications, particularly in radio frequency (RF) amplifiers. GaAs' crystalline structure allows electrons to flow faster than in silicon, making it ideal for handling high-frequency signals. However, GaAs-based RF amplifiers, such as GaAs field-effect transistors (FETs), are more costly than their silicon counterparts, metal-oxide-semiconductor field-effect transistors (MOSFETs). The higher cost is justified in niche applications where GaAs' unique capabilities are essential, such as in wireless communication systems.
In the competitive landscape of the market, key players like NXP Semiconductors and Texas Instruments dominate, leveraging collaborations and acquisitions to expand their offerings. Emerging trends include the integration of ClassD sound enhancers in home automation systems, such as smart speakers, soundbars, TVs, laptops, and projectors, to deliver high-resolution sound for voice-empowered devices. Brilliant home architects are increasingly incorporating these technologies into their designs to create a more immersive and voice-controlled living experience. GaAs-based RF amplifiers will continue to play a vital role in enabling these advanced functionalities.
Exclusive Customer Landscape
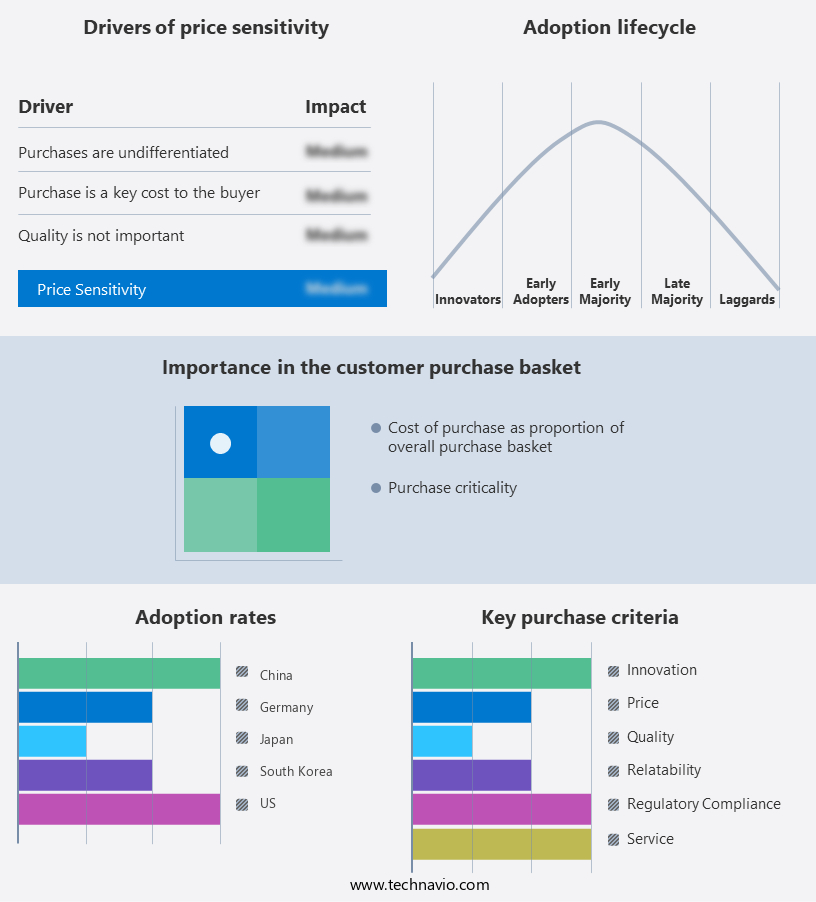
The market forecasting report includes the adoption lifecycle of the market, covering from the innovator's stage to the laggard's stage. It focuses on adoption rates in different regions based on penetration. Furthermore, the report also includes key purchase criteria and drivers of price sensitivity to help companies evaluate and develop their market growth analysis strategies.
Customer Landscape
Key Companies & Market Insights
Companies are implementing various strategies, such as strategic alliances, partnerships, mergers and acquisitions, geographical expansion, and product/service launches, to enhance their presence in the market.
AMETEK Inc. - The company offers RF Amplifiers such as Teseq, IFI and Milmega.
The market research and growth report includes detailed analyses of the competitive landscape of the market and information about key companies, including:
- Analog Devices Inc.
- API Microelectronics Ltd.
- Baylin Technologies Inc
- BONN Elektronik GmbH
- Broadcom Inc.
- CML Microsystems Plc
- Electronics and Innovation Ltd.
- Empower RF Systems Inc.
- Infinite Electronics Inc.
- MACOM Technology Solutions Inc.
- Mini-Circuits
- NuWaves Engineering
- NXP Semiconductors NV
- Ophir RF Inc.
- Qorvo Inc.
- Qualcomm Inc.
- Satellink Inc.
- Skyworks Solutions Inc.
- Texas Instruments Inc.
Qualitative and quantitative analysis of companies has been conducted to help clients understand the wider business environment as well as the strengths and weaknesses of key market players. Data is qualitatively analyzed to categorize companies as pure play, category-focused, industry-focused, and diversified; it is quantitatively analyzed to categorize companies as dominant, leading, strong, tentative, and weak.
Research Analyst Overview
The market is witnessing significant growth due to the increasing demand for wireless connectivity in various industries, including cellular phones, radios, Bluetooth, Wi-Fi technology, and the Internet of Things. RF engineering plays a crucial role in designing and developing RF components, such as power amplifiers, transceiver filters, RF switches, and PA devices, to meet the requirements of these applications. The RF spectrum is becoming increasingly crowded, with the proliferation of 5G mobile subscriptions and the expansion of cellular networks. The base station market is a major consumer of RF amplifiers, with defense contractors and aerospace industries also being significant buyers for defense equipment and electronic warfare applications.
Additionally, the automotive industry is also adopting RF technology for wireless integration in vehicles, including automotive radar and integrated approach vs. Discrete approach in RF design. The economic downturn has led to higher initial investments and lower profit margins for RF component manufacturers, leading to complex designs and engineering and manufacturing process challenges. Emerging trends in RF technology include miniaturization, energy efficiency, and waste heat elimination. Patent methods and collaborations are crucial for RF component manufacturers to stay competitive in the market. The competition landscape is intensifying, with established market players like NXP Semiconductors and Texas Instruments facing competition from startups and acquisitions.
In summary, the market is expected to grow further with the adoption of 5G technology, next-generation wireless, and wireless sensors. However, high costs, large size, and high power consumption remain challenges for RF component manufacturers. Functional properties, such as gain values, noise factors, and crosstalk attenuation, and nonfunctional properties, such as long-term reliability and thermal constraints, are essential considerations in overall RF design.
|
Market Scope |
|
|
Report Coverage |
Details |
|
Page number |
152 |
|
Base year |
2023 |
|
Historic period |
2018-2022 |
|
Forecast period |
2024-2028 |
|
Growth momentum & CAGR |
Accelerate at a CAGR of 14.76% |
|
Market growth 2024-2028 |
USD 31.5 billion |
|
Market structure |
Fragmented |
|
YoY growth 2023-2024(%) |
12.58 |
|
Regional analysis |
APAC, North America, Europe, Middle East and Africa, and South America |
|
Performing market contribution |
APAC at 51% |
|
Key countries |
US, China, Japan, Germany, and South Korea |
|
Competitive landscape |
Leading Companies, Market Positioning of Companies, Competitive Strategies, and Industry Risks |
|
Key companies profiled |
AMETEK Inc., Analog Devices Inc., API Microelectronics Ltd., Baylin Technologies Inc, BONN Elektronik GmbH, Broadcom Inc., CML Microsystems Plc, Electronics and Innovation Ltd., Empower RF Systems Inc., Infinite Electronics Inc., MACOM Technology Solutions Inc., Mini-Circuits, NuWaves Engineering, NXP Semiconductors NV, Ophir RF Inc., Qorvo Inc., Qualcomm Inc., Satellink Inc., Skyworks Solutions Inc., and Texas Instruments Inc. |
|
Market dynamics |
Parent market analysis, market growth inducers and obstacles, market forecast, fast-growing and slow-growing segment analysis, COVID-19 impact and recovery analysis and future consumer dynamics, market condition analysis for the forecast period |
|
Customization purview |
If our market report has not included the data that you are looking for, you can reach out to our analysts and get segments customized. |
What are the Key Data Covered in this Market Research and Growth Report?
- CAGR of the market during the forecast period
- Detailed information on factors that will drive the market growth and forecasting between 2024 and 2028
- Precise estimation of the size of the market and its contribution of the market in focus to the parent market
- Accurate predictions about upcoming market growth and trends and changes in consumer behaviour
- Growth of the market across APAC, North America, Europe, Middle East and Africa, and South America
- Thorough analysis of the market's competitive landscape and detailed information about companies
- Comprehensive analysis of factors that will challenge the growth of market companies
We can help! Our analysts can customize this market research report to meet your requirements. Get in touch
 RIA -
RIA - 
