Robotic Cutting, Deburring, and Finishing Market Size 2024-2028
The robotic cutting, deburring, and finishing market size is forecast to increase by USD 4.47 billion at a CAGR of 9.72% between 2023 and 2028.
- The market is experiencing significant growth due to the increasing demand for industrial robots capable of executing intricate tasks with precision. Technological advancements in robotics services, particularly in the areas of automation and flexibility, are driving this trend. However, the high cost of services for industrial robots poses a significant challenge for market growth. Companies must carefully weigh the benefits of automation against the investment required to implement these technologies. To capitalize on market opportunities, businesses should focus on offering cost-effective solutions and providing value-added services to offset the initial expense.
- Additionally, collaborating with robotics manufacturers to develop customized, affordable robotic systems could help mitigate the cost barrier and expand market reach. Overall, the market is poised for growth, with technological innovations and the demand for customized solutions driving demand. Companies must navigate the high cost of services to effectively capitalize on these opportunities.
What will be the Size of the Robotic Cutting, Deburring, and Finishing Market during the forecast period?

- The market continues to evolve, driven by advancements in technologies such as collaborative robots, industrial robots, data analytics, part handling, industrial manufacturing, deep learning, automated cutting, data acquisition, process integration, human-robot collaboration, cutting tools, CNC cutting, and cloud computing. These technologies are seamlessly integrated into manufacturing processes, enabling smart manufacturing in various sectors, including medical device manufacturing and plastic processing. Robotic automation, machine learning, and machine vision are transforming deburring processes, ensuring precise and consistent results. Edge computing and data analytics facilitate real-time process optimization, predictive maintenance, and cycle time reduction. Collaborative robots and human-robot collaboration enable safe and efficient material handling and workpiece processing.
- Robotic cells, including those for robotic welding and robotic cutting, are becoming more sophisticated, with advanced safety systems, virtual commissioning, and process monitoring capabilities. Finishing systems, including deburring robots and finishing tools, are integrating with process integration and quality control systems to ensure consistent surface finishing and improve overall product quality. The market dynamics are continuously unfolding, with new applications and collaborations emerging in areas such as metal fabrication, plasma cutting, and laser cutting. System integration and digital twin technologies are enabling more efficient and effective manufacturing processes, while artificial intelligence and deep learning are driving innovation in process optimization and robot programming.
- Overall, the market is characterized by its ongoing evolution and dynamic nature, with new technologies and applications continually emerging to drive efficiency, productivity, and quality in manufacturing processes.
How is this Robotic Cutting, Deburring, and Finishing Industry segmented?
The robotic cutting, deburring, and finishing industry research report provides comprehensive data (region-wise segment analysis), with forecasts and estimates in "USD billion" for the period 2024-2028, as well as historical data from 2018-2022 for the following segments.
- End-user
- Automotive industry
- Metal industry
- Electronics industry
- Others
- Product
- 6-axis and 7-axis
- 3-axis to 5-axis
- End-User
- OEMs
- System Integrators
- Technology Specificity
- Laser Cutting
- Water Jet Cutting
- Plasma Cutting
- Grinding
- Geography
- North America
- US
- Mexico
- Europe
- France
- Germany
- Italy
- Spain
- UK
- Middle East and Africa
- UAE
- APAC
- Australia
- China
- India
- Japan
- South Korea
- South America
- Brazil
- Rest of World (ROW)
- North America
By End-user Insights
The automotive industry segment is estimated to witness significant growth during the forecast period.
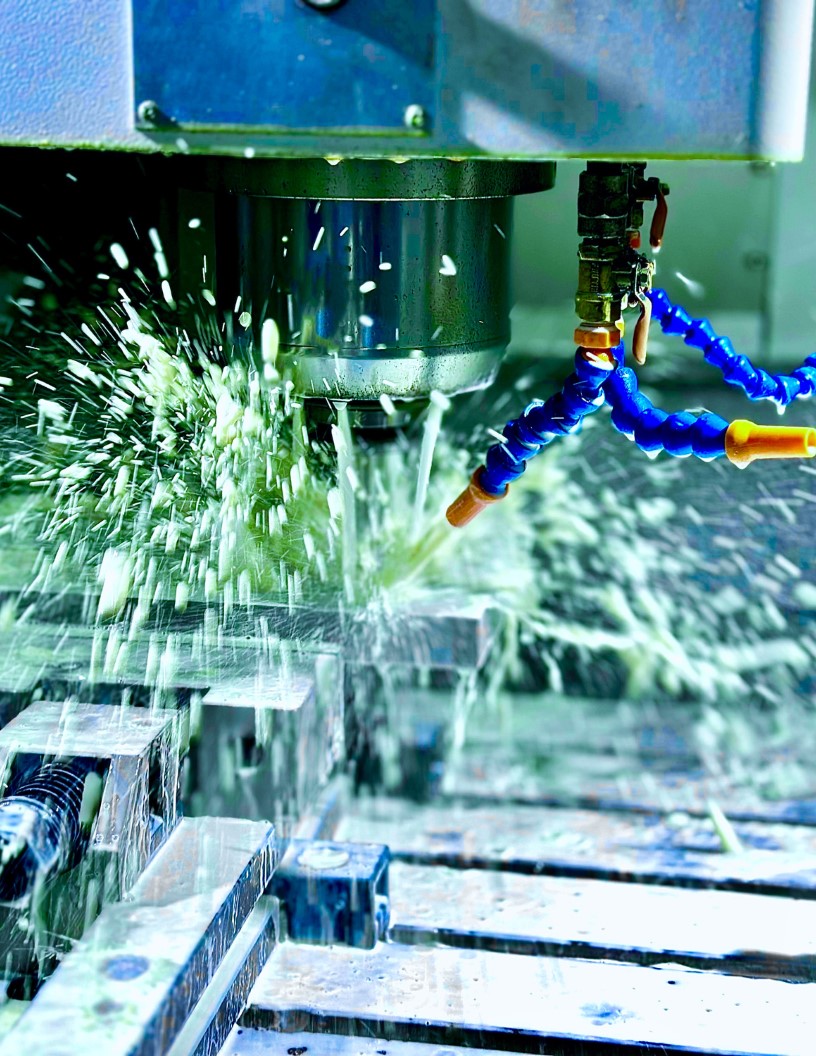
Industrial robots are increasingly being adopted in the automotive industry to streamline manufacturing processes, boost production, enhance quality, minimize scrap, and improve worker safety and energy efficiency. Robotic cutting, deburring, and finishing processes are essential for optimizing operations in this sector. Robotic cutting systems, which utilize technologies like waterjet cutting and plasma cutting, are widely used for precise metal component cutting, such as car bodies and chassis elements. Deburring robots, equipped with advanced deburring tools and machine vision systems, ensure consistent edge finishing and surface quality. Smart manufacturing, machine learning, and edge computing enable real-time process integration, data acquisition, and predictive maintenance, further enhancing the efficiency of these processes.
Collaborative robots and industrial robots, integrated with human-robot collaboration features, enable safer and more efficient workflows. Robotic welding, finishing systems, and material handling solutions are also crucial components of the automotive manufacturing ecosystem. Robotic cells, powered by artificial intelligence and deep learning algorithms, facilitate process optimization and quality control through offline programming, process monitoring, and cycle time reduction. Overall, the integration of these advanced technologies in the automotive manufacturing sector is driving the market towards increased automation, improved productivity, and reduced costs.
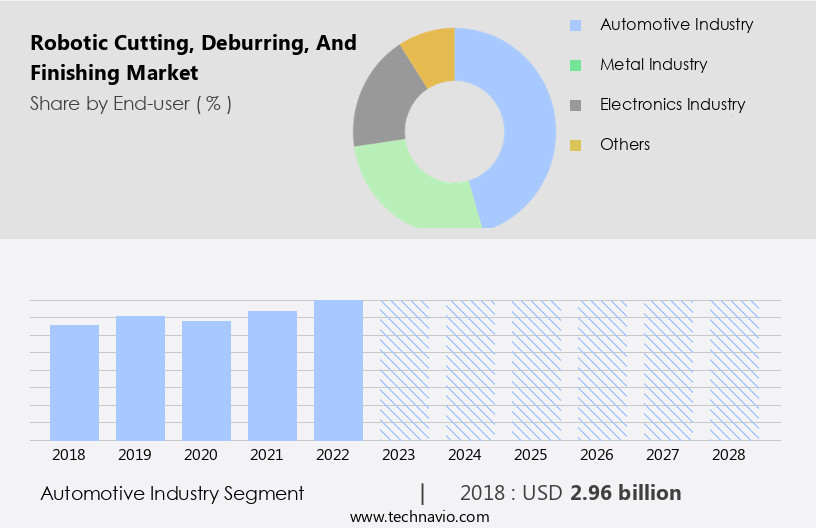
The Automotive industry segment was valued at USD 2.96 billion in 2018 and showed a gradual increase during the forecast period.
Regional Analysis
APAC is estimated to contribute 43% to the growth of the global market during the forecast period.Technavio's analysts have elaborately explained the regional trends and drivers that shape the market during the forecast period.
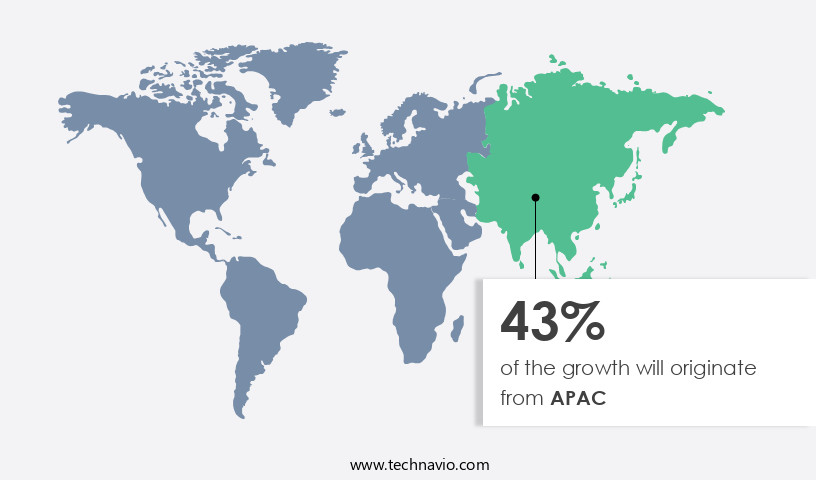
The market is witnessing significant growth in APAC, particularly in countries like China, Japan, South Korea, Taiwan, and India. This region is a major contributor to market revenue, with a strong presence of leading foreign manufacturers and system integrators. The automotive, F & B, metals, textiles, chemicals, and pharmaceuticals industries are driving demand in this region. Advancements in internet and remote systems technology are also fueling market growth, enabling services such as remote monitoring, virtual commissioning, and offline programming. In addition, the adoption of smart manufacturing, machine learning, and artificial intelligence in industrial manufacturing processes is increasing the demand for robotic automation in deburring and finishing applications.
Local system integrators and industrial robot manufacturers are expected to emerge in APAC, challenging international companies. Plastic processing, laser cutting, and plasma cutting are other sectors that are benefiting from the adoption of robotic technologies for cutting, deburring, and finishing processes. The integration of data analytics, process optimization, and predictive maintenance systems is further enhancing the efficiency and productivity of these processes. Robot programming, quality control, and safety systems are essential components of these applications, ensuring precision and consistency in the final product. The use of collaborative robots and industrial robots, along with finishing tools and end effectors, is enabling human-robot collaboration and improving surface finishing processes.
Cloud computing and system integration are also facilitating the seamless integration of various manufacturing processes, reducing cycle time and improving overall process efficiency.
Market Dynamics
Our researchers analyzed the data with 2023 as the base year, along with the key drivers, trends, and challenges. A holistic analysis of drivers will help companies refine their marketing strategies to gain a competitive advantage.
The Global Robotic Cutting, Deburring, and Finishing Market grows with robotic cutting for automotive and deburring robots for metal fabrication. Robotic finishing market trends highlight 6-axis robotic cutting systems and AI-driven deburring robots. Robotic finishing for aerospace and robotic cutting for electronics drive demand, per robotic cutting market forecast. Laser cutting robots for precision leverage robotic finishing with automation, while robotic deburring for consumer goods ensures quality. Robotic cutting for heavy industry and robotic finishing for semiconductors enhance efficiency. Robotic deburring for medical devices, sustainable robotic cutting solutions, and robotic finishing for smart manufacturing optimize performance. Robotic cutting for industrial automation, advanced robotic deburring technologies, robotic finishing supply chain, robotic cutting for high-volume production, robotic deburring for safety compliance, and robotic finishing for global markets.
What are the key market drivers leading to the rise in the adoption of Robotic Cutting, Deburring, and Finishing Industry?
- The surge in demand for industrial robots, particularly those capable of executing intricately customized tasks, serves as the primary market driver.
- The market is experiencing significant growth due to the increasing automation of industrial processes. Industrial robots are being adopted to optimize processes, reduce cycle times, and enhance quality control. End effectors, such as those used for laser cutting and surface finishing, are essential components of these robotic systems. Process monitoring and predictive maintenance are also critical aspects of robotic automation, ensuring efficient and uninterrupted production. Small and medium-sized businesses are turning to robots and automation to address capacity constraints and labor shortages. In Japan, for instance, labor shortages are expected to intensify, making automation an attractive solution.
- The market is expected to witness increased investments in these technologies during the forecast period. Robot programming and offline programming are essential for efficient and accurate robot operation. Digital twin technology enables virtual simulation and testing of robotic processes, further enhancing process optimization and reducing errors. Workpiece handling and surface finishing are key applications of robotic automation, providing significant benefits in terms of improved quality, increased productivity, and reduced labor costs. In conclusion, the market is experiencing robust growth due to the increasing demand for process optimization, automation, and labor efficiency in industrial applications. Technological advancements and investments in R&D will continue to drive market growth during the forecast period.
What are the market trends shaping the Robotic Cutting, Deburring, and Finishing Industry?
- Industrial robotics services are experiencing a significant trend towards technological innovations. This upward market movement is driven by advancements in automation technology.
- The market is witnessing significant advancements due to the integration of innovative technologies such as machine vision, edge computing, and machine learning (ML) in industrial processes. Waterjet cutting, a popular robotic cutting technique, is benefiting from the adoption of machine vision for improved accuracy and precision. Deburring tools are being enhanced with robotic automation and ML algorithms for efficient deburring of complex geometries. Smart manufacturing is driving the demand for advanced deburring robots and finishing systems. These systems enable real-time monitoring and control, reducing the need for manual intervention. In the medical device manufacturing sector, robotic welding is gaining popularity for its ability to produce high-quality welds with consistent repeatability.
- Machine tools are being upgraded with advanced software platforms for virtual commissioning and offline programming, enabling faster setup times and increased productivity. ABB, YASKAWA ELECTRIC CORP., KUKA, and FANUC are some of the leading players offering advanced software solutions to improve the efficiency of press tending robots and deburring systems. The integration of IoT and software platforms is revolutionizing the industrial landscape, enabling seamless communication between machines and systems, and paving the way for more efficient and productive manufacturing processes.
What challenges does the Robotic Cutting, Deburring, and Finishing Industry face during its growth?
- The escalating costs of industrial robotic services pose a significant challenge to the industry's growth trajectory. Industrial robots, including collaborative models, continue to revolutionize manufacturing processes through automated cutting, deburring, and finishing. Data analytics plays a pivotal role in optimizing these applications, enabling real-time process monitoring and predictive maintenance. Industrial manufacturing firms are increasingly adopting deep learning algorithms and data acquisition systems for process integration and improved efficiency. Collaborative robots facilitate human-robot collaboration, allowing for part handling tasks to be shared between workers and machines. Cutting tools, such as CNC cutting systems, are enhanced by the integration of robots, ensuring precision and consistency. Cloud computing further streamlines operations by providing remote access to data and enabling real-time collaboration.
- Companies in the market face the challenge of ensuring seamless system integration for their clients. This involves navigating contracts, competitive bidding, and evaluations before robots can be deployed. While system integrators offer software packages for easier robot programming and integration, significant investment in system engineering is required to make the process as efficient as possible. Ultimately, the focus is on minimizing any potential loss of time or money for end-users.
Exclusive Customer Landscape
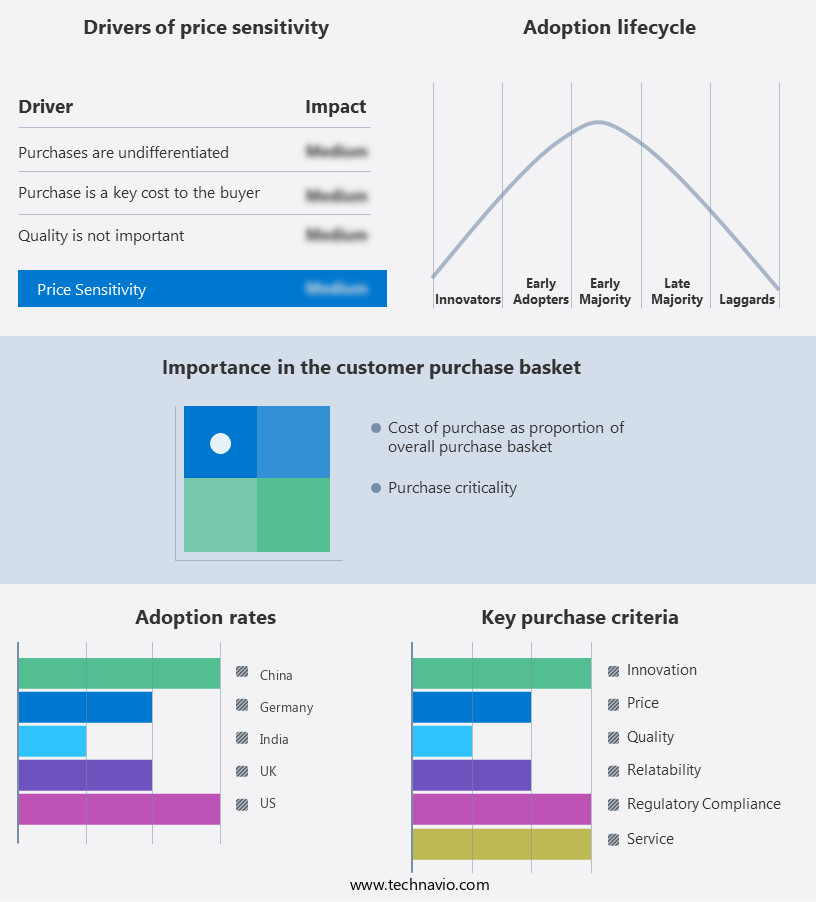
The robotic cutting, deburring, and finishing market forecasting report includes the adoption lifecycle of the market, covering from the innovator's stage to the laggard's stage. It focuses on adoption rates in different regions based on penetration. Furthermore, the robotic cutting, deburring, and finishing market report also includes key purchase criteria and drivers of price sensitivity to help companies evaluate and develop their market growth analysis strategies.
Customer Landscape
Key Companies & Market Insights
Companies are implementing various strategies, such as strategic alliances, robotic cutting, deburring, and finishing market forecast, partnerships, mergers and acquisitions, geographical expansion, and product/service launches, to enhance their presence in the industry.
ABB - This company specializes in robotic solutions for casting processing, encompassing cutting, deburring, and finishing techniques. Our offerings include cast cleaning and machining services, enhancing production efficiency and product quality. By leveraging advanced robotics technology, we deliver precise and consistent results, reducing manual labor and associated errors. Our commitment to innovation and excellence sets US apart in the industry, ensuring optimal value for clients.
The industry research and growth report includes detailed analyses of the competitive landscape of the market and information about key companies, including:
- ABB
- Fanuc
- KUKA
- Yaskawa
- Kawasaki Robotics
- Universal Robots
- Staubli
- Comau
- Denso Robotics
- Mitsubishi Electric
- Nachi Robotics
- Omron Adept
- Hyundai Robotics
- Doosan Robotics
- Epson Robotics
- Techman Robot
- SIASUN
- Estun Automation
- Hans Laser
- HGTech
Qualitative and quantitative analysis of companies has been conducted to help clients understand the wider business environment as well as the strengths and weaknesses of key industry players. Data is qualitatively analyzed to categorize companies as pure play, category-focused, industry-focused, and diversified; it is quantitatively analyzed to categorize companies as dominant, leading, strong, tentative, and weak.
Recent Development and News in Robotic Cutting, Deburring, And Finishing Market
- In January 2024, ABB, a leading industrial automation company, introduced its new robotic deburring solution, "Flexible Deburring Cell," which combines robotic cutting, deburring, and finishing capabilities in a single system. This innovation allows manufacturers to automate complex deburring tasks, reducing production time and labor costs (ABB Press Release).
- In March 2025, Sandvik and General Electric (GE) announced a strategic partnership to integrate Sandvik's robotic cutting and deburring solutions with GE's Additive Manufacturing Systems. This collaboration aims to streamline the production process for metal 3D-printed parts by automating the post-processing stage (Sandvik Press Release).
- In July 2025, Bosch Rexroth, a leading supplier of industrial technology, completed the acquisition of German robotics company, KUKA. This merger is expected to strengthen Bosch Rexroth's position in the market, providing access to KUKA's advanced automation technologies and expanding its customer base (Bosch Rexroth Press Release).
Research Analyst Overview
The market is experiencing significant growth as industries seek to enhance material removal processes and improve surface treatment for part quality. Robotic grinding and automated inspection are key technologies driving this trend, enabling process efficiency and defect detection. Modular robots and advanced robotics are revolutionizing manufacturing, allowing for flexible automation and dimensional accuracy. Autonomous systems and predictive analytics are also transforming the market, enabling real-time process validation and quality assurance. Three-dimensional printing (3D printer) and additive manufacturing are further expanding the market's reach, offering new possibilities for surface integrity and cost savings. Burr removal and edge preparation are essential aspects of the robotic workforce, ensuring part quality and tolerance control.
Shot peening and laser ablation are additional surface treatment techniques that offer cost savings and lead time reduction. Reconfigurable systems enable remote monitoring and enable manufacturers to adapt to changing production demands. Overall, the market for robotic cutting, deburring, and finishing is dynamic and innovative, with a focus on improving process efficiency, enhancing surface treatment, and ensuring part quality. The integration of advanced technologies, such as autonomous systems and predictive analytics, is leading to new possibilities and cost savings.
Dive into Technavio's robust research methodology, blending expert interviews, extensive data synthesis, and validated models for unparalleled Robotic Cutting, Deburring, and Finishing Market insights. See full methodology.
|
Market Scope |
|
|
Report Coverage |
Details |
|
Page number |
159 |
|
Base year |
2023 |
|
Historic period |
2018-2022 |
|
Forecast period |
2024-2028 |
|
Growth momentum & CAGR |
Accelerate at a CAGR of 9.72% |
|
Market growth 2024-2028 |
USD 4.47 billion |
|
Market structure |
Concentrated |
|
YoY growth 2023-2024(%) |
9.22 |
|
Key countries |
US, China, Germany, Japan, UK, Australia, India, France, Brazil, UAE, Rest of World (ROW), Saudi Arabia, France, South Korea, Mexico, Italy, and Spain |
|
Competitive landscape |
Leading Companies, Market Positioning of Companies, Competitive Strategies, and Industry Risks |
What are the Key Data Covered in this Robotic Cutting, Deburring, and Finishing Market Research and Growth Report?
- CAGR of the Robotic Cutting, Deburring, and Finishing industry during the forecast period
- Detailed information on factors that will drive the growth and forecasting between 2024 and 2028
- Precise estimation of the size of the market and its contribution of the industry in focus to the parent market
- Accurate predictions about upcoming growth and trends and changes in consumer behaviour
- Growth of the market across APAC, Europe, North America, South America, and Middle East and Africa
- Thorough analysis of the market's competitive landscape and detailed information about companies
- Comprehensive analysis of factors that will challenge the robotic cutting, deburring, and finishing market growth of industry companies
We can help! Our analysts can customize this robotic cutting, deburring, and finishing market research report to meet your requirements.
 RIA -
RIA - 
