Securities Exchanges Market Analysis, Size, and Forecast 2026-2030: APAC (China, Japan, and India), North America (US, Canada, and Mexico), Europe (UK, The Netherlands, and Germany), South America (Brazil and Argentina), Middle East and Africa (South Africa and Saudi Arabia), and Rest of World (ROW)

Securities Exchanges Market Analysis, Size, and Forecast 2026-2030:
APAC (China, Japan, and India), North America (US, Canada, and Mexico), Europe (UK, The Netherlands, and Germany), South America (Brazil and Argentina), Middle East and Africa (South Africa and Saudi Arabia), and Rest of World (ROW)

Published: Mar 2026 303 Pages SKU: IRTNTR75577

Market Overview at a Glance

$65.02 B
Market Opportunity
12.8%
CAGR 2025 - 2030
39.1%
APAC Growth
$40.15 B
Market platforms segment 2024

Securities Exchanges Market Size 2026-2030

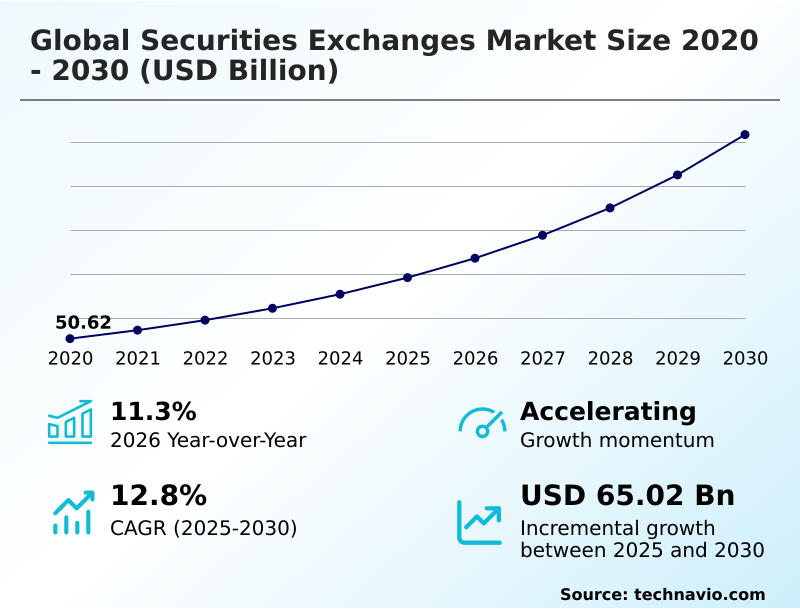
The securities exchanges market size is valued to increase by USD 65.02 billion, at a CAGR of 12.8% from 2025 to 2030. Growing demand for investment opportunities will drive the securities exchanges market.

Major Market Trends & Insights

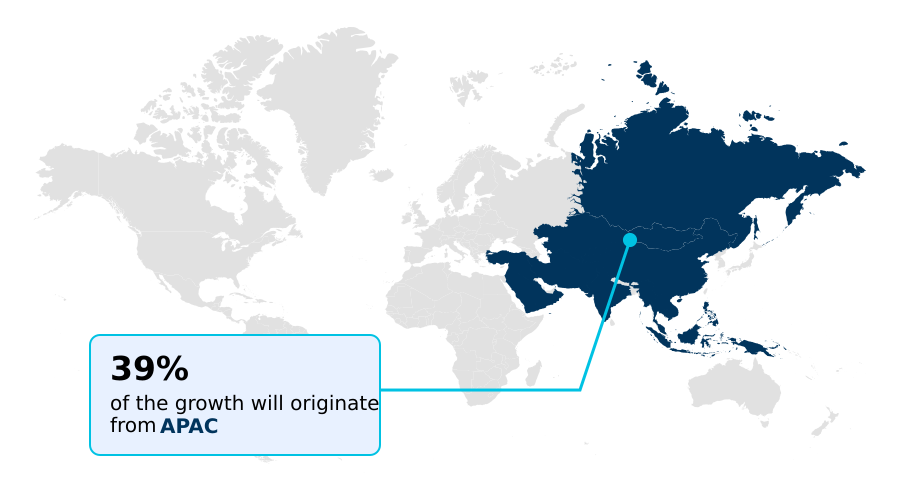
  • APAC dominated the market and accounted for a 39.1% growth during the forecast period.
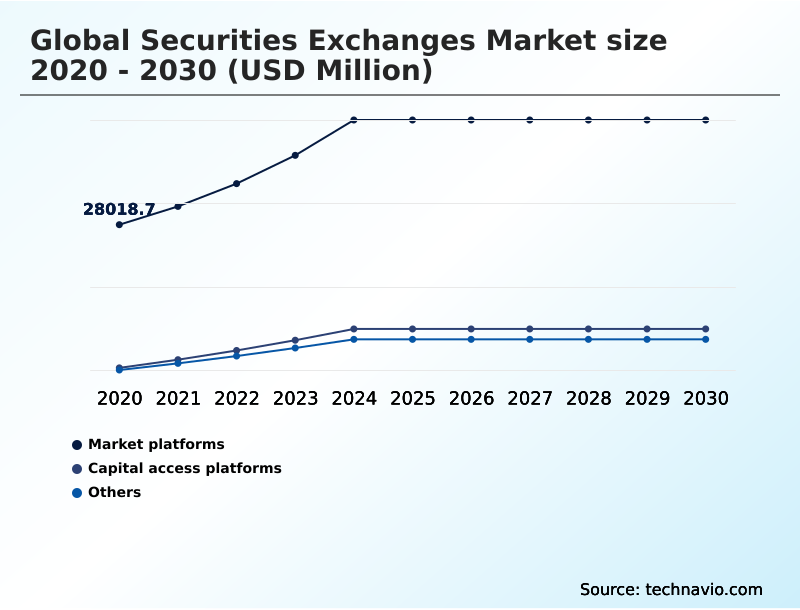
  • By Service - Market platforms segment was valued at USD 40.15 billion in 2024
  • By Trade Finance Instruments - Equities segment accounted for the largest market revenue share in 2024

Market Size & Forecast

  • Market Opportunities: USD 92.75 billion
  • Market Future Opportunities: USD 65.02 billion
  • CAGR from 2025 to 2030 : 12.8%

Market Summary

  • The securities exchanges market is undergoing a significant transformation, driven by technological innovation and evolving regulatory landscapes. Core operations are being enhanced through the adoption of advanced technologies like AI-driven market surveillance systems and distributed ledger technology, which promise greater efficiency and security.
  • This shift is a direct response to the demands of high-frequency trading and the need for low-latency execution environments. Exchanges are also diversifying their revenue streams beyond simple transaction fees, moving into high-margin areas such as market data feeds and index licensing.
  • A key trend is the democratization of market access, with online platforms empowering a new generation of retail investors. For instance, an asset management firm now leverages sophisticated algorithmic trading strategies, using real-time data analytics to optimize its portfolio and manage risk in a market characterized by increasing speed and complexity.
  • However, this digitalization also introduces challenges, including heightened cybersecurity risks and the complexities of navigating market fragmentation across different trading venues.

What will be the Size of the Securities Exchanges Market during the forecast period?

Get Key Insights on Market Forecast (PDF) Request Free Sample

How is the Securities Exchanges Market Segmented?

The securities exchanges industry research report provides comprehensive data (region-wise segment analysis), with forecasts and estimates in "USD million" for the period 2026-2030, as well as historical data from 2020-2024 for the following segments.

  • Service
    • Market platforms
    • Capital access platforms
    • Others
  • Trade finance instruments
    • Equities
    • Derivatives
    • Bonds
    • Exchange-traded funds
    • Others
  • Type
    • Large-cap exchanges
    • Mid-cap exchanges
    • Small-cap exchanges
  • Geography
    • APAC
      • China
      • Japan
      • India
    • North America
      • US
      • Canada
      • Mexico
    • Europe
      • UK
      • The Netherlands
      • Germany
    • South America
      • Brazil
      • Argentina
    • Middle East and Africa
      • South Africa
      • Saudi Arabia
    • Rest of World (ROW)

By Service Insights

The market platforms segment is estimated to witness significant growth during the forecast period.

Market platforms are the foundational service segment, providing the core infrastructure for trading activities.

These securities trading platforms are defined by their electronic order matching engine, which processes bids and asks from the order book to establish prices in lit markets.

Institutional investors and prime brokerage firms rely on these systems for executing trades and accessing real-time market data feeds. Exchanges generate revenue from equity listing and corporate bond issuance, facilitating initial public offering (IPO) events and other capital formation services.

The entire trade lifecycle management, from order placement to execution, is managed within this segment, with automation driving down paperwork and processing costs by over 70% for some participants.

Request Free Sample

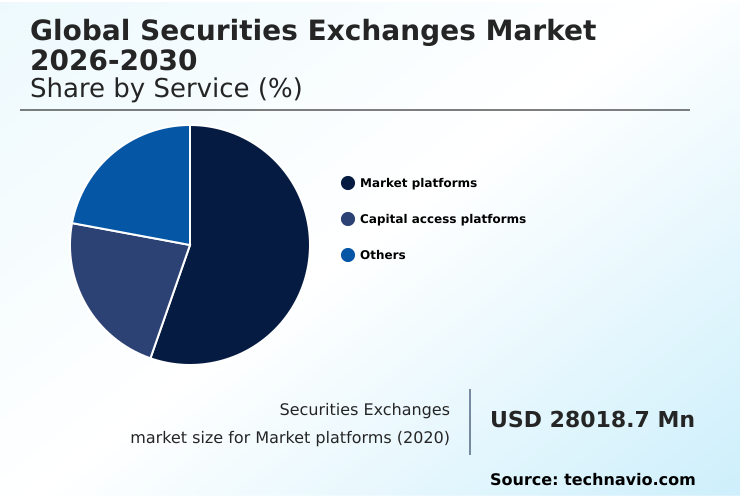
The Market platforms segment was valued at USD 40.15 billion in 2024 and showed a gradual increase during the forecast period.

Request Free Sample

Regional Analysis

APAC is estimated to contribute 39.1% to the growth of the global market during the forecast period.Technavio’s analysts have elaborately explained the regional trends and drivers that shape the market during the forecast period.

See How Securities Exchanges Market Demand is Rising in APAC Request Free Sample

The geographic landscape is characterized by intense competition and regional specialization, contributing to market fragmentation. North America continues to lead in innovation, especially around the T+1 settlement cycle, which compels upgrades to financial market infrastructure.

The region also sees a high volume of secondary offering and special purpose acquisition company (SPAC) transactions.

Meanwhile, APAC is the fastest-growing region, contributing over 39% of the market's incremental growth, driven by strong cross-border listing activity and a focus on improving cross-border settlement through its central securities depository networks.

The market microstructure in Europe is adapting to post-Brexit realities, influencing block trading and post-trade services. A robust risk management framework is becoming a global standard, essential for maintaining stability as markets become more interconnected.

Market Dynamics

Our researchers analyzed the data with 2025 as the base year, along with the key drivers, trends, and challenges. A holistic analysis of drivers will help companies refine their marketing strategies to gain a competitive advantage.

  • The strategic agenda for securities exchanges is increasingly shaped by a complex interplay of regulatory mandates and technological disruption. A central topic is the impact of T+1 settlement on liquidity, forcing firms to re-engineer post-trade settlement automation benefits to maintain efficiency.
  • Simultaneously, the role of AI in market surveillance systems is becoming critical for ensuring integrity, especially with the proliferation of high-frequency trading latency reduction techniques. This technological race extends to exploring the benefits of using colocation services for competitive advantage.
  • A fundamental debate continues around decentralized finance vs traditional exchanges, a conversation amplified by the tokenization of real-world assets and rising cybersecurity risks in digital asset exchanges. Exchanges are also comparing lit vs dark pool liquidity to optimize market structure.
  • Product innovation is accelerating, driven by the growth drivers for thematic ETFs and the rising popularity of the direct listing vs traditional IPO process. Operationally, the evolution of real-time market data feeds and the adoption of regulatory technology for trade reporting are paramount.
  • The focus is also on strengthening clearing mechanisms for OTC derivatives, managing risk in derivatives clearing, and understanding the role of securities lending in passive investing. Finally, exchanges are innovating the future of corporate bond issuance platforms and refining smart order routing in fragmented markets to meet the ESG criteria for stock exchange listings.

What are the key market drivers leading to the rise in the adoption of Securities Exchanges Industry?

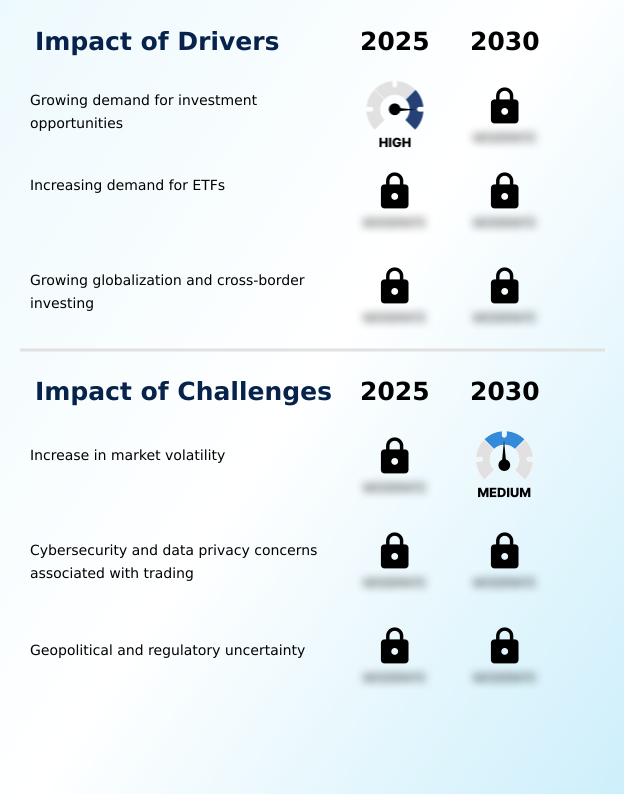
  • The growing demand for diverse investment opportunities is a key driver propelling the growth of the securities exchanges market.

  • Market growth is fueled by an insatiable demand for sophisticated trading capabilities and investment products.
  • The proliferation of algorithmic trading and high-frequency trading, which now accounts for over 50% of equity volume in developed markets, necessitates investments in low latency trading infrastructure and colocation services. This demand for speed enhances the efficiency of straight-through processing.
  • The expansion of derivatives trading, including options trading and futures contracts, provides critical risk management tools for corporations and investors. Furthermore, the popularity of passive and thematic investing has boosted ETF creation and redemption activities, driving significant volumes.
  • The ecosystem is also supported by innovations in smart order routing, which optimizes execution across multiple venues. The growth in securities financing and the issuance of specialized products like social bonds further diversify the market's offerings and revenue streams.

What are the market trends shaping the Securities Exchanges Industry?

  • An increasing focus on sustainable and environmental, social, and governance (ESG) factors is a significant market trend, influencing investment decisions and product development across securities exchanges.

  • Key trends are reshaping the securities exchanges market, driven by shifts in investor preferences and technological capabilities. The focus on sustainable finance instruments, including green bonds, has surged, with ESG-related assets under management growing by over 20% annually in some regions. This trend has fueled the popularity of thematic ETFs.
  • Concurrently, the rise of commission-free retail investor platforms has democratized access, leading to a significant increase in market participation. Technology is a primary enabler, with distributed ledger technology and smart contracts paving the way for securities tokenization and the emergence of regulated digital asset exchanges.
  • The growth of these platforms, alongside traditional dark pools, is influencing market dynamics like payment for order flow. These innovations are creating new avenues for activities like securities lending, enhancing overall market efficiency.

What challenges does the Securities Exchanges Industry face during its growth?

  • An increase in market volatility presents a key challenge to the securities exchanges market, potentially impacting trading volumes and investor confidence.

  • The primary challenges facing the market revolve around maintaining integrity and stability in an increasingly complex and digital environment. The threat of sophisticated cyberattacks requires continuous investment in market surveillance systems, with spending on cybersecurity infrastructure increasing by an estimated 15% annually.
  • Regulators are focused on strengthening market integrity monitoring and ensuring robust anti-money laundering (AML) and know your customer (KYC) protocols are enforced. Central counterparty clearing houses face pressure to manage systemic risk, especially in derivatives clearing for volatile instruments.
  • The rise of alternative trading systems (ATS) contributes to a fragmented equity market structure, complicating the price discovery mechanism for both equities and fixed-income trading. Finally, the need for timely and accurate compliance reporting solutions adds significant operational cost, while activities like index licensing require constant vigilance to prevent misuse.

Exclusive Technavio Analysis on Customer Landscape

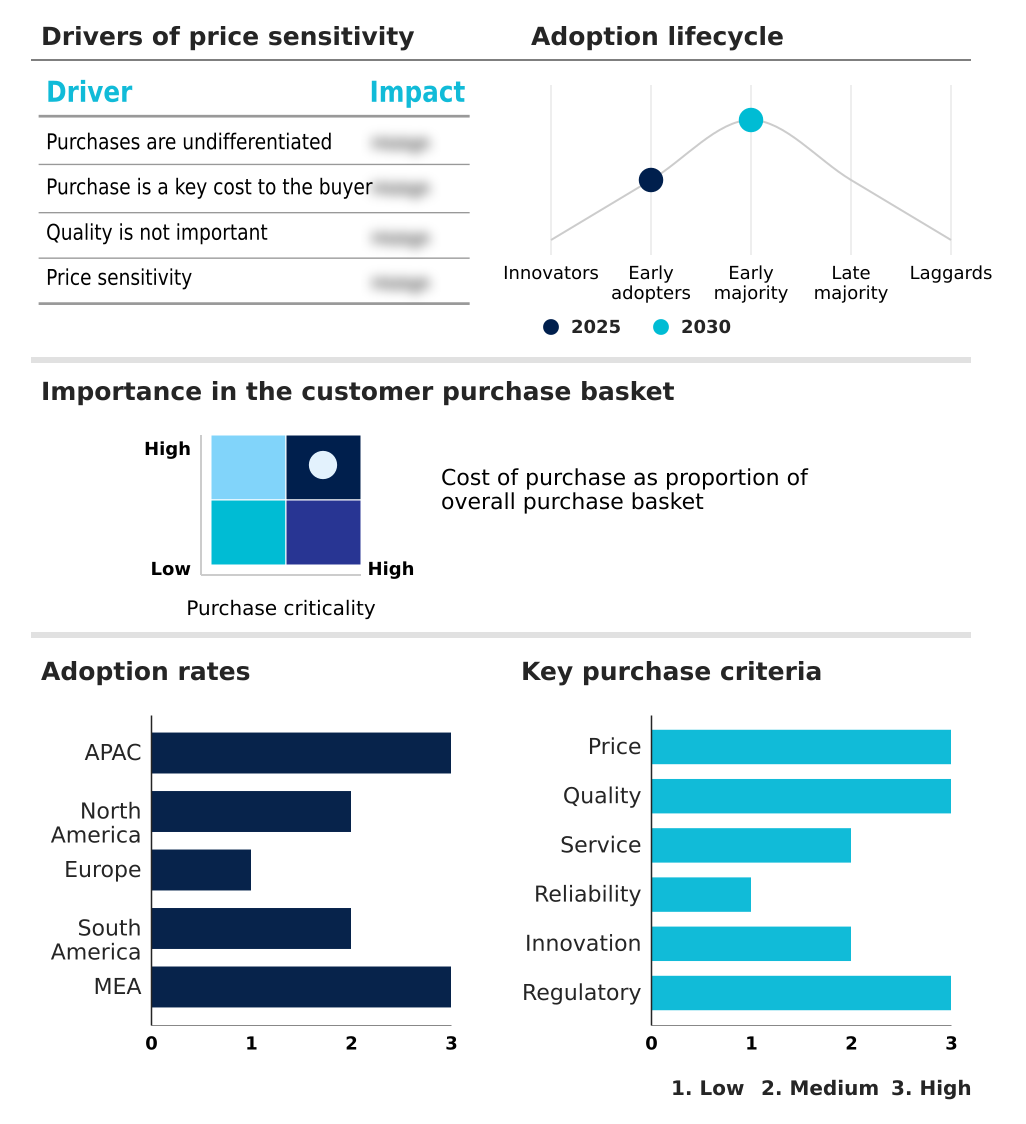
The securities exchanges market forecasting report includes the adoption lifecycle of the market, covering from the innovator’s stage to the laggard’s stage. It focuses on adoption rates in different regions based on penetration. Furthermore, the securities exchanges market report also includes key purchase criteria and drivers of price sensitivity to help companies evaluate and develop their market growth analysis strategies.

Customer Landscape of Securities Exchanges Industry

Competitive Landscape

Companies are implementing various strategies, such as strategic alliances, securities exchanges market forecast, partnerships, mergers and acquisitions, geographical expansion, and product/service launches, to enhance their presence in the industry.

ASX Ltd. - Core offerings encompass integrated platforms for equity and derivative trading, underpinned by advanced market technology and capital access solutions for issuers.

The industry research and growth report includes detailed analyses of the competitive landscape of the market and information about key companies, including:

  • ASX Ltd.
  • BSE Ltd.
  • Deutsche Borse AG
  • Dubai Financial Market PJSC
  • Euronext N.V.
  • Intercontinental Exchange Inc.
  • Japan Exchange Group Inc.
  • JSE Ltd.
  • London Stock Exchange Group plc
  • Moscow Exchange
  • Nasdaq Inc.
  • Shanghai Stock Exchange
  • SIX Group Ltd.
  • Taiwan Stock Exchange Corp.
  • The Korea Exchange
  • TMX Group Ltd.
  • Warsaw Stock Exchange

Qualitative and quantitative analysis of companies has been conducted to help clients understand the wider business environment as well as the strengths and weaknesses of key industry players. Data is qualitatively analyzed to categorize companies as pure play, category-focused, industry-focused, and diversified; it is quantitatively analyzed to categorize companies as dominant, leading, strong, tentative, and weak.

Recent Development and News in Securities exchanges market

  • In November, 2024, HKEX announced plans to open a new office in Riyadh to enhance financial connectivity between China and the Gulf region, supporting cross-border capital flows.
  • In January, 2025, a leading North American exchange group announced the acquisition of a regulatory technology firm to enhance its AI-powered market surveillance and anti-money laundering compliance solutions.
  • In March, 2025, a major European exchange operator partnered with a leading financial data provider to launch a comprehensive ESG analytics platform for institutional investors and asset managers.
  • In April, 2025, Cboe Global Markets announced its plan to launch options on the S&P 500 Equal Weight Index, aiming to meet growing market demand for broader diversification tools.

Dive into Technavio’s robust research methodology, blending expert interviews, extensive data synthesis, and validated models for unparalleled Securities Exchanges Market insights. See full methodology.

Market Scope
Page number 303
Base year 2025
Historic period 2020-2024
Forecast period 2026-2030
Growth momentum & CAGR Accelerate at a CAGR of 12.8%
Market growth 2026-2030 USD 65019.5 million
Market structure Fragmented
YoY growth 2025-2026(%) 11.3%
Key countries China, Japan, India, Hong Kong, Australia, Indonesia, US, Canada, Mexico, UK, The Netherlands, Germany, Switzerland, France, Italy, Brazil, Chile, Argentina, South Africa, Egypt, Nigeria, Morocco and Saudi Arabia
Competitive landscape Leading Companies, Market Positioning of Companies, Competitive Strategies, and Industry Risks

Request Free Sample

Research Analyst Overview

  • The securities exchanges market is in a state of perpetual evolution, driven by the dual forces of technology and regulation. Boardroom decisions are increasingly focused on strategic investments in regulatory technology (regtech) to navigate complex compliance mandates like the T+1 settlement cycle, which can reduce settlement failures by over 90%.
  • The core infrastructure, from the order matching engine to central counterparty clearing and post-trade settlement, is being re-engineered. The rise of algorithmic trading and high-frequency trading necessitates low latency trading environments supported by colocation services and robust market data feeds.
  • Exchanges are managing a diverse ecosystem of lit markets and dark pools, while innovating in derivatives trading, securities financing, and securities lending. The process for an equity listing, whether via a traditional initial public offering (IPO), secondary offering, or special purpose acquisition company (SPAC), is adapting.
  • Furthermore, the growth of the exchange-traded fund (ETF) and corporate bond issuance markets requires a sophisticated price discovery mechanism.
  • This landscape is shaped by market fragmentation, payment for order flow debates, and the emergence of distributed ledger technology and smart contracts, all while strengthening know your customer (KYC) and anti-money laundering (AML) frameworks within the central securities depository through straight-through processing. Index licensing and managing the order book for activities like block trading remain key revenue sources.

What are the Key Data Covered in this Securities Exchanges Market Research and Growth Report?

  • What is the expected growth of the Securities Exchanges Market between 2026 and 2030?

    • USD 65.02 billion, at a CAGR of 12.8%

  • What segmentation does the market report cover?

    • The report is segmented by Service (Market platforms, Capital access platforms, and Others), Trade Finance Instruments (Equities, Derivatives, Bonds, Exchange-traded funds, and Others), Type (Large-cap exchanges, Mid-cap exchanges, and Small-cap exchanges) and Geography (APAC, North America, Europe, South America, Middle East and Africa)

  • Which regions are analyzed in the report?

    • APAC, North America, Europe, South America and Middle East and Africa

  • What are the key growth drivers and market challenges?

    • Growing demand for investment opportunities, Increase in market volatility

  • Who are the major players in the Securities Exchanges Market?

    • ASX Ltd., BSE Ltd., Deutsche Borse AG, Dubai Financial Market PJSC, Euronext N.V., Intercontinental Exchange Inc., Japan Exchange Group Inc., JSE Ltd., London Stock Exchange Group plc, Moscow Exchange, Nasdaq Inc., Shanghai Stock Exchange, SIX Group Ltd., Taiwan Stock Exchange Corp., The Korea Exchange, TMX Group Ltd. and Warsaw Stock Exchange

Market Research Insights

  • The market's dynamism is driven by a strategic pivot toward technology-enabled services. Adoption of smart order routing through advanced securities trading platforms has improved best-execution rates by over 15% across increasingly fragmented market structures. Financial market infrastructure is evolving, with a focus on enhancing clearinghouse risk management and post-trade services.
  • The rise of retail investor platforms has democratized access, while institutional investors are leveraging new sustainable finance instruments and thematic ETFs. The integration of market integrity monitoring and compliance reporting solutions can reduce manual audit efforts by up to 60%, creating significant operational efficiencies.
  • This evolution is also fostering new opportunities in securities tokenization and the expansion of digital asset exchanges, reshaping capital formation services.

We can help! Our analysts can customize this securities exchanges market research report to meet your requirements.

Get in touch

1. Executive Summary

1.1 Market overview

Executive Summary - Chart on Market Overview
Executive Summary - Data Table on Market Overview
Executive Summary - Chart on Global Market Characteristics
Executive Summary - Chart on Market by Geography
Executive Summary - Chart on Market Segmentation by Service
Executive Summary - Chart on Market Segmentation by Trade Finance Instruments
Executive Summary - Chart on Market Segmentation by Type
Executive Summary - Chart on Incremental Growth
Executive Summary - Data Table on Incremental Growth
Executive Summary - Chart on Company Market Positioning

2. Technavio Analysis

2.1 Analysis of price sensitivity, lifecycle, customer purchase basket, adoption rates, and purchase criteria

2.2 Criticality of inputs and Factors of differentiation

Chart on Overview on criticality of inputs and factors of differentiation

2.3 Factors of disruption

Chart on Overview on factors of disruption

2.4 Impact of drivers and challenges

Chart on Impact of drivers and challenges in 2025 and 2030

3. Market Landscape

3.1 Market ecosystem

Chart on Parent Market
Data Table on - Parent Market

3.2 Market characteristics

Chart on Market characteristics analysis

3.3 Value chain analysis

Chart on Value chain analysis

4. Market Sizing

4.1 Market definition

Data Table on Offerings of companies included in the market definition

4.2 Market segment analysis

Market segments

4.3 Market size 2025

4.4 Market outlook: Forecast for 2025-2030

Chart on Global - Market size and forecast 2025-2030 ($ million)
Data Table on Global - Market size and forecast 2025-2030 ($ million)
Chart on Global Market: Year-over-year growth 2025-2030 (%)
Data Table on Global Market: Year-over-year growth 2025-2030 (%)

5. Historic Market Size

5.1 Global Securities Exchanges Market 2020 - 2024

Historic Market Size - Data Table on Global Securities Exchanges Market 2020 - 2024 ($ million)

5.2 Service segment analysis 2020 - 2024

Historic Market Size - Service Segment 2020 - 2024 ($ million)

5.3 Trade Finance Instruments segment analysis 2020 - 2024

Historic Market Size - Trade Finance Instruments Segment 2020 - 2024 ($ million)

5.4 Type segment analysis 2020 - 2024

Historic Market Size - Type Segment 2020 - 2024 ($ million)

5.5 Geography segment analysis 2020 - 2024

Historic Market Size - Geography Segment 2020 - 2024 ($ million)

5.6 Country segment analysis 2020 - 2024

Historic Market Size - Country Segment 2020 - 2024 ($ million)

6. Qualitative Analysis

6.1 The impact of AI in the global securities exchanges market

7. Five Forces Analysis

7.1 Five forces summary

Five forces analysis - Comparison between 2025 and 2030

7.2 Bargaining power of buyers

Bargaining power of buyers - Impact of key factors 2025 and 2030

7.3 Bargaining power of suppliers

Bargaining power of suppliers - Impact of key factors in 2025 and 2030

7.4 Threat of new entrants

Threat of new entrants - Impact of key factors in 2025 and 2030

7.5 Threat of substitutes

Threat of substitutes - Impact of key factors in 2025 and 2030

7.6 Threat of rivalry

Threat of rivalry - Impact of key factors in 2025 and 2030

7.7 Market condition

Chart on Market condition - Five forces 2025 and 2030

8. Market Segmentation by Service

8.1 Market segments

Chart on Service - Market share 2025-2030 (%)
Data Table on Service - Market share 2025-2030 (%)

8.2 Comparison by Service

Chart on Comparison by Service
Data Table on Comparison by Service

8.3 Market platforms - Market size and forecast 2025-2030

Chart on Market platforms - Market size and forecast 2025-2030 ($ million)
Data Table on Market platforms - Market size and forecast 2025-2030 ($ million)
Chart on Market platforms - Year-over-year growth 2025-2030 (%)
Data Table on Market platforms - Year-over-year growth 2025-2030 (%)

8.4 Capital access platforms - Market size and forecast 2025-2030

Chart on Capital access platforms - Market size and forecast 2025-2030 ($ million)
Data Table on Capital access platforms - Market size and forecast 2025-2030 ($ million)
Chart on Capital access platforms - Year-over-year growth 2025-2030 (%)
Data Table on Capital access platforms - Year-over-year growth 2025-2030 (%)

8.5 Others - Market size and forecast 2025-2030

Chart on Others - Market size and forecast 2025-2030 ($ million)
Data Table on Others - Market size and forecast 2025-2030 ($ million)
Chart on Others - Year-over-year growth 2025-2030 (%)
Data Table on Others - Year-over-year growth 2025-2030 (%)

8.6 Market opportunity by Service

Market opportunity by Service ($ million)
Data Table on Market opportunity by Service ($ million)

9. Market Segmentation by Trade Finance Instruments

9.1 Market segments

Chart on Trade Finance Instruments - Market share 2025-2030 (%)
Data Table on Trade Finance Instruments - Market share 2025-2030 (%)

9.2 Comparison by Trade Finance Instruments

Chart on Comparison by Trade Finance Instruments
Data Table on Comparison by Trade Finance Instruments

9.3 Equities - Market size and forecast 2025-2030

Chart on Equities - Market size and forecast 2025-2030 ($ million)
Data Table on Equities - Market size and forecast 2025-2030 ($ million)
Chart on Equities - Year-over-year growth 2025-2030 (%)
Data Table on Equities - Year-over-year growth 2025-2030 (%)

9.4 Derivatives - Market size and forecast 2025-2030

Chart on Derivatives - Market size and forecast 2025-2030 ($ million)
Data Table on Derivatives - Market size and forecast 2025-2030 ($ million)
Chart on Derivatives - Year-over-year growth 2025-2030 (%)
Data Table on Derivatives - Year-over-year growth 2025-2030 (%)

9.5 Bonds - Market size and forecast 2025-2030

Chart on Bonds - Market size and forecast 2025-2030 ($ million)
Data Table on Bonds - Market size and forecast 2025-2030 ($ million)
Chart on Bonds - Year-over-year growth 2025-2030 (%)
Data Table on Bonds - Year-over-year growth 2025-2030 (%)

9.6 Exchange-traded funds - Market size and forecast 2025-2030

Chart on Exchange-traded funds - Market size and forecast 2025-2030 ($ million)
Data Table on Exchange-traded funds - Market size and forecast 2025-2030 ($ million)
Chart on Exchange-traded funds - Year-over-year growth 2025-2030 (%)
Data Table on Exchange-traded funds - Year-over-year growth 2025-2030 (%)

9.7 Others - Market size and forecast 2025-2030

Chart on Others - Market size and forecast 2025-2030 ($ million)
Data Table on Others - Market size and forecast 2025-2030 ($ million)
Chart on Others - Year-over-year growth 2025-2030 (%)
Data Table on Others - Year-over-year growth 2025-2030 (%)

9.8 Market opportunity by Trade Finance Instruments

Market opportunity by Trade Finance Instruments ($ million)
Data Table on Market opportunity by Trade Finance Instruments ($ million)

10. Market Segmentation by Type

10.1 Market segments

Chart on Type - Market share 2025-2030 (%)
Data Table on Type - Market share 2025-2030 (%)

10.2 Comparison by Type

Chart on Comparison by Type
Data Table on Comparison by Type

10.3 Large-cap exchanges - Market size and forecast 2025-2030

Chart on Large-cap exchanges - Market size and forecast 2025-2030 ($ million)
Data Table on Large-cap exchanges - Market size and forecast 2025-2030 ($ million)
Chart on Large-cap exchanges - Year-over-year growth 2025-2030 (%)
Data Table on Large-cap exchanges - Year-over-year growth 2025-2030 (%)

10.4 Mid-cap exchanges - Market size and forecast 2025-2030

Chart on Mid-cap exchanges - Market size and forecast 2025-2030 ($ million)
Data Table on Mid-cap exchanges - Market size and forecast 2025-2030 ($ million)
Chart on Mid-cap exchanges - Year-over-year growth 2025-2030 (%)
Data Table on Mid-cap exchanges - Year-over-year growth 2025-2030 (%)

10.5 Small-cap exchanges - Market size and forecast 2025-2030

Chart on Small-cap exchanges - Market size and forecast 2025-2030 ($ million)
Data Table on Small-cap exchanges - Market size and forecast 2025-2030 ($ million)
Chart on Small-cap exchanges - Year-over-year growth 2025-2030 (%)
Data Table on Small-cap exchanges - Year-over-year growth 2025-2030 (%)

10.6 Market opportunity by Type

Market opportunity by Type ($ million)
Data Table on Market opportunity by Type ($ million)

11. Customer Landscape

11.1 Customer landscape overview

Analysis of price sensitivity, lifecycle, customer purchase basket, adoption rates, and purchase criteria

12. Geographic Landscape

12.1 Geographic segmentation

Chart on Market share by geography 2025-2030 (%)
Data Table on Market share by geography 2025-2030 (%)

12.2 Geographic comparison

Chart on Geographic comparison
Data Table on Geographic comparison

12.3 APAC - Market size and forecast 2025-2030

Chart on APAC - Market size and forecast 2025-2030 ($ million)
Data Table on APAC - Market size and forecast 2025-2030 ($ million)
Chart on APAC - Year-over-year growth 2025-2030 (%)
Data Table on APAC - Year-over-year growth 2025-2030 (%)
Chart on Regional Comparison - APAC
Data Table on Regional Comparison - APAC

12.3.1 China - Market size and forecast 2025-2030

Chart on China - Market size and forecast 2025-2030 ($ million)
Data Table on China - Market size and forecast 2025-2030 ($ million)
Chart on China - Year-over-year growth 2025-2030 (%)
Data Table on China - Year-over-year growth 2025-2030 (%)

12.3.2 Japan - Market size and forecast 2025-2030

Chart on Japan - Market size and forecast 2025-2030 ($ million)
Data Table on Japan - Market size and forecast 2025-2030 ($ million)
Chart on Japan - Year-over-year growth 2025-2030 (%)
Data Table on Japan - Year-over-year growth 2025-2030 (%)

12.3.3 India - Market size and forecast 2025-2030

Chart on India - Market size and forecast 2025-2030 ($ million)
Data Table on India - Market size and forecast 2025-2030 ($ million)
Chart on India - Year-over-year growth 2025-2030 (%)
Data Table on India - Year-over-year growth 2025-2030 (%)

12.3.4 Hong Kong - Market size and forecast 2025-2030

Chart on Hong Kong - Market size and forecast 2025-2030 ($ million)
Data Table on Hong Kong - Market size and forecast 2025-2030 ($ million)
Chart on Hong Kong - Year-over-year growth 2025-2030 (%)
Data Table on Hong Kong - Year-over-year growth 2025-2030 (%)

12.3.5 Australia - Market size and forecast 2025-2030

Chart on Australia - Market size and forecast 2025-2030 ($ million)
Data Table on Australia - Market size and forecast 2025-2030 ($ million)
Chart on Australia - Year-over-year growth 2025-2030 (%)
Data Table on Australia - Year-over-year growth 2025-2030 (%)

12.3.6 Indonesia - Market size and forecast 2025-2030

Chart on Indonesia - Market size and forecast 2025-2030 ($ million)
Data Table on Indonesia - Market size and forecast 2025-2030 ($ million)
Chart on Indonesia - Year-over-year growth 2025-2030 (%)
Data Table on Indonesia - Year-over-year growth 2025-2030 (%)

12.4 North America - Market size and forecast 2025-2030

Chart on North America - Market size and forecast 2025-2030 ($ million)
Data Table on North America - Market size and forecast 2025-2030 ($ million)
Chart on North America - Year-over-year growth 2025-2030 (%)
Data Table on North America - Year-over-year growth 2025-2030 (%)
Chart on Regional Comparison - North America
Data Table on Regional Comparison - North America

12.4.1 US - Market size and forecast 2025-2030

Chart on US - Market size and forecast 2025-2030 ($ million)
Data Table on US - Market size and forecast 2025-2030 ($ million)
Chart on US - Year-over-year growth 2025-2030 (%)
Data Table on US - Year-over-year growth 2025-2030 (%)

12.4.2 Canada - Market size and forecast 2025-2030

Chart on Canada - Market size and forecast 2025-2030 ($ million)
Data Table on Canada - Market size and forecast 2025-2030 ($ million)
Chart on Canada - Year-over-year growth 2025-2030 (%)
Data Table on Canada - Year-over-year growth 2025-2030 (%)

12.4.3 Mexico - Market size and forecast 2025-2030

Chart on Mexico - Market size and forecast 2025-2030 ($ million)
Data Table on Mexico - Market size and forecast 2025-2030 ($ million)
Chart on Mexico - Year-over-year growth 2025-2030 (%)
Data Table on Mexico - Year-over-year growth 2025-2030 (%)

12.5 Europe - Market size and forecast 2025-2030

Chart on Europe - Market size and forecast 2025-2030 ($ million)
Data Table on Europe - Market size and forecast 2025-2030 ($ million)
Chart on Europe - Year-over-year growth 2025-2030 (%)
Data Table on Europe - Year-over-year growth 2025-2030 (%)
Chart on Regional Comparison - Europe
Data Table on Regional Comparison - Europe

12.5.1 UK - Market size and forecast 2025-2030

Chart on UK - Market size and forecast 2025-2030 ($ million)
Data Table on UK - Market size and forecast 2025-2030 ($ million)
Chart on UK - Year-over-year growth 2025-2030 (%)
Data Table on UK - Year-over-year growth 2025-2030 (%)

12.5.2 The Netherlands - Market size and forecast 2025-2030

Chart on The Netherlands - Market size and forecast 2025-2030 ($ million)
Data Table on The Netherlands - Market size and forecast 2025-2030 ($ million)
Chart on The Netherlands - Year-over-year growth 2025-2030 (%)
Data Table on The Netherlands - Year-over-year growth 2025-2030 (%)

12.5.3 Germany - Market size and forecast 2025-2030

Chart on Germany - Market size and forecast 2025-2030 ($ million)
Data Table on Germany - Market size and forecast 2025-2030 ($ million)
Chart on Germany - Year-over-year growth 2025-2030 (%)
Data Table on Germany - Year-over-year growth 2025-2030 (%)

12.5.4 Switzerland - Market size and forecast 2025-2030

Chart on Switzerland - Market size and forecast 2025-2030 ($ million)
Data Table on Switzerland - Market size and forecast 2025-2030 ($ million)
Chart on Switzerland - Year-over-year growth 2025-2030 (%)
Data Table on Switzerland - Year-over-year growth 2025-2030 (%)

12.5.5 France - Market size and forecast 2025-2030

Chart on France - Market size and forecast 2025-2030 ($ million)
Data Table on France - Market size and forecast 2025-2030 ($ million)
Chart on France - Year-over-year growth 2025-2030 (%)
Data Table on France - Year-over-year growth 2025-2030 (%)

12.5.6 Italy - Market size and forecast 2025-2030

Chart on Italy - Market size and forecast 2025-2030 ($ million)
Data Table on Italy - Market size and forecast 2025-2030 ($ million)
Chart on Italy - Year-over-year growth 2025-2030 (%)
Data Table on Italy - Year-over-year growth 2025-2030 (%)

12.6 South America - Market size and forecast 2025-2030

Chart on South America - Market size and forecast 2025-2030 ($ million)
Data Table on South America - Market size and forecast 2025-2030 ($ million)
Chart on South America - Year-over-year growth 2025-2030 (%)
Data Table on South America - Year-over-year growth 2025-2030 (%)
Chart on Regional Comparison - South America
Data Table on Regional Comparison - South America

12.6.1 Brazil - Market size and forecast 2025-2030

Chart on Brazil - Market size and forecast 2025-2030 ($ million)
Data Table on Brazil - Market size and forecast 2025-2030 ($ million)
Chart on Brazil - Year-over-year growth 2025-2030 (%)
Data Table on Brazil - Year-over-year growth 2025-2030 (%)

12.6.2 Chile - Market size and forecast 2025-2030

Chart on Chile - Market size and forecast 2025-2030 ($ million)
Data Table on Chile - Market size and forecast 2025-2030 ($ million)
Chart on Chile - Year-over-year growth 2025-2030 (%)
Data Table on Chile - Year-over-year growth 2025-2030 (%)

12.6.3 Argentina - Market size and forecast 2025-2030

Chart on Argentina - Market size and forecast 2025-2030 ($ million)
Data Table on Argentina - Market size and forecast 2025-2030 ($ million)
Chart on Argentina - Year-over-year growth 2025-2030 (%)
Data Table on Argentina - Year-over-year growth 2025-2030 (%)

12.7 Middle East and Africa - Market size and forecast 2025-2030

Chart on Middle East and Africa - Market size and forecast 2025-2030 ($ million)
Data Table on Middle East and Africa - Market size and forecast 2025-2030 ($ million)
Chart on Middle East and Africa - Year-over-year growth 2025-2030 (%)
Data Table on Middle East and Africa - Year-over-year growth 2025-2030 (%)
Chart on Regional Comparison - Middle East and Africa
Data Table on Regional Comparison - Middle East and Africa

12.7.1 South Africa - Market size and forecast 2025-2030

Chart on South Africa - Market size and forecast 2025-2030 ($ million)
Data Table on South Africa - Market size and forecast 2025-2030 ($ million)
Chart on South Africa - Year-over-year growth 2025-2030 (%)
Data Table on South Africa - Year-over-year growth 2025-2030 (%)

12.7.2 Egypt - Market size and forecast 2025-2030

Chart on Egypt - Market size and forecast 2025-2030 ($ million)
Data Table on Egypt - Market size and forecast 2025-2030 ($ million)
Chart on Egypt - Year-over-year growth 2025-2030 (%)
Data Table on Egypt - Year-over-year growth 2025-2030 (%)

12.7.3 Nigeria - Market size and forecast 2025-2030

Chart on Nigeria - Market size and forecast 2025-2030 ($ million)
Data Table on Nigeria - Market size and forecast 2025-2030 ($ million)
Chart on Nigeria - Year-over-year growth 2025-2030 (%)
Data Table on Nigeria - Year-over-year growth 2025-2030 (%)

12.7.4 Morocco - Market size and forecast 2025-2030

Chart on Morocco - Market size and forecast 2025-2030 ($ million)
Data Table on Morocco - Market size and forecast 2025-2030 ($ million)
Chart on Morocco - Year-over-year growth 2025-2030 (%)
Data Table on Morocco - Year-over-year growth 2025-2030 (%)

12.7.5 Saudi Arabia - Market size and forecast 2025-2030

Chart on Saudi Arabia - Market size and forecast 2025-2030 ($ million)
Data Table on Saudi Arabia - Market size and forecast 2025-2030 ($ million)
Chart on Saudi Arabia - Year-over-year growth 2025-2030 (%)
Data Table on Saudi Arabia - Year-over-year growth 2025-2030 (%)

12.8 Market opportunity by geography

Market opportunity by geography ($ million)
Data Tables on Market opportunity by geography ($ million)

13. Drivers, Challenges, and Opportunity

13.1 Market drivers

Growing demand for investment opportunities
Increasing demand for ETFs
Growing globalization and cross-border investing

13.2 Market challenges

Increase in market volatility
Cybersecurity and data privacy concerns associated with trading
Geopolitical and regulatory uncertainty

13.3 Impact of drivers and challenges

Impact of drivers and challenges in 2025 and 2030

13.4 Market opportunities

Increasing focus on sustainable and environmental, social, and governance (ESG) investing
Growing popularity of online trading platforms
Rising focus on education and participation of individual investors

14. Competitive Landscape

14.1 Overview

14.2

Overview on criticality of inputs and factors of differentiation

14.3 Landscape disruption

Overview on factors of disruption

14.4 Industry risks

Impact of key risks on business

15. Competitive Analysis

15.1 Companies profiled

Companies covered

15.2 Company ranking index

15.3 Market positioning of companies

Matrix on companies position and classification

15.4 ASX Ltd.

ASX Ltd. - Overview
ASX Ltd. - Business segments
ASX Ltd. - Key offerings
ASX Ltd. - Segment focus
SWOT

15.5 BSE Ltd.

BSE Ltd. - Overview
BSE Ltd. - Business segments
BSE Ltd. - Key offerings
BSE Ltd. - Segment focus
SWOT

15.6 Deutsche Borse AG

Deutsche Borse AG - Overview
Deutsche Borse AG - Business segments
Deutsche Borse AG - Key offerings
Deutsche Borse AG - Segment focus
SWOT

15.7 Dubai Financial Market PJSC

Dubai Financial Market PJSC - Overview
Dubai Financial Market PJSC - Product / Service
Dubai Financial Market PJSC - Key offerings
SWOT

15.8 Euronext N.V.

Euronext N.V. - Overview
Euronext N.V. - Product / Service
Euronext N.V. - Key offerings
SWOT

15.9 Intercontinental Exchange Inc.

Intercontinental Exchange Inc. - Overview
Intercontinental Exchange Inc. - Business segments
Intercontinental Exchange Inc. - Key offerings
Intercontinental Exchange Inc. - Segment focus
SWOT

15.10 Japan Exchange Group Inc.

Japan Exchange Group Inc. - Overview
Japan Exchange Group Inc. - Product / Service
Japan Exchange Group Inc. - Key offerings
SWOT

15.11 JSE Ltd.

JSE Ltd. - Overview
JSE Ltd. - Business segments
JSE Ltd. - Key offerings
JSE Ltd. - Segment focus
SWOT

15.12 London Stock Exchange Group plc

London Stock Exchange Group plc - Overview
London Stock Exchange Group plc - Business segments
London Stock Exchange Group plc - Key offerings
London Stock Exchange Group plc - Segment focus
SWOT

15.13 Moscow Exchange

Moscow Exchange - Overview
Moscow Exchange - Business segments
Moscow Exchange - Key offerings
Moscow Exchange - Segment focus
SWOT

15.14 Nasdaq Inc.

Nasdaq Inc. - Overview
Nasdaq Inc. - Business segments
Nasdaq Inc. - Key offerings
Nasdaq Inc. - Segment focus
SWOT

15.15 Shanghai Stock Exchange

Shanghai Stock Exchange - Overview
Shanghai Stock Exchange - Product / Service
Shanghai Stock Exchange - Key offerings
SWOT

15.16 SIX Group Ltd.

SIX Group Ltd. - Overview
SIX Group Ltd. - Product / Service
SIX Group Ltd. - Key offerings
SWOT

15.17 Taiwan Stock Exchange Corp.

Taiwan Stock Exchange Corp. - Overview
Taiwan Stock Exchange Corp. - Product / Service
Taiwan Stock Exchange Corp. - Key offerings
SWOT

15.18 Warsaw Stock Exchange

Warsaw Stock Exchange - Overview
Warsaw Stock Exchange - Business segments
Warsaw Stock Exchange - Key offerings
Warsaw Stock Exchange - Segment focus
SWOT

16. Appendix

16.1 Scope of the report

Market definition
Objectives
Notes and caveats

16.2 Inclusions and exclusions checklist

Inclusions checklist
Exclusions checklist

16.3 Currency conversion rates for US$

16.4 Research methodology

16.5 Data procurement

Information sources

16.6 Data validation

16.7 Validation techniques employed for market sizing

16.8 Data synthesis

16.9 360 degree market analysis

16.10 List of abbreviations

Research Methodology

Technavio presents a detailed picture of the market by way of study, synthesis, and summation of data from multiple sources. The analysts have presented the various facets of the market with a particular focus on identifying the key industry influencers. The data thus presented is comprehensive, reliable, and the result of extensive research, both primary and secondary.

INFORMATION SOURCES

Primary sources

  • Manufacturers and suppliers
  • Channel partners
  • Industry experts
  • Strategic decision makers

Secondary sources

  • Industry journals and periodicals
  • Government data
  • Financial reports of key industry players
  • Historical data
  • Press releases

DATA ANALYSIS

Data Synthesis

  • Collation of data
  • Estimation of key figures
  • Analysis of derived insights

Data Validation

  • Triangulation with data models
  • Reference against proprietary databases
  • Corroboration with industry experts

REPORT WRITING

Qualitative

  • Market drivers
  • Market challenges
  • Market trends
  • Five forces analysis

Quantitative

  • Market size and forecast
  • Market segmentation
  • Geographical insights
  • Competitive landscape

Interested in this report?

Get your sample now to see our research methodology and insights!

Download Now

Frequently Asked Questions

Securities Exchanges market growth will increase by USD 65019.5 million during 2026-2030.

The Securities Exchanges market is expected to grow at a CAGR of 12.8% during 2026-2030.

Securities Exchanges market is segmented by Service (Market platforms, Capital access platforms, Others) Trade finance instruments (Equities, Derivatives, Bonds, Exchange-traded funds, Others) Type (Large-cap exchanges, Mid-cap exchanges, Small-cap exchanges)

ASX Ltd., BSE Ltd., Deutsche Borse AG, Dubai Financial Market PJSC, Euronext N.V., Intercontinental Exchange Inc., Japan Exchange Group Inc., JSE Ltd., London Stock Exchange Group plc, Moscow Exchange, Nasdaq Inc., Shanghai Stock Exchange, SIX Group Ltd., Taiwan Stock Exchange Corp., The Korea Exchange, TMX Group Ltd., Warsaw Stock Exchange are a few of the key vendors in the Securities Exchanges market.

APAC will register the highest growth rate of 39.1% among the other regions. Therefore, the Securities Exchanges market in APAC is expected to garner significant business opportunities for the vendors during the forecast period.

China, Japan, India, Hong Kong, Australia, Indonesia, US, Canada, Mexico, UK, The Netherlands, Germany, Switzerland, France, Italy, Brazil, Chile, Argentina, South Africa, Egypt, Nigeria, Morocco, Saudi Arabia

  • Growing demand for investment opportunities is the driving factor this market.

The Securities Exchanges market vendors should focus on grabbing business opportunities from the Service segment as it accounted for the largest market share in the base year.