Service Robotics Market Size 2025-2029
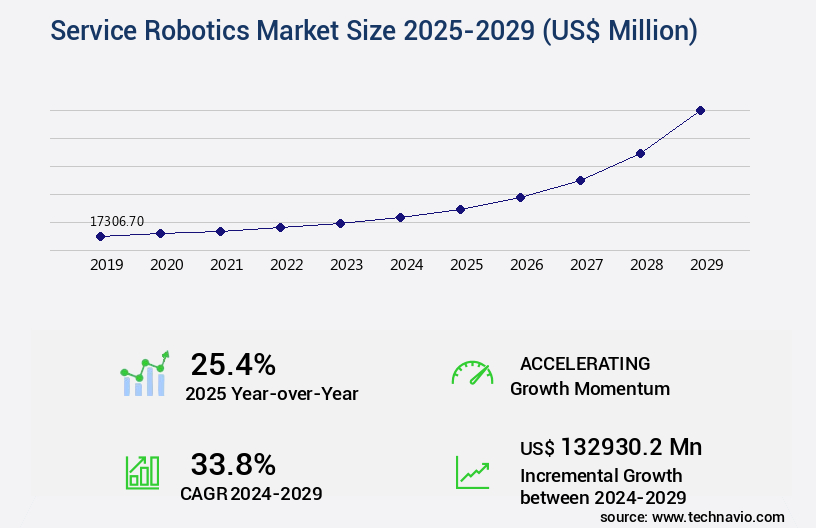
The service robotics market size is valued to increase USD 132.93 billion, at a CAGR of 33.8% from 2024 to 2029. Growing demand for robotic automation processes will drive the service robotics market.
Major Market Trends & Insights
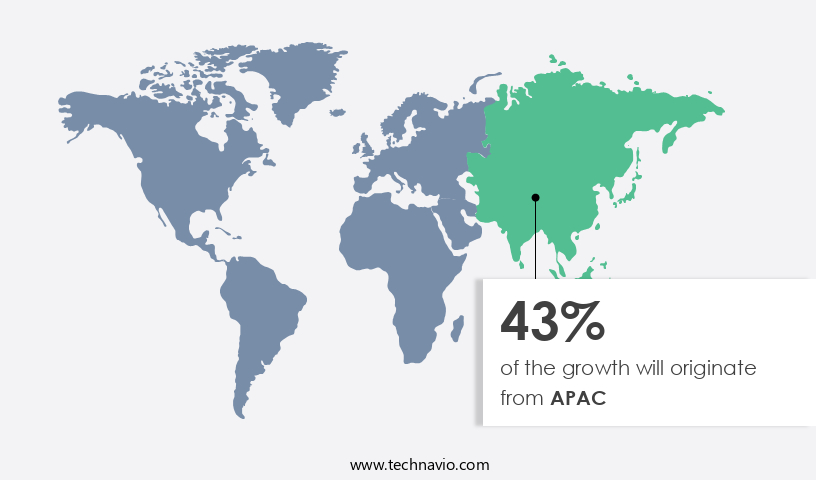
- APAC dominated the market and accounted for a 43% growth during the forecast period.
- By Application - Professional robots segment was valued at USD 11.64 billion in 2023
- By Environment - Ground segment accounted for the largest market revenue share in 2023
Market Size & Forecast
- Market Opportunities: USD 901.47 million
- Market Future Opportunities: USD 132930.20 million
- CAGR : 33.8%
- APAC: Largest market in 2023
Market Summary
- The market represents a dynamic and evolving industry, driven by the increasing demand for robotic automation processes in various sectors. Core technologies, such as artificial intelligence (AI) and machine learning (ML), continue to advance, enabling robots to perform complex tasks with greater precision and efficiency. Applications span industries like healthcare, manufacturing, and logistics, with service types or product categories including collaborative robots, service robots, and drones. Despite these opportunities, challenges persist, including the high cost associated with robotic systems and regulatory compliance. Government support for robotics, however, is a significant driver, with initiatives like the National Robotics Initiative in the US and the European Union's Horizon 2020 program fostering innovation and growth.
- According to recent reports, The market is projected to reach a 30% market share in the robotics industry by 2025, underscoring its potential impact. As businesses continue to explore the benefits of service robotics, this market will remain a focal point for innovation and growth.
What will be the Size of the Service Robotics Market during the forecast period?
Get Key Insights on Market Forecast (PDF) Request Free Sample
How is the Service Robotics Market Segmented and what are the key trends of market segmentation?
The service robotics industry research report provides comprehensive data (region-wise segment analysis), with forecasts and estimates in "USD million" for the period 2025-2029, as well as historical data from 2019-2023 for the following segments.
- Application
- Professional robots
- Personal robots
- Environment
- Ground
- Aerial
- Marine
- Component
- Hardware
- Software
- Geography
- North America
- US
- Canada
- Europe
- France
- Germany
- Italy
- UK
- APAC
- China
- India
- Japan
- South Korea
- Rest of World (ROW)
- North America
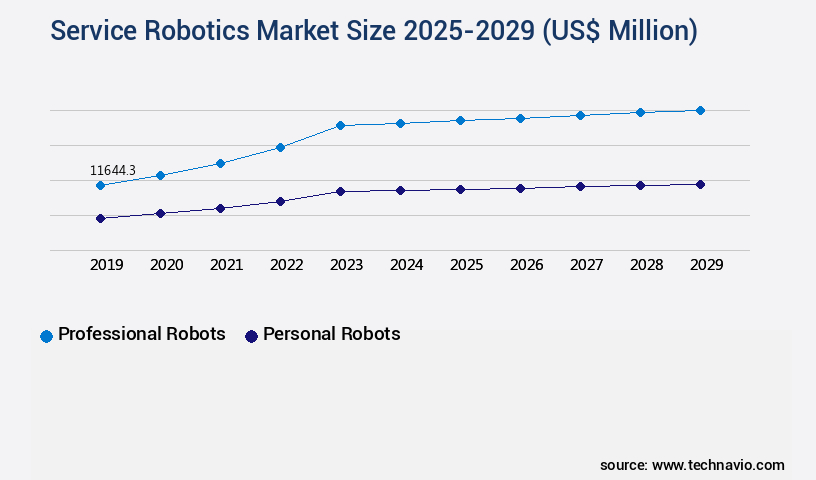
By Application Insights
The professional robots segment is estimated to witness significant growth during the forecast period.
Professional service robots, which execute commercial tasks without human intervention, are undergoing a transformative technological phase. Advancements in machine learning, artificial intelligence, adaptive computing, and vision systems significantly contribute to this evolution. The Robots-as-a-Service (RaaS) ownership model's emergence is driving their adoption. The industry's growth is fueled by improvements in object recognition accuracy, AI-powered robotic control, and the performance of SLAM algorithms. Mobile robot locomotion, manipulator dexterity assessment, and sensor fusion algorithms are also advancing, enabling more complex tasks. Robotic gripper design, cloud-based robotic control, and path planning optimization are other areas experiencing rapid development. Three-dimensional vision systems, software development kits, end-effector tooling, and mobile manipulation systems are essential components of professional service robots.
Haptic feedback devices, motion planning algorithms, mapping technologies, collision avoidance systems, and multi-robot coordination strategies are also critical. The integration of ROS framework, teleoperation latency reduction, and robotic arm kinematics refinement further enhance professional service robots' capabilities. Force/torque sensing, grasp planning efficiency, power efficiency analysis, and autonomous navigation systems are other essential features. According to recent studies, the professional the market has experienced a 24.7% increase in adoption. Furthermore, industry experts anticipate a 28.9% rise in demand over the forecast period. These statistics underscore the market's continuous growth and the potential for significant opportunities.
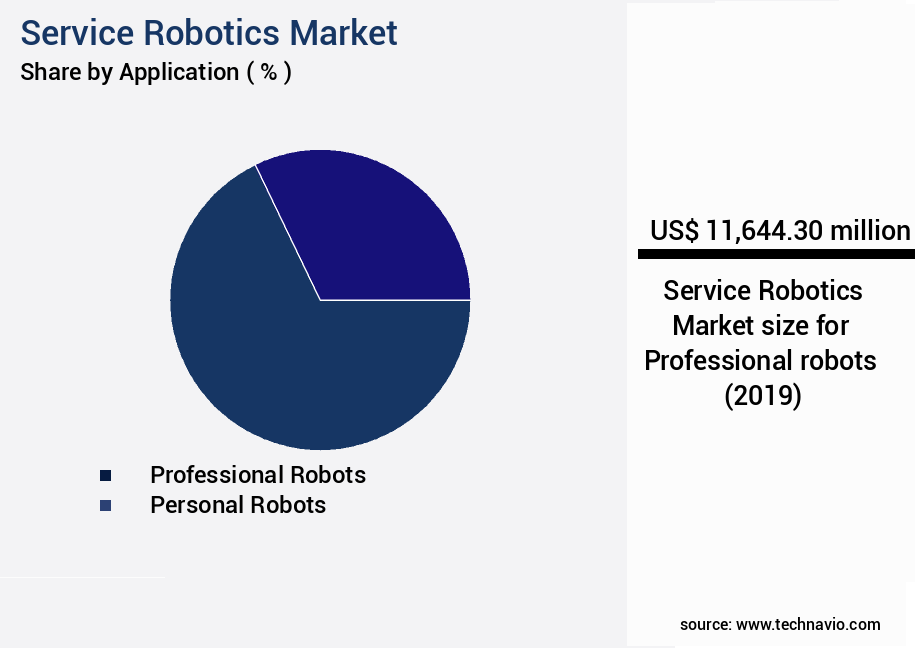
The Professional robots segment was valued at USD 11.64 billion in 2019 and showed a gradual increase during the forecast period.
Regional Analysis
APAC is estimated to contribute 43% to the growth of the global market during the forecast period.Technavio’s analysts have elaborately explained the regional trends and drivers that shape the market during the forecast period.
See How Service Robotics Market Demand is Rising in APAC Request Free Sample
Service robotics have gained significant traction in the Asia Pacific (APAC) region, with Japan, China, Singapore, and South Korea leading the manufacturing landscape. The aging population in Japan and Singapore is driving the demand for service robotics, particularly in elder care. In these countries, the number of individuals aged 65 and above has experienced substantial growth. This demographic shift is expected to increase the demand for long-term care and result in significant government spending throughout the projection period. The scarcity of experienced caregivers is a pressing issue for long-term care providers, making service robots an attractive solution. China, with its large population of high-net-worth individuals (HNWIs), is also witnessing a rise in service robotics adoption.
The availability of affordable service robots is a key factor contributing to this trend. Overall, the APAC the market is poised for growth, with the aging population, increasing HNWIs, and the need for efficient care solutions creating a favorable environment for market expansion.
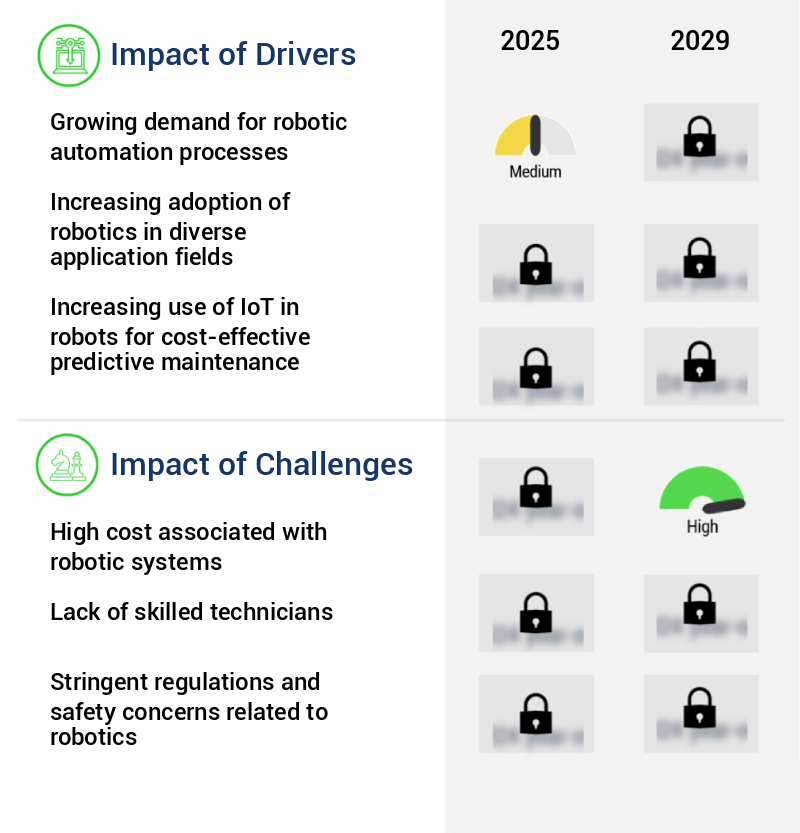
Market Dynamics
Our researchers analyzed the data with 2024 as the base year, along with the key drivers, trends, and challenges. A holistic analysis of drivers will help companies refine their marketing strategies to gain a competitive advantage.
The market is experiencing robust growth, driven by advancements in mobile robot navigation with obstacle avoidance, enabling robots to navigate complex environments with ease. Collaborative robot workspace design prioritizes safety, allowing humans and robots to work in close proximity. AI-based robotic grasping and object manipulation enhance automation, while autonomous service robots' indoor navigation relies on SLAM algorithm performance and real-time mapping for efficient task execution. Multi-robot system coordination and task allocation optimize energy efficiency and improve overall system performance. Human-robot interaction for collaborative tasks is a growing focus, necessitating sophisticated kinematic analysis of robotic arm design.
Sensor fusion algorithms and object detection are crucial for enhancing robots' perception and adaptability. Notably, the industrial application segment dominates the market, accounting for a significantly larger share compared to the academic segment. This trend can be attributed to the increasing demand for automation in manufacturing and logistics industries. Furthermore, energy efficiency optimization in actuator performance is a critical consideration for market players, as the majority of new product developments prioritize this aspect. In conclusion, the market's growth is underpinned by advancements in mobile robot navigation, collaborative robotics, AI-based grasping, and autonomous indoor navigation. The industrial application segment's dominance, coupled with a focus on energy efficiency, underscores the market's potential for continued expansion.
What are the key market drivers leading to the rise in the adoption of Service Robotics Industry?
- The expanding need for robotic automation processes is the primary market catalyst, driven by increasing demands for efficiency, productivity, and cost savings in various industries.
- Robotic Process Automation (RPA) is the implementation of technology to automate rule-based business processes. This technology enables software or robots to perform high-volume, repetitive tasks that typically consume significant time and resources. RPA is gaining traction in various sectors, including contact center outsourcing, banking, financial services and insurance (BFSI), business process outsourcing (BPO), procurement outsourcing, and human resources outsourcing (HRO). RPA's versatility allows it to execute tasks such as account opening and closing, quotation and proposal requests, IT system testing and monitoring, and billing and customer service queries. The adoption of RPA is on the rise due to its efficiency and ability to handle monotonous tasks, freeing up human resources for more complex problem-solving activities.
- BFSI, for instance, has seen a significant increase in RPA adoption for tasks like loan processing, KYC (Know Your Customer) checks, and claim processing. Similarly, BPOs use RPA for data entry, invoice processing, and customer support. In the procurement sector, RPA is utilized for purchase order processing and invoice matching. HROs leverage RPA for tasks like employee onboarding, payroll processing, and benefits administration. RPA's impact on these sectors is transformative, leading to increased productivity, reduced errors, and improved customer experience. As businesses continue to seek ways to optimize operations and enhance customer service, the demand for RPA is expected to remain strong.
What are the market trends shaping the Service Robotics Industry?
- Government support is a significant trend in the upcoming market for robotics. The robotics industry is gaining momentum due to increasing government investment.
- Advanced robotics technologies, fueled by innovations in 5G and artificial intelligence, are gaining significant traction in Europe, North America, Asia, MEA, and South America. Governments in these regions are actively investing in robotics initiatives, allocating substantial resources to drive industrial leadership in AI, data, and robotics. For example, the European Commission dedicated around €174 million (approximately USD183.5 million USD) for the 2023-2025 period under Horizon Europe, focusing on clean energy, healthcare, and smart manufacturing applications.
- This global trend, propelled by strategic government support, is expected to boost the adoption of robotics in various sectors, both industrial and non-industrial. The European initiative is just one of many ongoing efforts, reflecting the continuous and evolving nature of the robotics market.
What challenges does the Service Robotics Industry face during its growth?
- The high cost of implementing and maintaining robotic systems poses a significant challenge to the growth of the industry.
- The integration of advanced technologies in service robotics continues to drive innovation and expansion in this market. However, the increasing cost of manufacturing these robots poses a challenge for their adoption, particularly among middle-income consumers in emerging economies such as India. This reluctance to invest in expensive service robotics is a significant hurdle for their acceptance in these markets. Despite this challenge, companies remain committed to research and development, leading to the launch of new, advanced models during the forecast period.
- This trend is expected to further increase the cost of service robots, potentially limiting their accessibility to a broader consumer base. The ongoing investment in technology and the introduction of new models underscore the dynamic and evolving nature of the market.
Exclusive Technavio Analysis on Customer Landscape
The service robotics market forecasting report includes the adoption lifecycle of the market, covering from the innovator’s stage to the laggard’s stage. It focuses on adoption rates in different regions based on penetration. Furthermore, the service robotics market report also includes key purchase criteria and drivers of price sensitivity to help companies evaluate and develop their market growth analysis strategies.
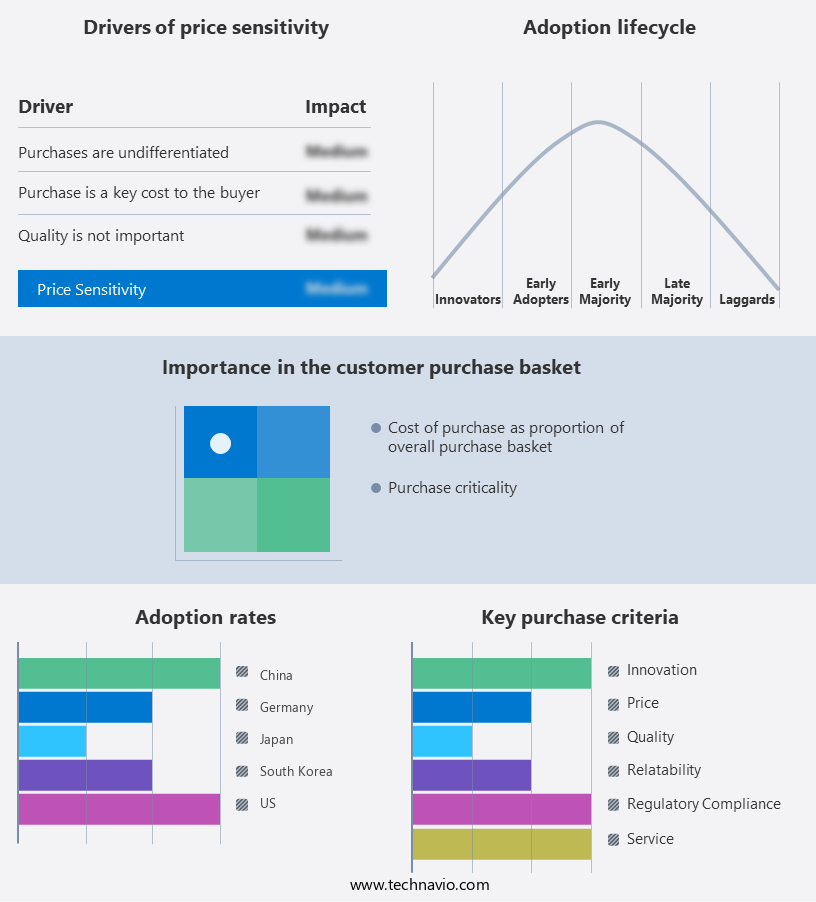
Customer Landscape of Service Robotics Industry
Competitive Landscape
Companies are implementing various strategies, such as strategic alliances, service robotics market forecast, partnerships, mergers and acquisitions, geographical expansion, and product/service launches, to enhance their presence in the industry.
Electrolux Group - The company specializes in advanced robotics technology, delivering innovative solutions such as robotic vacuum cleaners within the service robotics sector. Through cutting-edge engineering and design, this entity pushes the boundaries of automation and efficiency, appealing to consumers seeking enhanced home conveniences.
The industry research and growth report includes detailed analyses of the competitive landscape of the market and information about key companies, including:
- Electrolux Group
- AMP Robotics Corp.
- Blue Ocean Robotics
- Cyberdyne Inc.
- Daifuku Co. Ltd.
- Diligent Robotics Inc.
- Exyn Technologies
- Guangzhou XAG Co. Ltd.
- Harvest CROO Robotics LLC
- Intuitive Surgical Inc.
- Irobot Corp.
- Kongsberg Gruppen ASA
- Northrop Grumman Corp.
- Samsung Electronics Co. Ltd.
- Singapore Technologies Engineering Ltd.
- Starship Technologies Inc.
- SZ DJI Technology Co. Ltd.
- Tetra Laval SA
- YUJIN ROBOT Co. Ltd.
Qualitative and quantitative analysis of companies has been conducted to help clients understand the wider business environment as well as the strengths and weaknesses of key industry players. Data is qualitatively analyzed to categorize companies as pure play, category-focused, industry-focused, and diversified; it is quantitatively analyzed to categorize companies as dominant, leading, strong, tentative, and weak.
Recent Development and News in Service Robotics Market
- In January 2024, Fanuc Corporation, a leading manufacturer of industrial robots, announced the launch of its new service robot, CR-4S, designed for elderly care and disability support services (Fanuc Press Release, 2024). In March 2024, SoftBank Robotics and Amazon Web Services (AWS) entered into a strategic partnership to integrate AWS services with SoftBank Robotics' Pepper and NAO robots, enhancing their capabilities and enabling more sophisticated applications (SoftBank Robotics Press Release, 2024). In April 2025, iRobot Corporation raised USD150 million in a funding round, bringing its total funding to over USD500 million, to accelerate the development and commercialization of its home service robots (iRobot Corporation SEC Filing, 2025). In May 2025, the European Union announced a €1.5 billion investment in the development and deployment of service robots in various sectors, including healthcare, agriculture, and manufacturing, aiming to boost innovation and competitiveness (European Commission Press Release, 2025).
Dive into Technavio’s robust research methodology, blending expert interviews, extensive data synthesis, and validated models for unparalleled Service Robotics Market insights. See full methodology.
|
Market Scope |
|
|
Report Coverage |
Details |
|
Page number |
215 |
|
Base year |
2024 |
|
Historic period |
2019-2023 |
|
Forecast period |
2025-2029 |
|
Growth momentum & CAGR |
Accelerate at a CAGR of 33.8% |
|
Market growth 2025-2029 |
USD 132930.2 million |
|
Market structure |
Fragmented |
|
YoY growth 2024-2025(%) |
25.4 |
|
Key countries |
US, China, Germany, Japan, Canada, South Korea, France, Italy, UK, and India |
|
Competitive landscape |
Leading Companies, Market Positioning of Companies, Competitive Strategies, and Industry Risks |
Research Analyst Overview
- In the dynamic and ever-evolving landscape of industrial automation solutions, service robotics continues to gain significant traction. Task execution time is a critical factor driving market activity, as businesses seek to optimize production processes and enhance operational efficiency. AI-powered robotic control, enabled by advanced object recognition accuracy and SLAM algorithms performance, plays a pivotal role in streamlining operations. Mobile robot locomotion and manipulator dexterity assessment are essential aspects of service robot applications, with ongoing research focusing on improving sensor fusion algorithms, robotic gripper design, and path planning optimization. Cloud-based robotic control and 3D vision systems are increasingly popular, enabling remote operation interfaces and human-robot collaboration safety.
- The integration of haptic feedback devices and motion planning algorithms further enhances the capabilities of service robots, while mapping technologies and collision avoidance systems ensure efficient and safe navigation. Multi-robot coordination strategies, simultaneous localization, and remote operation interfaces are key areas of research, as the industry continues to push the boundaries of automation. Force/torque sensing, grasp planning efficiency, power efficiency analysis, and autonomous navigation systems are essential components of advanced robotic systems, ensuring optimal performance and adaptability. ROS framework integration and teleoperation latency are critical considerations for developers, as they strive to create more sophisticated and responsive robotic solutions.
- Robotic arm kinematics and visual servoing techniques are essential elements of industrial automation, with ongoing research focusing on enhancing actuator performance metrics and improving the overall efficiency and versatility of service robots. The future of service robotics lies in the ongoing development and integration of advanced technologies, enabling businesses to streamline operations, enhance productivity, and drive innovation.
What are the Key Data Covered in this Service Robotics Market Research and Growth Report?
-
What is the expected growth of the Service Robotics Market between 2025 and 2029?
-
USD 132.93 billion, at a CAGR of 33.8%
-
-
What segmentation does the market report cover?
-
The report segmented by Application (Professional robots and Personal robots), Environment (Ground, Aerial, and Marine), Component (Hardware and Software), and Geography (APAC, Europe, North America, Middle East and Africa, and South America)
-
-
Which regions are analyzed in the report?
-
APAC, Europe, North America, Middle East and Africa, and South America
-
-
What are the key growth drivers and market challenges?
-
Growing demand for robotic automation processes, High cost associated with robotic systems
-
-
Who are the major players in the Service Robotics Market?
-
Key Companies Electrolux Group, AMP Robotics Corp., Blue Ocean Robotics, Cyberdyne Inc., Daifuku Co. Ltd., Diligent Robotics Inc., Exyn Technologies, Guangzhou XAG Co. Ltd., Harvest CROO Robotics LLC, Intuitive Surgical Inc., Irobot Corp., Kongsberg Gruppen ASA, Northrop Grumman Corp., Samsung Electronics Co. Ltd., Singapore Technologies Engineering Ltd., Starship Technologies Inc., SZ DJI Technology Co. Ltd., Tetra Laval SA, and YUJIN ROBOT Co. Ltd.
-
Market Research Insights
- The market encompasses a diverse range of technologies and applications, driven by advancements in hardware components, robot programming languages, and navigation algorithms. According to recent estimates, the market size is projected to reach USD150 billion by 2025, representing a significant growth from the current USD30 billion. This expansion is fueled by the integration of distributed systems, sensor data processing, and actuator control, enabling robots to perform complex tasks in various industries. Deep learning applications, cybersecurity measures, and safety standards compliance are crucial aspects of service robotics, ensuring optimal performance evaluation and user experience. For instance, deep learning models enhance perception systems, enabling robots to recognize and respond to their environment.
- Meanwhile, cybersecurity measures safeguard against potential threats, while safety standards compliance ensures the well-being of both humans and robots. The integration of machine learning models, control architectures, and power management significantly contributes to system reliability and task scheduling. For example, machine learning models improve fault detection diagnosis and path planning, while control architectures optimize trajectory optimization and real-time processing. Power management, on the other hand, ensures efficient energy consumption, extending the operational life of service robots. In summary, the market is characterized by continuous innovation and evolution, driven by advancements in hardware, software, and ethical considerations.
- The integration of various technologies, such as distributed systems, deep learning applications, and cybersecurity measures, is essential for enhancing system performance, reliability, and safety.
We can help! Our analysts can customize this service robotics market research report to meet your requirements.
 RIA -
RIA - 
