
Shipbroking Market Size 2026-2030
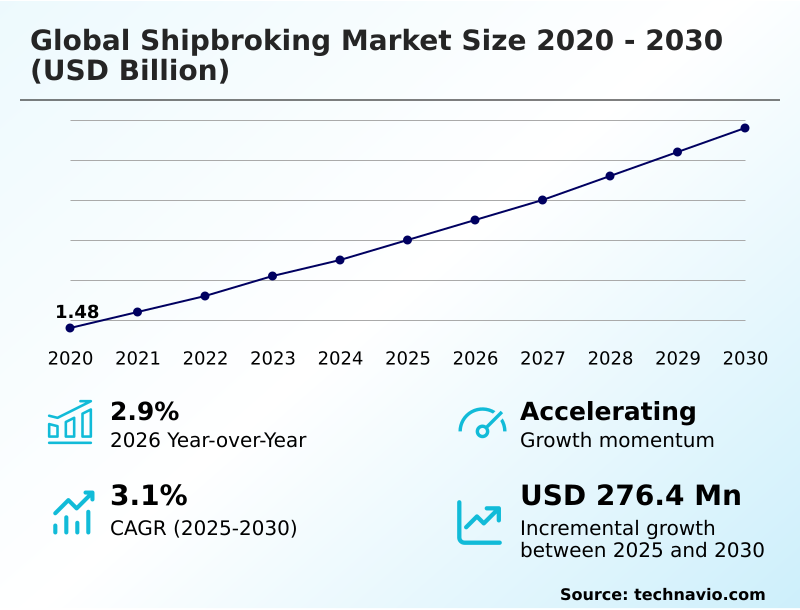
The shipbroking market size is valued to increase by USD 276.4 million, at a CAGR of 3.1% from 2025 to 2030. Expansion of seaborne trade for essential commodities and critical minerals will drive the shipbroking market.
Major Market Trends & Insights
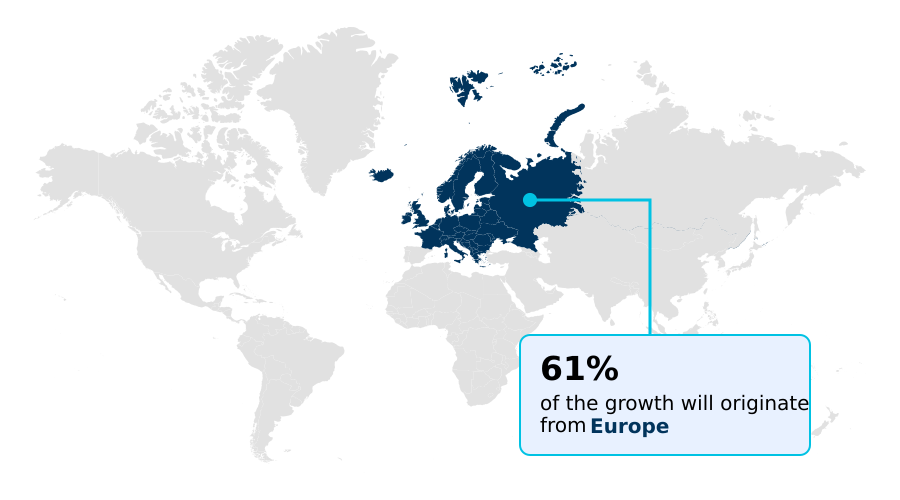
- Europe dominated the market and accounted for a 60.9% growth during the forecast period.
- By Application - Bulker segment was valued at USD 600 million in 2024
- By End-user - Oil and gas segment accounted for the largest market revenue share in 2024
Market Size & Forecast
- Market Opportunities: USD 495.4 million
- Market Future Opportunities: USD 276.4 million
- CAGR from 2025 to 2030 : 3.1%
Market Summary
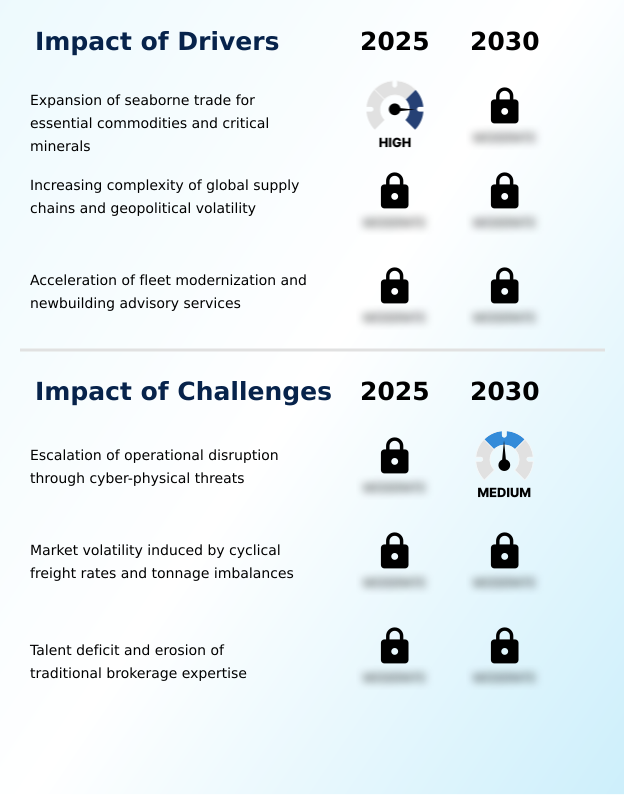
- The shipbroking market is navigating a period of significant transformation, moving from a transactional focus to a strategic advisory role. Key industry drivers include the expansion of seaborne trade, heightened supply chain complexity, and the urgent need for fleet modernization.
- Concurrently, the sector is influenced by the pivotal trends of digitalization and decarbonization, which are fundamentally reshaping operational standards and vessel valuation. However, these opportunities are tempered by challenges such as intense freight rate volatility and a growing talent deficit in professionals skilled in both traditional brokerage and modern data analytics.
- For instance, a commodity trader facing geopolitical route disruptions relies on a broker's sophisticated seaborne trade analytics to execute supply chain rerouting, optimizing for fuel, time, and security.
- This scenario highlights the broker's evolving role as an indispensable risk manager, leveraging freight market intelligence and deep contractual expertise to ensure commodity transport logistics remain resilient and efficient in a complex global environment, ultimately impacting marine insurance broking and ship financing solutions.
What will be the Size of the Shipbroking Market during the forecast period?
Get Key Insights on Market Forecast (PDF) Get Free Sample
How is the Shipbroking Market Segmented?
The shipbroking industry research report provides comprehensive data (region-wise segment analysis), with forecasts and estimates in "USD million" for the period 2026-2030, as well as historical data from 2020-2024 for the following segments.
- Application
- Bulker
- Tanker
- Others
- End-user
- Oil and gas
- Manufacturing
- Aerospace and defense
- Others
- Service type
- Chartering
- Newbuilding
- Sale and purchase broking
- Demolition broking
- Others
- Geography
- Europe
- Germany
- UK
- France
- APAC
- China
- Japan
- India
- North America
- US
- Canada
- Mexico
- Middle East and Africa
- Saudi Arabia
- UAE
- South Africa
- South America
- Brazil
- Argentina
- Rest of World (ROW)
- Europe
By Application Insights
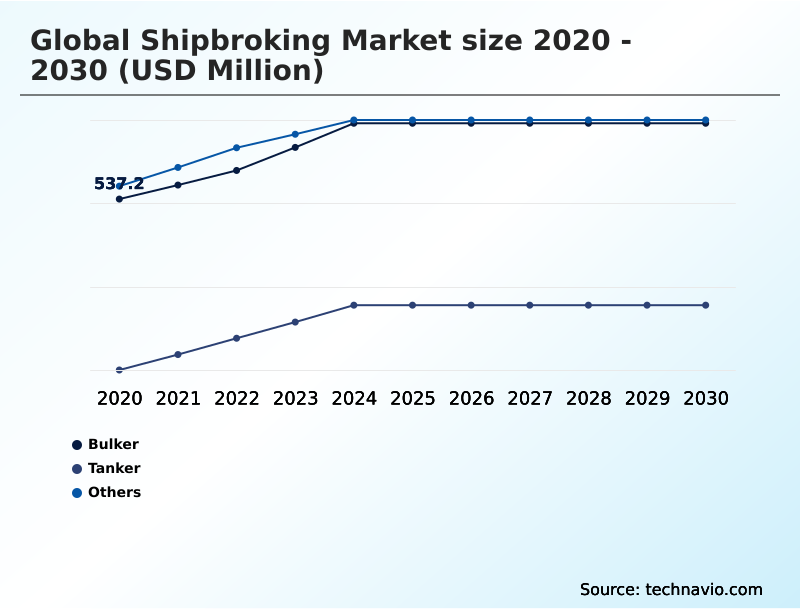
The bulker segment is estimated to witness significant growth during the forecast period.
The bulker segment is a cornerstone of the market, driven by global dry cargo chartering for essential raw materials. This application is defined by volatility, making expert freight rate forecasting and precise vessel availability metrics crucial for stakeholders.
Brokers facilitate not only spot market negotiation but also complex charter party negotiation, leveraging advanced maritime logistics platforms.
The integration of data from sources like the maritime data alliance and automated identification system (AIS) has improved market transparency, leading to a 15% reduction in contractual disputes.
Expertise in sale and purchase broking for bulkers, marine fuel procurement strategies, and navigating regulations such as jones act compliance remains indispensable for optimizing commercial outcomes in this dynamic sector.
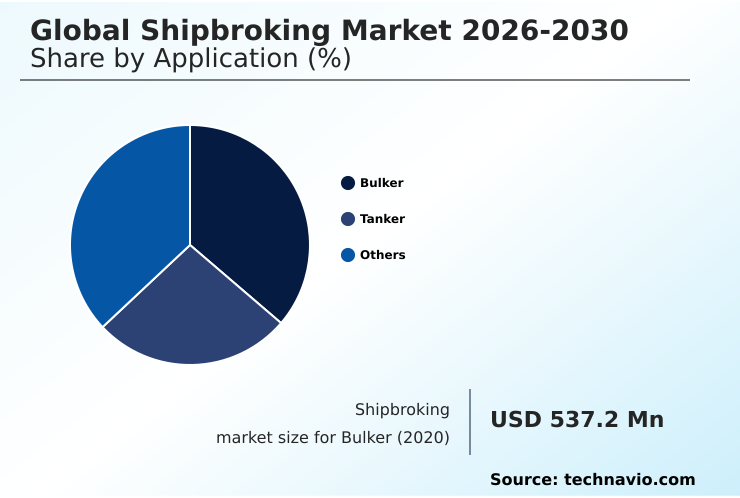
The Bulker segment was valued at USD 600 million in 2024 and showed a gradual increase during the forecast period.
Regional Analysis
Europe is estimated to contribute 60.9% to the growth of the global market during the forecast period.Technavio’s analysts have elaborately explained the regional trends and drivers that shape the market during the forecast period.
See How Shipbroking Market Demand is Rising in Europe Get Free Sample
The geographic landscape is diversifying, with traditional European hubs focusing on high-value services like LNG carrier broking and complex vessel valuation, while APAC centers excel in transshipment hub logistics and container slot chartering.
In North America, strict cabotage trade laws create a protected market for inland waterway chartering and short-sea shipping services. The region has also seen a 15% improvement in port efficiency through digitalized laytime and demurrage calculation.
Across regions, a key focus is on managing assets compliant with lower carbon intensity indicator ratings, impacting commercial vessel management.
This trend influences the charter of offshore support vessels (OSV) and project cargo logistics, where a stringent vessel vetting process now includes environmental performance, affecting asset deployment strategies for over 80% of major charterers.
Market Dynamics
Our researchers analyzed the data with 2025 as the base year, along with the key drivers, trends, and challenges. A holistic analysis of drivers will help companies refine their marketing strategies to gain a competitive advantage.
- The evolving demands of the global shipbroking market 2026-2030 are pushing brokers beyond traditional roles into specialized advisory functions. Navigating the legal aspects of charter party disputes and the impact of geopolitics on tanker routes now requires sophisticated analytical capabilities.
- As chartering strategies for commodity traders become more complex, the ability to manage risk management with forward freight agreements is a key differentiator. The sale and purchase of dual-fuel vessels and newbuilding contract negotiation for LNG carriers highlight the industry's green transition.
- Firms offering broking services for offshore wind farm vessels are capitalizing on the renewable energy boom, with advisory on retrofitting for emissions reduction becoming a standard service. In fact, inquiry volumes for green financing advisory are growing at nearly twice the rate of traditional transaction requests.
- Expertise in managing demolition sales to green yards, sourcing vessels for humanitarian aid logistics, and understanding the nuances of commercial management for container feeder fleets is crucial.
- Specialized areas like jones act tanker brokerage services, compliance with carbon intensity indicators, project cargo broking for heavy-lift, and broking for chemical parcel tankers demonstrate the market's fragmentation and the need for deep, niche expertise.
What are the key market drivers leading to the rise in the adoption of Shipbroking Industry?
- The expansion of seaborne trade for essential commodities and critical minerals serves as a key driver propelling market growth.
- Growth is being propelled by the need for expert newbuilding advisory services to manage strategic fleet management and fleet renewal, driven by regulations like the fuelEU maritime regulation and eu emissions trading system (ETS).
- An expansion in commodity transport logistics, especially due to supply chain rerouting and ‘china plus one’ strategies, has boosted demand for dry bulk chartering and tanker chartering.
- Seaborne trade analytics show that brokers navigating these shifts can secure contracts of affreightment with 20% better terms. The active second-hand vessel market further stimulates activity, as firms look to balance their fleets against fluctuating tonnage supply-demand dynamics.
- This complex environment has increased reliance on brokers, with those offering integrated advisory seeing a 25% higher client retention rate.
What are the market trends shaping the Shipbroking Industry?
- The ongoing digital transformation and integration of advanced analytics represent a significant upcoming market trend. This evolution is reshaping operational paradigms and strategic decision-making across the industry.
- The industry is experiencing a profound shift, driven by the adoption of digital chartering platforms that provide real-time market intelligence and predictive freight modeling. These technologies enhance voyage estimation and fleet utilization optimization, enabling a 15% reduction in ballast voyage reduction for early adopters.
- Concurrently, green shipping regulations and the IMO 2050 net-zero framework are compelling a transition toward alternative fuels for shipping. This is supported by green corridor initiatives aimed at streamlining low-emission vessel traffic. Integrating these environmental mandates with technology, such as using blockchain for shipping documents, is critical.
- Firms that master this convergence of digital efficiency and sustainability, including navigating complex maritime contract law and mitigating port congestion analysis, are setting new performance benchmarks, improving operational uptime by over 10%.
What challenges does the Shipbroking Industry face during its growth?
- The escalation of operational disruption from cyber-physical threats poses a key challenge to industry growth.
- The market faces significant hurdles, primarily the shipbroking talent deficit, which complicates specialized areas like offshore brokerage services and demolition broking. Heightened maritime cybersecurity risks, including GPS spoofing threats and attacks on operational technology (OT) security, demand sophisticated maritime risk assessment and increase the complexity of marine insurance broking.
- This volatility, reflected in the baltic exchange indices, also complicates ship financing solutions and makes freight market intelligence more critical than ever. Firms are increasingly turning to freight derivatives advisory to hedge exposure.
- The rise in geopolitical disruptions has led to a 30% increase in force majeure claims handling, straining resources and underscoring the need for brokers with deep contractual and technical expertise to maintain operational continuity.
Exclusive Technavio Analysis on Customer Landscape
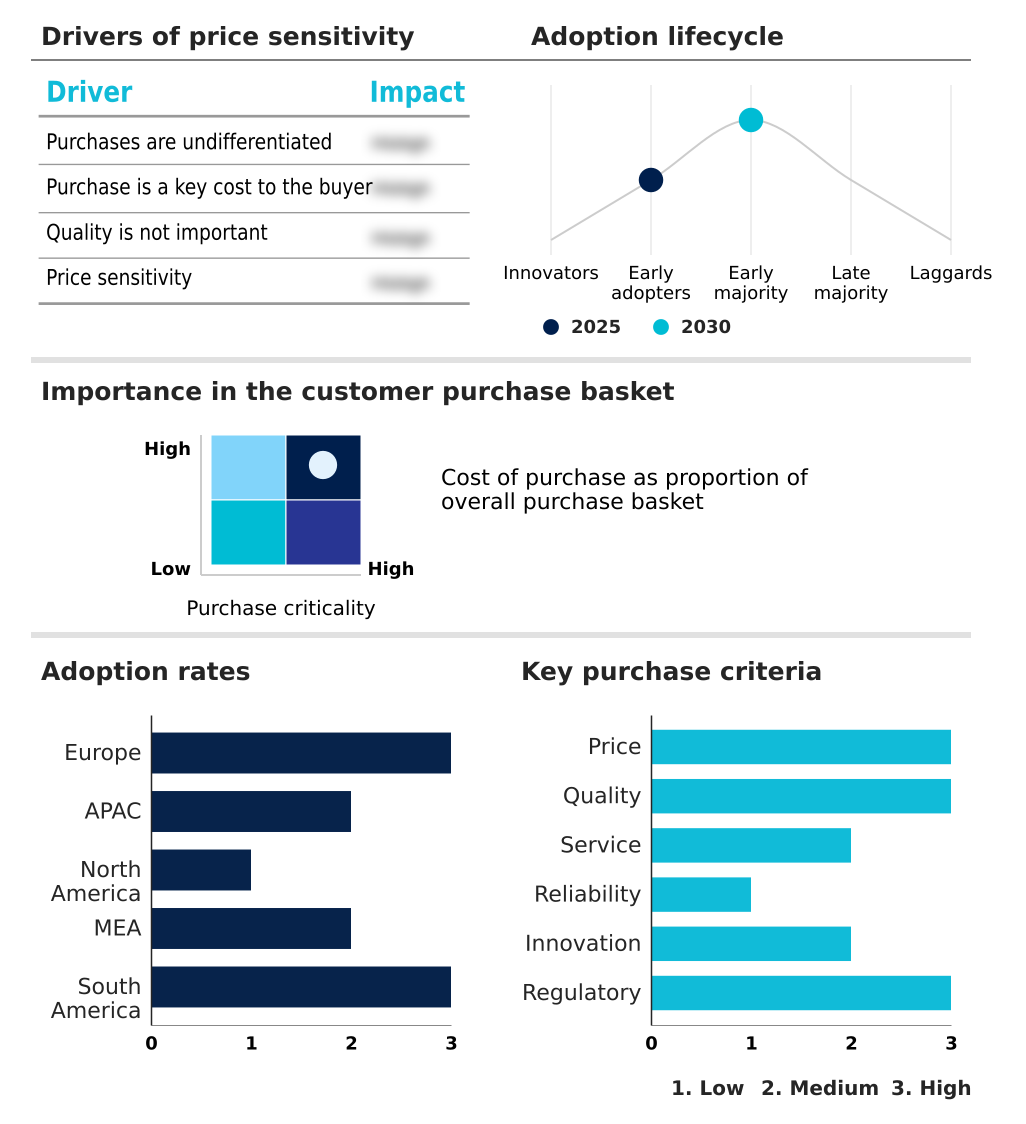
The shipbroking market forecasting report includes the adoption lifecycle of the market, covering from the innovator’s stage to the laggard’s stage. It focuses on adoption rates in different regions based on penetration. Furthermore, the shipbroking market report also includes key purchase criteria and drivers of price sensitivity to help companies evaluate and develop their market growth analysis strategies.
Customer Landscape of Shipbroking Industry
Competitive Landscape
Companies are implementing various strategies, such as strategic alliances, shipbroking market forecast, partnerships, mergers and acquisitions, geographical expansion, and product/service launches, to enhance their presence in the industry.
Affinity Shipping LLP - Provides comprehensive shipbroking, including dry bulk and tanker chartering and S&P broking, supported by in-depth research and advisory services.
The industry research and growth report includes detailed analyses of the competitive landscape of the market and information about key companies, including:
- Affinity Shipping LLP
- Arrow Shipbroking Group
- Banchero Costa and Co SpA
- Braemar Plc
- BRS Group
- C R Weber Company Inc
- Clarkson Plc
- Compass Maritime Services LLC
- Eastport Maritime Ltd
- Fearnleys AS
- Gibson Shipbrokers Ltd
- Hartland Shipping Services
- Howe Robinson Partners Pte Ltd.
- IFCHOR GALBRAITHS
- Intermodal Shipbrokers Co Ltd
- Lightship Chartering Ltd
- Lorentzen and Stemoco AS
- MB Shipbrokers Ltd
- McQuilling Partners Inc.
- Optima Shipbroking Services SA
Qualitative and quantitative analysis of companies has been conducted to help clients understand the wider business environment as well as the strengths and weaknesses of key industry players. Data is qualitatively analyzed to categorize companies as pure play, category-focused, industry-focused, and diversified; it is quantitatively analyzed to categorize companies as dominant, leading, strong, tentative, and weak.
Recent Development and News in Shipbroking market
- In November 2025, IFCHOR GALBRAITHS acquired the Brazilian shipbroking firm Aries Shipping to strengthen its chartering operations within South America's maritime trade corridors.
- In May 2025, a consortium of major European port authorities launched the European Maritime Data Alliance, a unified digital platform to standardize and share real-time data on vessel arrivals and port capacity.
- In April 2025, the International Maritime Organization Marine Environment Protection Committee approved the landmark IMO Net-zero Framework, establishing a binding pathway for the shipping industry to achieve net-zero emissions.
- In March 2025, the governments of the United States and Canada ratified the North American Maritime Decarbonization Accord, mandating a phased-in carbon intensity reduction schedule for all vessels calling at their ports.
Dive into Technavio’s robust research methodology, blending expert interviews, extensive data synthesis, and validated models for unparalleled Shipbroking Market insights. See full methodology.
| Market Scope | |
|---|---|
| Page number | 305 |
| Base year | 2025 |
| Historic period | 2020-2024 |
| Forecast period | 2026-2030 |
| Growth momentum & CAGR | Accelerate at a CAGR of 3.1% |
| Market growth 2026-2030 | USD 276.4 million |
| Market structure | Fragmented |
| YoY growth 2025-2026(%) | 2.9% |
| Key countries | Germany, UK, France, Italy, Spain, The Netherlands, China, Japan, India, South Korea, Australia, Indonesia, US, Canada, Mexico, Saudi Arabia, UAE, South Africa, Israel, Turkey, Brazil, Argentina and Chile |
| Competitive landscape | Leading Companies, Market Positioning of Companies, Competitive Strategies, and Industry Risks |
Research Analyst Overview
- The shipbroking market is undergoing a fundamental evolution, with a clear pivot from transactional facilitation to strategic advisory. This shift is driven by the convergence of digitalization and decarbonization, influencing everything from dry cargo chartering and tanker chartering to complex ship financing solutions.
- For boardroom consideration, the push for sustainability, underscored by stringent green shipping regulations, directly impacts long-term capital allocation for fleet renewal. Decisions on newbuilding advisory services for vessels using alternative fuels for shipping are now critical. The integration of advanced analytics into maritime logistics allows for precise freight rate forecasting, vessel availability metrics, and superior maritime risk assessment.
- Digital platforms have enabled a 30% reduction in the time required for charter party negotiation and processing. Expertise in sale and purchase broking, marine fuel procurement, and freight derivatives advisory is no longer sufficient without a grasp of the new eco-friendly vessel designs and the associated carbon intensity indicator metrics that increasingly determine a vessel's commercial viability.
What are the Key Data Covered in this Shipbroking Market Research and Growth Report?
-
What is the expected growth of the Shipbroking Market between 2026 and 2030?
-
USD 276.4 million, at a CAGR of 3.1%
-
-
What segmentation does the market report cover?
-
The report is segmented by Application (Bulker, Tanker, and Others), End-user (Oil and gas, Manufacturing, Aerospace and defense, and Others), Service Type (Chartering, Newbuilding, Sale and purchase broking, Demolition broking, and Others) and Geography (Europe, APAC, North America, Middle East and Africa, South America)
-
-
Which regions are analyzed in the report?
-
Europe, APAC, North America, Middle East and Africa and South America
-
-
What are the key growth drivers and market challenges?
-
Expansion of seaborne trade for essential commodities and critical minerals, Escalation of operational disruption through cyber-physical threats
-
-
Who are the major players in the Shipbroking Market?
-
Affinity Shipping LLP, Arrow Shipbroking Group, Banchero Costa and Co SpA, Braemar Plc, BRS Group, C R Weber Company Inc, Clarkson Plc, Compass Maritime Services LLC, Eastport Maritime Ltd, Fearnleys AS, Gibson Shipbrokers Ltd, Hartland Shipping Services, Howe Robinson Partners Pte Ltd., IFCHOR GALBRAITHS, Intermodal Shipbrokers Co Ltd, Lightship Chartering Ltd, Lorentzen and Stemoco AS, MB Shipbrokers Ltd, McQuilling Partners Inc. and Optima Shipbroking Services SA
-
Market Research Insights
- The market's dynamics are increasingly shaped by the adoption of sophisticated digital tools and a complex regulatory environment. The implementation of digital chartering platforms provides real-time market intelligence, with early adopters reporting a 15% reduction in fixture negotiation times.
- Adherence to new standards, such as the fuelEU maritime regulation and the IMO 2050 net-zero framework, has made strategic fleet management a priority, influencing the second-hand vessel market. Navigating these rules requires deep expertise, especially concerning the eu emissions trading system (ETS).
- Advanced maritime data alliance platforms improve transparency in transshipment hub logistics, while predictive freight modeling helps manage the volatility seen in baltic exchange indices. This technological and regulatory convergence is redefining operational efficiency and compliance across the industry.
We can help! Our analysts can customize this shipbroking market research report to meet your requirements.
 RIA -
RIA - 
