Smart City Platform Market Analysis, Size, and Forecast 2024-2028: North America (US), Europe (Germany, Spain, and UK), APAC (Japan), and Rest of World (ROW)

Smart City Platform Market Analysis, Size, and Forecast 2024-2028:
North America (US), Europe (Germany, Spain, and UK), APAC (Japan), and Rest of World (ROW)

Published: Oct 2024 148 Pages SKU: IRTNTR71701

Market Overview at a Glance

$59.1 B
Market Opportunity
23.1%
CAGR
18.5
YoY growth 2023-2024(%)

Smart City Platform Market Size 2024-2028

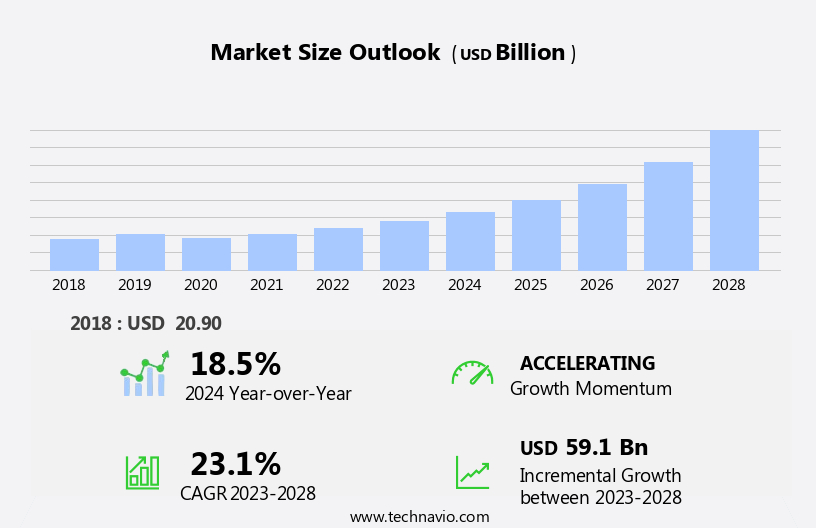
The smart city platform market size is forecast to increase by USD 59.1 billion at a CAGR of 23.1% between 2023 and 2028.

  • The market is experiencing significant growth due to the increasing demand for building automation and government initiatives aimed at developing smart cities. The need for efficient and connected urban infrastructure is driving market expansion. Security systems, powered by artificial intelligence (AI) and machine learning, are crucial for ensuring public safety and managing traffic flow. However, the market faces challenges in the form of high switching and installation costs, which may hinder the adoption of smart city platforms. These costs can be attributed to the complex nature of integrating various technologies and systems, as well as the need for specialized expertise.
  • Despite this obstacle, companies can capitalize on the market's potential by focusing on cost-effective solutions and collaborating with industry partners to streamline implementation processes. By addressing these challenges, market players can effectively navigate the competitive landscape and capitalize on the opportunities presented by the growing demand for smart city technologies.

What will be the Size of the Smart City Platform Market during the forecast period?

Smart City Platform Market Size

 Request Free Sample

  • The market continues to evolve, driven by the integration of advanced technologies such as autonomous vehicles, smart city consortia, smart energy solutions, city planning, smart homes, Smart Lighting, real-time data, smart education, public transportation, predictive analytics, government services, open source, and artificial intelligence. renewable energy sources, traffic management, smart parking, smart metering, and smart waste management are also key components of this dynamic market. Smart city initiatives encompass city operations, smart infrastructure, smart mobility, citizen services, smart water, smart grid, electric vehicles, data analytics, smart buildings, edge computing, citizen engagement, data visualization, urban renewal, environmental monitoring, cloud computing, and smart retail.
  • These technologies are transforming urban areas, improving energy efficiency, enhancing public safety, and promoting digital transformation. Open data, public-private partnerships, big data, green technology, urban planning, and urban development are essential elements of the smart city landscape. machine learning and predictive analytics enable traffic management, energy consumption optimization, and predictive maintenance of city infrastructure. Smart city awards recognize outstanding achievements in this field, fostering innovation and competition. Data privacy and security are critical concerns in the smart city context, ensuring the protection of citizens' personal information. Smart city indexes provide valuable insights into the progress and performance of various cities in implementing smart city initiatives. The ongoing unfolding of market activities and evolving patterns underscore the continuous dynamism of the market.

How is this Smart City Platform Industry segmented?

The smart city platform industry research report provides comprehensive data (region-wise segment analysis), with forecasts and estimates in "USD billion" for the period 2024-2028, as well as historical data from 2018-2022 for the following segments.

  • Application
    • Smart infrastructure
    • Smart building
    • Smart utilities
    • Others
  • Offering
    • Connectivity management platforms
    • Integration platforms
    • Device management platforms
    • Data management platforms
    • Security platforms
  • Services
    • Professional services
    • Managed services
  • Component
    • Software Platforms
    • Hardware Solutions
    • Services
  • End-User
    • Government
    • Commercial Enterprises
    • Residential Communities
  • Geography
    • North America
      • US
      • Canada
    • South America
      • Brazil
      • Argentina
    • Middle East and Africa
      • UAE
    • Europe
      • Germany
      • Spain
      • UK
    • APAC
      • Japan
      • Australia
      • India
    • Rest of World (ROW)

By Application Insights

The smart infrastructure segment is estimated to witness significant growth during the forecast period.

Smart infrastructures, encompassing energy, public transport, and public safety sectors, represent a harmonious blend of physical and digital systems. These infrastructures collect data through sensors, analyze it using artificial intelligence and machine learning, and provide real-time feedback for adaptability. The adoption of smart infrastructures is driven by the increasing industrial development, commercialization, and growing awareness of energy efficiency and building optimization. Smart cities, fueled by open data and public-private partnerships, are integrating these systems to create a more efficient and sustainable urban environment. Smart energy solutions, such as renewable energy and energy efficiency, play a crucial role in this transformation.

Smart grids and electric vehicles facilitate the integration of renewable energy sources into the power grid, while energy efficiency initiatives reduce overall consumption. Smart homes and buildings employ edge computing and data analytics to optimize energy usage and enhance occupant comfort. City planning and urban development are also benefiting from the integration of smart technologies. Predictive analytics and real-time data enable traffic management, Smart parking, and waste management, improving mobility and reducing congestion. Smart water systems ensure efficient water usage and monitoring, while smart retail and healthcare facilities leverage data visualization and citizen engagement to enhance services. Government services, including public transportation and citizen services, are being transformed through digital transformation and open data initiatives.

Smart city consortiums and initiatives are collaborating to create harmonious, immersive urban environments that prioritize energy efficiency, data privacy, and public safety. The future of smart cities lies in the seamless integration of these various systems and the continuous optimization of city operations and infrastructure.

Smart City Platform Market Size

Request Free Sample

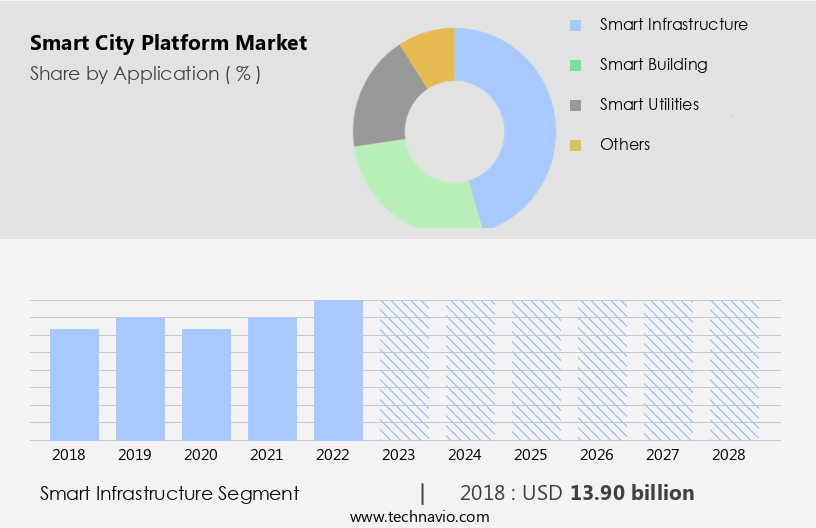
The Smart infrastructure segment was valued at USD 13.90 billion in 2018 and showed a gradual increase during the forecast period.

Regional Analysis

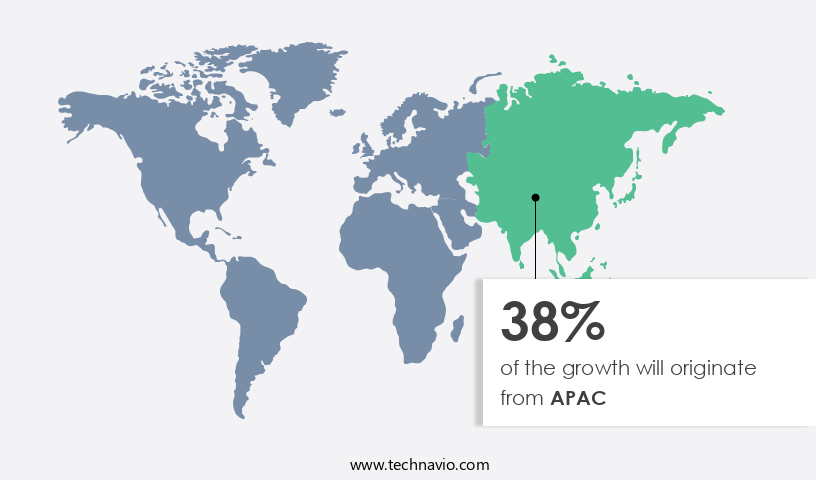
APAC is estimated to contribute 38% to the growth of the global market during the forecast period.Technavio's analysts have elaborately explained the regional trends and drivers that shape the market during the forecast period.

Smart City Platform Market Share by Geography

 Request Free Sample

In the US and Canada, the market is experiencing significant growth due to increasing industrial and commercial expansion. Strict government regulations on energy conservation and the presence of numerous global companies are key drivers propelling the market forward. Major players in North America offering smart city solutions include Cisco and Microsoft, among others. With a large number of companies based in the US, competition is intensifying, leading to innovation. The US holds the largest market share, accounting for the majority of the market in the region. Smart city consortiums are collaborating to integrate various technologies such as artificial intelligence, machine learning, and predictive analytics into city planning.

Smart energy solutions are being implemented to optimize energy usage and promote renewable energy sources. Smart homes, buildings, and infrastructure are being developed to enhance citizen engagement and improve city operations. Real-time data analytics is enabling traffic management, public transportation, and smart parking systems. City services are being digitally transformed with smart water, waste management, and government services. Open data and public-private partnerships are fostering innovation in smart retail, healthcare, and education. Urban renewal projects are integrating smart technology for environmental monitoring and energy efficiency. cloud computing and edge computing are essential for managing and analyzing big data.

Smart mobility solutions, including electric vehicles and autonomous vehicles, are gaining popularity. Smart grid and smart lighting systems are being adopted to optimize energy consumption. Data privacy and public safety are crucial considerations in the digital transformation of cities. The smart city index is a measure of a city's progress towards becoming a smart city. In conclusion, the market in North America is witnessing a surge in activity, with various entities collaborating to create harmonious, efficient, and sustainable urban environments. Smart city initiatives are focusing on energy efficiency, digital transformation, and citizen services, with a strong emphasis on open data and green technology.

Market Dynamics

Our researchers analyzed the data with 2023 as the base year, along with the key drivers, trends, and challenges. A holistic analysis of drivers will help companies refine their marketing strategies to gain a competitive advantage.

What are the key market drivers leading to the rise in the adoption of Smart City Platform Industry?

  • The increasing demand for building automation serves as the primary market catalyst. Building Automation Software plays a crucial role in managing and optimizing the functioning of industrial, residential, and commercial buildings. This software acts as a control system to automate, regulate, and manage various subsystems in a building, ensuring adherence to predefined parameters. By integrating all components of a heating, ventilation, and air conditioning (HVAC) system into building management systems, organizations can achieve significant energy savings. Additionally, smart city initiatives, such as data analytics, citizen engagement, and environmental monitoring, are driving the adoption of building automation software. Edge computing and cloud computing technologies enable real-time data processing and analysis, leading to improved operational efficiency and enhanced user experiences.
  • The integration of data visualization tools allows for better understanding and interpretation of complex data, facilitating informed decision-making. Furthermore, open data initiatives and smart retail, healthcare, urban renewal, and transportation systems are expanding the scope of building automation software applications. Overall, the market for building automation software is expected to grow as businesses continue to prioritize cost savings, energy efficiency, and advanced technologies to enhance their operations.

What are the market trends shaping the Smart City Platform Industry?

  • Smart cities, driven by government initiatives, represent the current market trend. This emerging sector focuses on integrating technology into urban infrastructure and services to enhance efficiency and quality of life.
  • Smart cities, fueled by public-private partnerships, are transforming urban areas into digitally connected and sustainable environments. Big data and green technology are at the core of these initiatives, enabling urban planning and development that prioritize energy efficiency and resource conservation. Governments worldwide are investing heavily in these projects to address the challenges of accommodating growth and ensuring sustainability. In this digital transformation, smart city plans focus on improving energy efficiency, waste management, and public safety. Big data analysis plays a crucial role in optimizing city services and infrastructure, enhancing the quality of life for residents. Data privacy and security are also essential considerations in these initiatives.
  • Gulf and Asian countries are leading the way in smart city development, with a focus on expanding their economies and enhancing their tourism sectors. These countries' plans for smart cities prioritize energy optimization and sustainable urban development, making them attractive for businesses and investors. Through these initiatives, governments aim to provide more efficient services and greater satisfaction to their citizens, ensuring a more livable and sustainable urban environment. Smart city awards recognize and celebrate these achievements, further encouraging innovation and progress in this field.

What challenges does the Smart City Platform Industry face during its growth?

  • The high switching costs and installation expenses represent significant challenges that hinder industry growth. These expenses, which include the time and resources required to transition from one solution or supplier to another, can deter businesses from adopting new technologies or services. Consequently, reducing these costs and streamlining the switching process could potentially accelerate industry expansion. 
  • The market encompasses various applications, including smart homes, public transportation, city planning, and energy management. companies are integrating advanced features such as predictive analytics, artificial intelligence, and real-time data to enhance the functionality of these systems. In the realm of energy management, smart grids and smart energy solutions enable efficient energy usage and demand response. However, the high initial investment required for implementing these systems, including the cost of autonomous vehicles, smart lighting, and government services, presents a significant barrier to adoption.
  • The Smart City Consortium, an open-source collaborative platform, aims to address this challenge by promoting the sharing of best practices and resources among its members. The integration of smart education and open-source technology further enhances the potential of these systems to improve city infrastructure and services.

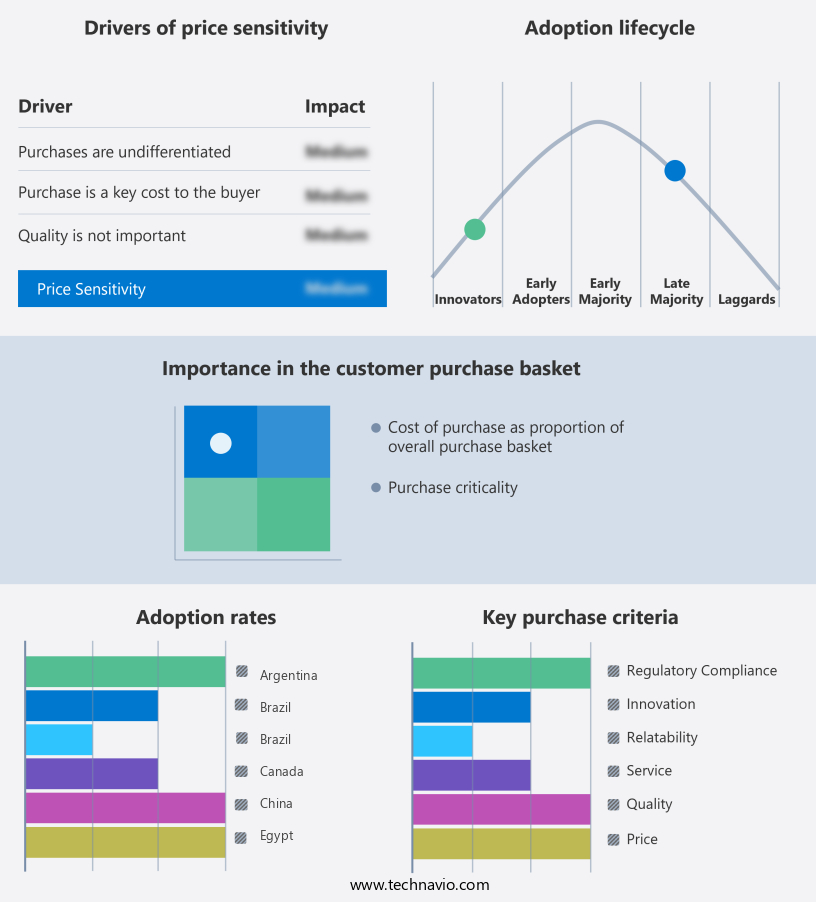
Exclusive Customer Landscape

The smart city platform market forecasting report includes the adoption lifecycle of the market, covering from the innovator's stage to the laggard's stage. It focuses on adoption rates in different regions based on penetration. Furthermore, the smart city platform market report also includes key purchase criteria and drivers of price sensitivity to help companies evaluate and develop their market growth analysis strategies.

Smart City Platform Market Share by Geography

 Customer Landscape

Key Companies & Market Insights

Companies are implementing various strategies, such as strategic alliances, smart city platform market forecast, partnerships, mergers and acquisitions, geographical expansion, and product/service launches, to enhance their presence in the industry.

Accenture plc - This company specializes in implementing advanced smart city platforms, such as ABB Ability Smart City Solutions.

The industry research and growth report includes detailed analyses of the competitive landscape of the market and information about key companies, including:

  • Accenture plc
  • Alibaba Group Holding Ltd.
  • Cisco Systems Inc.
  • Ericsson AB
  • Fujitsu Ltd.
  • General Electric Company
  • Hitachi Ltd.
  • Honeywell International Inc.
  • Huawei Technologies Co. Ltd.
  • IBM Corporation
  • Intel Corporation
  • Itron Inc.
  • Microsoft Corporation
  • Nokia Corporation
  • Oracle Corporation
  • SAP SE
  • Schneider Electric SE
  • Siemens AG
  • Toshiba Corporation
  • Vodafone Group plc

Qualitative and quantitative analysis of companies has been conducted to help clients understand the wider business environment as well as the strengths and weaknesses of key industry players. Data is qualitatively analyzed to categorize companies as pure play, category-focused, industry-focused, and diversified; it is quantitatively analyzed to categorize companies as dominant, leading, strong, tentative, and weak.

Recent Development and News in Smart City Platform Market

  • In February 2024, IBM announced the launch of its new Watson IoT for Cities platform, designed to help city administrators manage and analyze data from various smart city applications, including traffic management, public safety, and energy efficiency (IBM Press Release, 2024). This solution aims to improve urban infrastructure and enhance the quality of life for city residents.
  • In June 2025, Siemens and Microsoft entered into a strategic partnership to integrate Siemens' MindSphere IoT operating system with Microsoft Azure to create a comprehensive smart city platform. This collaboration enables cities to manage their infrastructure more efficiently and effectively by combining Siemens' industrial expertise with Microsoft's cloud capabilities (Microsoft News Center, 2025).
  • In October 2024, Cisco Systems invested USD1 billion in its IoT and digital transformation business, including its smart city initiatives. This significant investment demonstrates Cisco's commitment to expanding its presence in the smart city market and developing innovative solutions to address the challenges faced by urban areas (Cisco Press Release, 2024).
  • In March 2025, the European Union approved the Smart Cities and Communities Mission, a €1.5 billion initiative aimed at creating 100 smart cities by 2030. This ambitious project will focus on energy efficiency, sustainable mobility, and digital transformation, and is expected to significantly boost the European smart city market (European Commission Press Release, 2025).

Research Analyst Overview

The smart city market is experiencing significant growth as urban areas seek to leverage technology for governance and sustainable development. Urban future lies in the implementation of smart city solutions, which integrate connected devices and real-time insights to enhance city operations and improve urban resilience. City data platforms form the backbone of this ecosystem, enabling Data Integration and operational efficiency. Smart city funding is a critical factor in deployment, with grants and investments driving innovation in urban technology trends. Urban analytics and digital cities are key components of smart city design, providing city leaders with the tools to make informed policy decisions and create a future-proof urban strategy.

Smart city regulations and architecture ensure the secure and ethical use of data, while urban technology trends focus on sustainability and innovation. The smart city ecosystem is transforming the urban landscape, with city transformation a priority for governments and businesses alike. Smart city policy and innovation are intertwined, with regulations guiding the deployment of smart city solutions and innovation driving city transformation. The future of cities lies in their ability to adapt and thrive in a digital age, with smart city design and architecture playing a crucial role in urban sustainability and resilience. City data platforms provide the foundation for real-time insights and operational efficiency, enabling city leaders to make informed decisions and improve the quality of life for urban residents.

Smart city implementation requires a holistic approach, with a focus on urban technology trends, sustainable development, and smart city regulations. Urban technology and smart city solutions are revolutionizing city services, from transportation and energy to public safety and waste management. The smart city ecosystem is a complex web of interconnected components, with city data platforms at its core. Smart city grants and investments are fueling innovation in urban technology, with a focus on improving city services and enhancing urban resilience. Smart city strategy and policy are essential for successful implementation, with a focus on data integration and operational efficiency.

Urban technology trends and smart city design are shaping the future of cities, with a focus on sustainability, resilience, and operational efficiency. Smart city architecture and urban analytics are critical components of this transformation, enabling city leaders to make informed decisions and create a smarter, more sustainable urban future.

Dive into Technavio's robust research methodology, blending expert interviews, extensive data synthesis, and validated models for unparalleled Smart City Platform Market insights. See full methodology.

Market Scope

Report Coverage

Details

Page number

148

Base year

2023

Historic period

2018-2022

Forecast period

2024-2028

Growth momentum & CAGR

Accelerate at a CAGR of 23.1%

Market growth 2024-2028

USD 59.1 billion

Market structure

Fragmented

YoY growth 2023-2024(%)

18.5

Key countries

US, Japan, UK, Germany, and Spain

Competitive landscape

Leading Companies, Market Positioning of Companies, Competitive Strategies, and Industry Risks

Request Free Sample

What are the Key Data Covered in this Smart City Platform Market Research and Growth Report?

  • CAGR of the Smart City Platform industry during the forecast period
  • Detailed information on factors that will drive the growth and forecasting between 2024 and 2028
  • Precise estimation of the size of the market and its contribution of the industry in focus to the parent market
  • Accurate predictions about upcoming growth and trends and changes in consumer behaviour
  • Growth of the market across North America, Europe, APAC, Middle East and Africa, and South America
  • Thorough analysis of the market's competitive landscape and detailed information about companies
  • Comprehensive analysis of factors that will challenge the smart city platform market growth of industry companies

We can help! Our analysts can customize this smart city platform market research report to meet your requirements.

Get in touch

1 Executive Summary

  • 1.1 Market overview
    • Executive Summary - Chart on Market Overview
    • Executive Summary - Data Table on Market Overview
    • Executive Summary - Chart on Global Market Characteristics
    • Executive Summary - Chart on Market by Geography
    • Executive Summary - Chart on Market Segmentation by Application
    • Executive Summary - Chart on Incremental Growth
    • Executive Summary - Data Table on Incremental Growth
    • Executive Summary - Chart on Company Market Positioning

2 Market Landscape

  • 2.1 Market ecosystem
    • Parent Market
    • Data Table on - Parent Market
  • 2.2 Market characteristics
    • Market characteristics analysis
  • 2.3 Value chain analysis
    • Value Chain Analysis

3 Market Sizing

  • 3.1 Market definition
    • Offerings of companies included in the market definition
  • 3.2 Market segment analysis
    • Market segments
  • 3.3 Market size 2023
    • 3.4 Market outlook: Forecast for 2023-2028
      • Chart on Global - Market size and forecast 2023-2028 ($ billion)
      • Data Table on Global - Market size and forecast 2023-2028 ($ billion)
      • Chart on Global Market: Year-over-year growth 2023-2028 (%)
      • Data Table on Global Market: Year-over-year growth 2023-2028 (%)

    4 Historic Market Size

    • 4.1 Global Smart City Platform Market 2018 - 2022
      • Historic Market Size - Data Table on Global Smart City Platform Market 2018 - 2022 ($ billion)
    • 4.2 Application segment analysis 2018 - 2022
      • Historic Market Size - Application Segment 2018 - 2022 ($ billion)
    • 4.3 Geography segment analysis 2018 - 2022
      • Historic Market Size - Geography Segment 2018 - 2022 ($ billion)
    • 4.4 Country segment analysis 2018 - 2022
      • Historic Market Size - Country Segment 2018 - 2022 ($ billion)

    5 Five Forces Analysis

    • 5.1 Five forces summary
      • Five forces analysis - Comparison between 2023 and 2028
    • 5.2 Bargaining power of buyers
      • Bargaining power of buyers - Impact of key factors 2023 and 2028
    • 5.3 Bargaining power of suppliers
      • Bargaining power of suppliers - Impact of key factors in 2023 and 2028
    • 5.4 Threat of new entrants
      • Threat of new entrants - Impact of key factors in 2023 and 2028
    • 5.5 Threat of substitutes
      • Threat of substitutes - Impact of key factors in 2023 and 2028
    • 5.6 Threat of rivalry
      • Threat of rivalry - Impact of key factors in 2023 and 2028
    • 5.7 Market condition
      • Chart on Market condition - Five forces 2023 and 2028

    6 Market Segmentation by Application

    • 6.1 Market segments
      • Chart on Application - Market share (2023-2028) (%)
      • Data Table on Application - Market share (2023-2028) (%)
    • 6.2 Comparison by Application
      • Chart on Comparison by Application
      • Data Table on Comparison by Application
    • 6.3 Smart infrastructure - Market size and forecast (2023-2028)
      • Chart on Smart infrastructure - Market size and forecast (2023-2028) ($ billion)
      • Data Table on Smart infrastructure - Market size and forecast (2023-2028) ($ billion)
      • Chart on Smart infrastructure - Year-over-year growth (2023-2028) (%)
      • Data Table on Smart infrastructure - Year-over-year growth (2023-2028) (%)
    • 6.4 Smart building - Market size and forecast (2023-2028)
      • Chart on Smart building - Market size and forecast (2023-2028) ($ billion)
      • Data Table on Smart building - Market size and forecast (2023-2028) ($ billion)
      • Chart on Smart building - Year-over-year growth (2023-2028) (%)
      • Data Table on Smart building - Year-over-year growth (2023-2028) (%)
    • 6.5 Smart utilities - Market size and forecast (2023-2028)
      • Chart on Smart utilities - Market size and forecast (2023-2028) ($ billion)
      • Data Table on Smart utilities - Market size and forecast (2023-2028) ($ billion)
      • Chart on Smart utilities - Year-over-year growth (2023-2028) (%)
      • Data Table on Smart utilities - Year-over-year growth (2023-2028) (%)
    • 6.6 Others - Market size and forecast (2023-2028)
      • Chart on Others - Market size and forecast (2023-2028) ($ billion)
      • Data Table on Others - Market size and forecast (2023-2028) ($ billion)
      • Chart on Others - Year-over-year growth (2023-2028) (%)
      • Data Table on Others - Year-over-year growth (2023-2028) (%)
    • 6.7 Market opportunity by Application
      • Market opportunity by Application ($ billion)
      • Data Table on Market opportunity by Application ($ billion)

    7 Market Segmentation by Offering

    • 7.1 Market segments
      • Chart on Offering - Market share (2023-2028) (%)
      • Data Table on Offering - Market share (2023-2028) (%)
    • 7.2 Comparison by Offering
      • Chart on Comparison by Offering
      • Data Table on Comparison by Offering
    • 7.3 Connectivity management platforms - Market size and forecast (2023-2028)
      • Chart on Connectivity management platforms - Market size and forecast (2023-2028) ($ billion)
      • Data Table on Connectivity management platforms - Market size and forecast (2023-2028) ($ billion)
      • Chart on Connectivity management platforms - Year-over-year growth (2023-2028) (%)
      • Data Table on Connectivity management platforms - Year-over-year growth (2023-2028) (%)
    • 7.4 Integration platforms - Market size and forecast (2023-2028)
      • Chart on Integration platforms - Market size and forecast (2023-2028) ($ billion)
      • Data Table on Integration platforms - Market size and forecast (2023-2028) ($ billion)
      • Chart on Integration platforms - Year-over-year growth (2023-2028) (%)
      • Data Table on Integration platforms - Year-over-year growth (2023-2028) (%)
    • 7.5 Device management platforms - Market size and forecast (2023-2028)
      • Chart on Device management platforms - Market size and forecast (2023-2028) ($ billion)
      • Data Table on Device management platforms - Market size and forecast (2023-2028) ($ billion)
      • Chart on Device management platforms - Year-over-year growth (2023-2028) (%)
      • Data Table on Device management platforms - Year-over-year growth (2023-2028) (%)
    • 7.6 Data management platforms - Market size and forecast (2023-2028)
      • Chart on Data management platforms - Market size and forecast (2023-2028) ($ billion)
      • Data Table on Data management platforms - Market size and forecast (2023-2028) ($ billion)
      • Chart on Data management platforms - Year-over-year growth (2023-2028) (%)
      • Data Table on Data management platforms - Year-over-year growth (2023-2028) (%)
    • 7.7 Security platforms - Market size and forecast (2023-2028)
      • Chart on Security platforms - Market size and forecast (2023-2028) ($ billion)
      • Data Table on Security platforms - Market size and forecast (2023-2028) ($ billion)
      • Chart on Security platforms - Year-over-year growth (2023-2028) (%)
      • Data Table on Security platforms - Year-over-year growth (2023-2028) (%)
    • 7.8 Market opportunity by Offering
      • Market opportunity by Offering ($ billion)
      • Data Table on Market opportunity by Offering ($ billion)

    8 Market Segmentation by Services

    • 8.1 Market segments
      • Chart on Services - Market share (2023-2028) (%)
      • Data Table on Services - Market share (2023-2028) (%)
    • 8.2 Comparison by Services
      • Chart on Comparison by Services
      • Data Table on Comparison by Services
    • 8.3 Professional services - Market size and forecast (2023-2028)
      • Chart on Professional services - Market size and forecast (2023-2028) ($ billion)
      • Data Table on Professional services - Market size and forecast (2023-2028) ($ billion)
      • Chart on Professional services - Year-over-year growth (2023-2028) (%)
      • Data Table on Professional services - Year-over-year growth (2023-2028) (%)
    • 8.4 Managed services - Market size and forecast (2023-2028)
      • Chart on Managed services - Market size and forecast (2023-2028) ($ billion)
      • Data Table on Managed services - Market size and forecast (2023-2028) ($ billion)
      • Chart on Managed services - Year-over-year growth (2023-2028) (%)
      • Data Table on Managed services - Year-over-year growth (2023-2028) (%)
    • 8.5 Market opportunity by Services
      • Market opportunity by Services ($ billion)
      • Data Table on Market opportunity by Services ($ billion)

    9 Market Segmentation by Component

    • 9.1 Market segments
      • Chart on Component - Market share (2023-2028) (%)
      • Data Table on Component - Market share (2023-2028) (%)
    • 9.2 Comparison by Component
      • Chart on Comparison by Component
      • Data Table on Comparison by Component
    • 9.3 Software Platforms - Market size and forecast (2023-2028)
      • Chart on Software Platforms - Market size and forecast (2023-2028) ($ billion)
      • Data Table on Software Platforms - Market size and forecast (2023-2028) ($ billion)
      • Chart on Software Platforms - Year-over-year growth (2023-2028) (%)
      • Data Table on Software Platforms - Year-over-year growth (2023-2028) (%)
    • 9.4 Hardware Solutions - Market size and forecast (2023-2028)
      • Chart on Hardware Solutions - Market size and forecast (2023-2028) ($ billion)
      • Data Table on Hardware Solutions - Market size and forecast (2023-2028) ($ billion)
      • Chart on Hardware Solutions - Year-over-year growth (2023-2028) (%)
      • Data Table on Hardware Solutions - Year-over-year growth (2023-2028) (%)
    • 9.5 Services - Market size and forecast (2023-2028)
      • Chart on Services - Market size and forecast (2023-2028) ($ billion)
      • Data Table on Services - Market size and forecast (2023-2028) ($ billion)
      • Chart on Services - Year-over-year growth (2023-2028) (%)
      • Data Table on Services - Year-over-year growth (2023-2028) (%)
    • 9.6 Market opportunity by Component
      • Market opportunity by Component ($ billion)
      • Data Table on Market opportunity by Component ($ billion)

    10 Market Segmentation by End-User

    • 10.1 Market segments
      • Chart on End-User - Market share (2023-2028) (%)
      • Data Table on End-User - Market share (2023-2028) (%)
    • 10.2 Comparison by End-User
      • Chart on Comparison by End-User
      • Data Table on Comparison by End-User
    • 10.3 Government - Market size and forecast (2023-2028)
      • Chart on Government - Market size and forecast (2023-2028) ($ billion)
      • Data Table on Government - Market size and forecast (2023-2028) ($ billion)
      • Chart on Government - Year-over-year growth (2023-2028) (%)
      • Data Table on Government - Year-over-year growth (2023-2028) (%)
    • 10.4 Commercial Enterprises - Market size and forecast (2023-2028)
      • Chart on Commercial Enterprises - Market size and forecast (2023-2028) ($ billion)
      • Data Table on Commercial Enterprises - Market size and forecast (2023-2028) ($ billion)
      • Chart on Commercial Enterprises - Year-over-year growth (2023-2028) (%)
      • Data Table on Commercial Enterprises - Year-over-year growth (2023-2028) (%)
    • 10.5 Residential Communities - Market size and forecast (2023-2028)
      • Chart on Residential Communities - Market size and forecast (2023-2028) ($ billion)
      • Data Table on Residential Communities - Market size and forecast (2023-2028) ($ billion)
      • Chart on Residential Communities - Year-over-year growth (2023-2028) (%)
      • Data Table on Residential Communities - Year-over-year growth (2023-2028) (%)
    • 10.6 Market opportunity by End-User
      • Market opportunity by End-User ($ billion)
      • Data Table on Market opportunity by End-User ($ billion)

    11 Customer Landscape

    • 11.1 Customer landscape overview
      • Analysis of price sensitivity, lifecycle, customer purchase basket, adoption rates, and purchase criteria

    12 Geographic Landscape

    • 12.1 Geographic segmentation
      • Chart on Market share by geography 2023-2028 (%)
      • Data Table on Market share by geography 2023-2028 (%)
    • 12.2 Geographic comparison
      • Chart on Geographic comparison
      • Data Table on Geographic comparison
    • 12.3 North America - Market size and forecast 2023-2028
      • Chart on North America - Market size and forecast 2023-2028 ($ billion)
      • Data Table on North America - Market size and forecast 2023-2028 ($ billion)
      • Chart on North America - Year-over-year growth 2023-2028 (%)
      • Data Table on North America - Year-over-year growth 2023-2028 (%)
    • 12.4 Europe - Market size and forecast 2023-2028
      • Chart on Europe - Market size and forecast 2023-2028 ($ billion)
      • Data Table on Europe - Market size and forecast 2023-2028 ($ billion)
      • Chart on Europe - Year-over-year growth 2023-2028 (%)
      • Data Table on Europe - Year-over-year growth 2023-2028 (%)
    • 12.5 APAC - Market size and forecast 2023-2028
      • Chart on APAC - Market size and forecast 2023-2028 ($ billion)
      • Data Table on APAC - Market size and forecast 2023-2028 ($ billion)
      • Chart on APAC - Year-over-year growth 2023-2028 (%)
      • Data Table on APAC - Year-over-year growth 2023-2028 (%)
    • 12.6 Middle East and Africa - Market size and forecast 2023-2028
      • Chart on Middle East and Africa - Market size and forecast 2023-2028 ($ billion)
      • Data Table on Middle East and Africa - Market size and forecast 2023-2028 ($ billion)
      • Chart on Middle East and Africa - Year-over-year growth 2023-2028 (%)
      • Data Table on Middle East and Africa - Year-over-year growth 2023-2028 (%)
    • 12.7 South America - Market size and forecast 2023-2028
      • Chart on South America - Market size and forecast 2023-2028 ($ billion)
      • Data Table on South America - Market size and forecast 2023-2028 ($ billion)
      • Chart on South America - Year-over-year growth 2023-2028 (%)
      • Data Table on South America - Year-over-year growth 2023-2028 (%)
    • 12.8 US - Market size and forecast 2023-2028
      • Chart on US - Market size and forecast 2023-2028 ($ billion)
      • Data Table on US - Market size and forecast 2023-2028 ($ billion)
      • Chart on US - Year-over-year growth 2023-2028 (%)
      • Data Table on US - Year-over-year growth 2023-2028 (%)
    • 12.9 Japan - Market size and forecast 2023-2028
      • Chart on Japan - Market size and forecast 2023-2028 ($ billion)
      • Data Table on Japan - Market size and forecast 2023-2028 ($ billion)
      • Chart on Japan - Year-over-year growth 2023-2028 (%)
      • Data Table on Japan - Year-over-year growth 2023-2028 (%)
    • 12.10 UK - Market size and forecast 2023-2028
      • Chart on UK - Market size and forecast 2023-2028 ($ billion)
      • Data Table on UK - Market size and forecast 2023-2028 ($ billion)
      • Chart on UK - Year-over-year growth 2023-2028 (%)
      • Data Table on UK - Year-over-year growth 2023-2028 (%)
    • 12.11 Germany - Market size and forecast 2023-2028
      • Chart on Germany - Market size and forecast 2023-2028 ($ billion)
      • Data Table on Germany - Market size and forecast 2023-2028 ($ billion)
      • Chart on Germany - Year-over-year growth 2023-2028 (%)
      • Data Table on Germany - Year-over-year growth 2023-2028 (%)
    • 12.12 Spain - Market size and forecast 2023-2028
      • Chart on Spain - Market size and forecast 2023-2028 ($ billion)
      • Data Table on Spain - Market size and forecast 2023-2028 ($ billion)
      • Chart on Spain - Year-over-year growth 2023-2028 (%)
      • Data Table on Spain - Year-over-year growth 2023-2028 (%)
    • 12.13 Market opportunity by geography
      • Market opportunity by geography ($ billion)
      • Data Tables on Market opportunity by geography ($ billion)
    • 12.14 Rest of World (ROW) - Market size and forecast (2023-2028)
      • Chart on Rest of World (ROW) - Market size and forecast (2023-2028) ($ billion)
      • Data Table on Rest of World (ROW) - Market size and forecast (2023-2028) ($ billion)
      • Chart on Rest of World (ROW) - Year-over-year growth (2023-2028) (%)
      • Data Table on Rest of World (ROW) - Year-over-year growth (2023-2028) (%)

    13 Drivers, Challenges, and Opportunity/Restraints

    • 13.1 Market drivers
      • 13.2 Market challenges
        • 13.3 Impact of drivers and challenges
          • Impact of drivers and challenges in 2023 and 2028
        • 13.4 Market opportunities/restraints

          14 Competitive Landscape

          • 14.1 Overview
            • 14.2 Competitive Landscape
              • Overview on criticality of inputs and factors of differentiation
            • 14.3 Landscape disruption
              • Overview on factors of disruption
            • 14.4 Industry risks
              • Impact of key risks on business

            15 Competitive Analysis

            • 15.1 Companies profiled
              • Companies covered
            • 15.2 Market positioning of companies
              • Matrix on companies position and classification
            • 15.3 Accenture plc
              • Accenture plc - Overview
              • Accenture plc - Product / Service
              • Accenture plc - Key offerings
            • 15.4 Alibaba Group Holding Ltd.
              • Alibaba Group Holding Ltd. - Overview
              • Alibaba Group Holding Ltd. - Product / Service
              • Alibaba Group Holding Ltd. - Key offerings
            • 15.5 Cisco Systems Inc.
              • Cisco Systems Inc. - Overview
              • Cisco Systems Inc. - Product / Service
              • Cisco Systems Inc. - Key offerings
            • 15.6 Ericsson AB
              • Ericsson AB - Overview
              • Ericsson AB - Product / Service
              • Ericsson AB - Key offerings
            • 15.7 Fujitsu Ltd.
              • Fujitsu Ltd. - Overview
              • Fujitsu Ltd. - Product / Service
              • Fujitsu Ltd. - Key offerings
            • 15.8 General Electric Company
              • General Electric Company - Overview
              • General Electric Company - Product / Service
              • General Electric Company - Key offerings
            • 15.9 Hitachi Ltd.
              • Hitachi Ltd. - Overview
              • Hitachi Ltd. - Product / Service
              • Hitachi Ltd. - Key offerings
            • 15.10 Honeywell International Inc.
              • Honeywell International Inc. - Overview
              • Honeywell International Inc. - Product / Service
              • Honeywell International Inc. - Key offerings
            • 15.11 Huawei Technologies Co. Ltd.
              • Huawei Technologies Co. Ltd. - Overview
              • Huawei Technologies Co. Ltd. - Product / Service
              • Huawei Technologies Co. Ltd. - Key offerings
            • 15.12 IBM Corporation
              • IBM Corporation - Overview
              • IBM Corporation - Product / Service
              • IBM Corporation - Key offerings
            • 15.13 Intel Corporation
              • Intel Corporation - Overview
              • Intel Corporation - Product / Service
              • Intel Corporation - Key offerings
            • 15.14 Itron Inc.
              • Itron Inc. - Overview
              • Itron Inc. - Product / Service
              • Itron Inc. - Key offerings
            • 15.15 Microsoft Corporation
              • Microsoft Corporation - Overview
              • Microsoft Corporation - Product / Service
              • Microsoft Corporation - Key offerings
            • 15.16 Nokia Corporation
              • Nokia Corporation - Overview
              • Nokia Corporation - Product / Service
              • Nokia Corporation - Key offerings
            • 15.17 Oracle Corporation
              • Oracle Corporation - Overview
              • Oracle Corporation - Product / Service
              • Oracle Corporation - Key offerings
            • 15.18 SAP SE
              • SAP SE - Overview
              • SAP SE - Product / Service
              • SAP SE - Key offerings
            • 15.19 Schneider Electric SE
              • Schneider Electric SE - Overview
              • Schneider Electric SE - Product / Service
              • Schneider Electric SE - Key offerings
            • 15.20 Siemens AG
              • Siemens AG - Overview
              • Siemens AG - Product / Service
              • Siemens AG - Key offerings
            • 15.21 Toshiba Corporation
              • Toshiba Corporation - Overview
              • Toshiba Corporation - Product / Service
              • Toshiba Corporation - Key offerings
            • 15.22 Vodafone Group plc
              • Vodafone Group plc - Overview
              • Vodafone Group plc - Product / Service
              • Vodafone Group plc - Key offerings
            • 15.23 ABB
              • ABB - Overview
              • ABB - Product / Service
              • ABB - Key offerings
            • 15.24 Alibaba Group Holding Ltd.
              • Alibaba Group Holding Ltd. - Overview
              • Alibaba Group Holding Ltd. - Product / Service
              • Alibaba Group Holding Ltd. - Key offerings
            • 15.25 Amazon.com Inc.
              • Amazon.com Inc. - Overview
              • Amazon.com Inc. - Product / Service
              • Amazon.com Inc. - Key offerings
            • 15.26 Cisco Systems Inc.
              • Cisco Systems Inc. - Overview
              • Cisco Systems Inc. - Product / Service
              • Cisco Systems Inc. - Key offerings
            • 15.27 Confidex Ltd.
              • Confidex Ltd. - Overview
              • Confidex Ltd. - Product / Service
              • Confidex Ltd. - Key offerings
            • 15.28 Fujitsu Ltd.
              • Fujitsu Ltd. - Overview
              • Fujitsu Ltd. - Product / Service
              • Fujitsu Ltd. - Key offerings
            • 15.29 Fybr
              • Fybr - Overview
              • Fybr - Product / Service
              • Fybr - Key offerings
            • 15.30 Hitachi Ltd.
              • Hitachi Ltd. - Overview
              • Hitachi Ltd. - Product / Service
              • Hitachi Ltd. - Key offerings
            • 15.31 Huawei Technologies Co. Ltd.
              • Huawei Technologies Co. Ltd. - Overview
              • Huawei Technologies Co. Ltd. - Product / Service
              • Huawei Technologies Co. Ltd. - Key offerings
            • 15.32 Intel Corp.
              • Intel Corp. - Overview
              • Intel Corp. - Product / Service
              • Intel Corp. - Key offerings
            • 15.33 KaaIoT Technologies LLC
              • KaaIoT Technologies LLC - Overview
              • KaaIoT Technologies LLC - Product / Service
              • KaaIoT Technologies LLC - Key offerings
            • 15.34 Microsoft Corp.
              • Microsoft Corp. - Overview
              • Microsoft Corp. - Product / Service
              • Microsoft Corp. - Key offerings
            • 15.35 Oracle Corp.
              • Oracle Corp. - Overview
              • Oracle Corp. - Product / Service
              • Oracle Corp. - Key offerings
            • 15.36 Quantela Inc.
              • Quantela Inc. - Overview
              • Quantela Inc. - Product / Service
              • Quantela Inc. - Key offerings
            • 15.37 Robert Bosch GmbH
              • Robert Bosch GmbH - Overview
              • Robert Bosch GmbH - Product / Service
              • Robert Bosch GmbH - Key offerings
            • 15.38 SAP SE
              • SAP SE - Overview
              • SAP SE - Product / Service
              • SAP SE - Key offerings
            • 15.39 Schneider Electric SE
              • Schneider Electric SE - Overview
              • Schneider Electric SE - Product / Service
              • Schneider Electric SE - Key offerings
            • 15.40 Siemens AG
              • Siemens AG - Overview
              • Siemens AG - Product / Service
              • Siemens AG - Key offerings
            • 15.41 Signify NV
              • Signify NV - Overview
              • Signify NV - Product / Service
              • Signify NV - Key offerings
            • 15.42 Telefonaktiebolaget LM Ericsson
              • Telefonaktiebolaget LM Ericsson - Overview
              • Telefonaktiebolaget LM Ericsson - Product / Service
              • Telefonaktiebolaget LM Ericsson - Key offerings

            16 Appendix

            • 16.1 Scope of the report
              • 16.2 Inclusions and exclusions checklist
                • Inclusions checklist
                • Exclusions checklist
              • 16.3 Currency conversion rates for US$
                • Currency conversion rates for US$
              • 16.4 Research methodology
                • Research methodology
              • 16.5 Data procurement
                • Information sources
              • 16.6 Data validation
                • Data validation
              • 16.7 Validation techniques employed for market sizing
                • Validation techniques employed for market sizing
              • 16.8 Data synthesis
                • Data synthesis
              • 16.9 360 degree market analysis
                • 360 degree market analysis
              • 16.10 List of abbreviations
                • List of abbreviations

              Research Methodology

              Technavio presents a detailed picture of the market by way of study, synthesis, and summation of data from multiple sources. The analysts have presented the various facets of the market with a particular focus on identifying the key industry influencers. The data thus presented is comprehensive, reliable, and the result of extensive research, both primary and secondary.

              INFORMATION SOURCES

              Primary sources

              • Manufacturers and suppliers
              • Channel partners
              • Industry experts
              • Strategic decision makers

              Secondary sources

              • Industry journals and periodicals
              • Government data
              • Financial reports of key industry players
              • Historical data
              • Press releases

              DATA ANALYSIS

              Data Synthesis

              • Collation of data
              • Estimation of key figures
              • Analysis of derived insights

              Data Validation

              • Triangulation with data models
              • Reference against proprietary databases
              • Corroboration with industry experts

              REPORT WRITING

              Qualitative

              • Market drivers
              • Market challenges
              • Market trends
              • Five forces analysis

              Quantitative

              • Market size and forecast
              • Market segmentation
              • Geographical insights
              • Competitive landscape

              Interested in this report?

              Get your sample now to see our research methodology and insights!

              Download Now

              Frequently Asked Questions

              Smart City Platform market growth will increase by $ 59.1 bn during 2024-2028.

              The Smart City Platform market is expected to grow at a CAGR of 23.1% during 2024-2028.

              Smart City Platform market is segmented by Application( Smart infrastructure, Smart building, Smart utilities, Others) Offering( Connectivity management platforms, Integration platforms, Device management platforms, Data management platforms, Security platforms)

              Accenture plc, Alibaba Group Holding Ltd., Cisco Systems Inc., Ericsson AB, Fujitsu Ltd., General Electric Company, Hitachi Ltd., Honeywell International Inc., Huawei Technologies Co. Ltd., IBM Corporation, Intel Corporation, Itron Inc., Microsoft Corporation, Nokia Corporation, Oracle Corporation, SAP SE, Schneider Electric SE, Siemens AG, Toshiba Corporation, Vodafone Group plc are a few of the key vendors in the Smart City Platform market.

              APAC will register the highest growth rate of 38% among the other regions. Therefore, the Smart City Platform market in APAC is expected to garner significant business opportunities for the vendors during the forecast period.

              US, Japan, UK, Germany, Spain

              • Growing need for building automationThere are several advantages to building automation software. For instance is the driving factor this market.
              • this software acts as a control system to automate is the driving factor this market.
              • regulate is the driving factor this market.
              • and control the facility subsystems by maintaining the predefined parameters for different systems in a building. Therefore is the driving factor this market.
              • this software allows industrial is the driving factor this market.
              • residential is the driving factor this market.
              • and commercial buildings to manage is the driving factor this market.
              • control is the driving factor this market.
              • and operate the functioning of their buildings easily and more efficiently. In light of these benefits is the driving factor this market.
              • building automation has become an integral aspect of businesses these days. The adoption of building automation software enhances organizations cost savings by facilitating efficient energy management. For example is the driving factor this market.
              • all the parts of a heating is the driving factor this market.
              • ventilation is the driving factor this market.
              • and air conditioning (HVAC) system is the driving factor this market.
              • including the different components is the driving factor this market.
              • are connected to building management systems. An alarm is set off if the value for any of these subsystems exceeds the predefined limits. Such factors will play an important role in driving the growth of the market in focus during the forecast period. is the driving factor this market.

              The Smart City Platform market vendors should focus on grabbing business opportunities from the Smart infrastructure segment as it accounted for the largest market share in the base year.