
Smart Pole Market Size 2025-2029
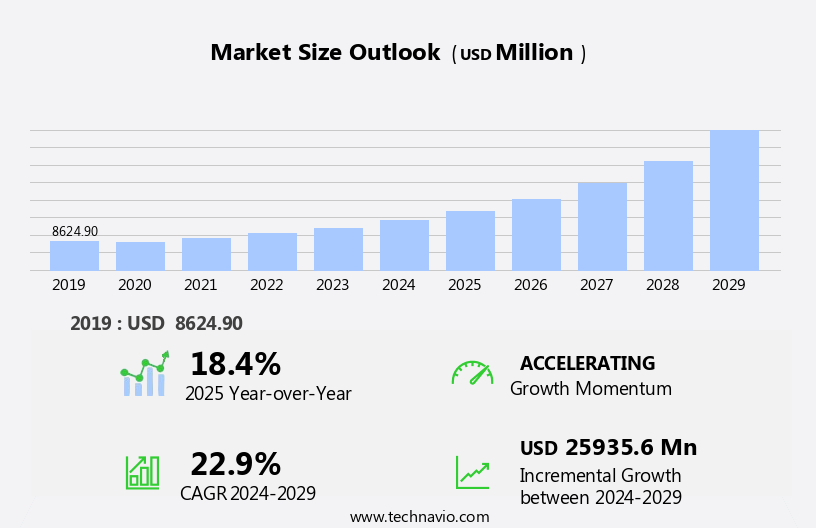
The smart pole market size is forecast to increase by USD 25.94 billion at a CAGR of 22.9% between 2024 and 2029.
- The market is experiencing significant growth due to the increasing number of smart cities worldwide. Smart poles, which enable multiple functionalities such as lighting, Wi-Fi, and surveillance, are becoming an integral part of urban infrastructure. However, the high costs associated with the implementation of these poles pose a significant challenge for market growth. Despite this obstacle, the market is expected to continue expanding as cities seek to enhance their digital capabilities and improve the quality of life for their residents.
- The integration of advanced technologies, such as 5G and the Internet of Things (IoT), into smart poles is also driving innovation and creating new opportunities for market participants. Companies in the market must carefully navigate the high costs and regulatory complexities to effectively capitalize on these opportunities and stay competitive.
What will be the Size of the Smart Pole Market during the forecast period?
- The market continues to evolve, integrating various technologies to enhance urban infrastructure and optimize city operations. LED lighting, network management, fiber optic cable, smart signage, pole installation, data visualization, environmental sensors, security systems, dynamic pricing, data analytics, and pole foundation are among the key components of this dynamic ecosystem. Wireless communication and IoT connectivity enable real-time data collection and analysis, transforming traditional pole structures into intelligent nodes. Renewable energy integration and energy efficiency are essential aspects, with charging stations for electric vehicles and public Wi-Fi adding to the convenience and sustainability. Smart city infrastructure, including noise pollution monitoring, smart kiosks, emergency response, and traffic management, benefits from these advancements.
- Urban planning and smart parking solutions leverage edge computing and cloud computing for predictive maintenance and efficient resource allocation. Smart pole deployment involves the integration of pole design, pole maintenance, and pole construction, ensuring the longevity and effectiveness of the infrastructure. Smart pole solutions also incorporate innovative materials like composite materials for improved durability and reduced weight. The market's continuous evolution is driven by the integration of advanced technologies such as 5G technology, smart grid integration, and smart street furniture. These developments contribute to a more connected and efficient urban landscape, enhancing the overall quality of life for city dwellers.
How is this Smart Pole Industry segmented?
The smart pole industry research report provides comprehensive data (region-wise segment analysis), with forecasts and estimates in "USD million" for the period 2025-2029, as well as historical data from 2019-2023 for the following segments.
- Type
- Retrofit installations
- New installations
- Product
- Component
- Software
- Services
- Application
- Highways and roadways
- Public places
- Railways and harbors
- Technology
- LED technology
- Solar power technology
- IoT technology
- Communication technology
- Geography
- North America
- US
- Canada
- Europe
- France
- Germany
- Italy
- UK
- APAC
- China
- India
- Japan
- South America
- Brazil
- Rest of World (ROW)
- North America
By Type Insights
The retrofit installations segment is estimated to witness significant growth during the forecast period.
The market is witnessing significant growth due to the increasing adoption of infrastructure upgrades and wireless communication technologies. Retrofit installations, which involve enhancing traditional street light poles with smart features, dominate the market. This trend is driven by the massive number of conventional streetlights being upgraded to smart poles worldwide. For instance, it's projected that approximately 64 million smart street light poles will be installed globally by 2027. Composite materials, such as galvanized steel, are increasingly used in smart pole construction for their durability and strength. Smart poles integrate various advanced technologies like real-time data collection, charging stations, smart kiosks, remote monitoring, and digital signage.
They also offer features such as noise pollution monitoring, air quality monitoring, emergency response, and IoT connectivity, contributing to the development of smart city infrastructure. Renewable energy sources and energy efficiency are essential components of smart poles, making them environmentally friendly and cost-effective. Smart poles offer urban planning benefits, including video surveillance, traffic management, and public Wi-Fi, enhancing overall city infrastructure. They also provide smart parking solutions, edge computing capabilities, and connected infrastructure, improving overall city functionality and convenience. Smart pole deployment involves sensor networks, cloud computing, predictive maintenance, and 5G technology, ensuring efficient network management and data analytics.
Smart poles are integral to smart city development, providing essential services and data to create a more connected and efficient urban environment. They offer numerous benefits, including smart lighting control, public safety, power distribution, and LED lighting, making them an indispensable part of modern urban planning.
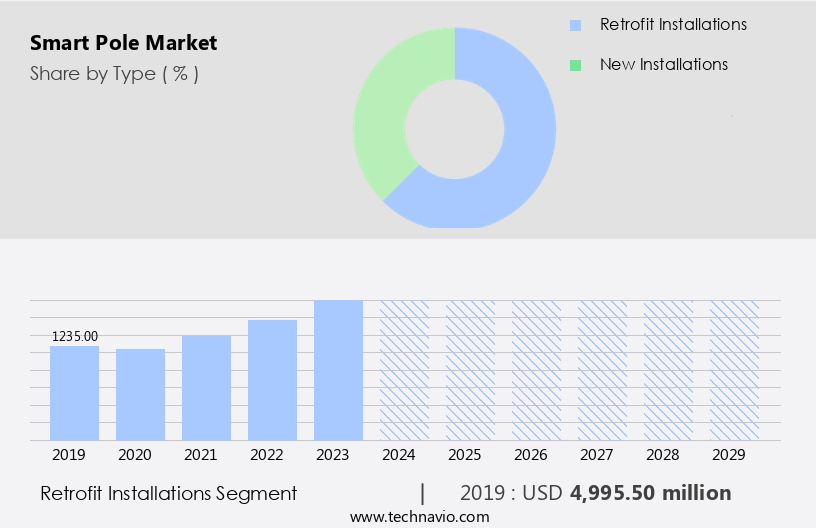
The Retrofit installations segment was valued at USD 5 billion in 2019 and showed a gradual increase during the forecast period.
Regional Analysis
North America is estimated to contribute 33% to the growth of the global market during the forecast period.Technavio’s analysts have elaborately explained the regional trends and drivers that shape the market during the forecast period.
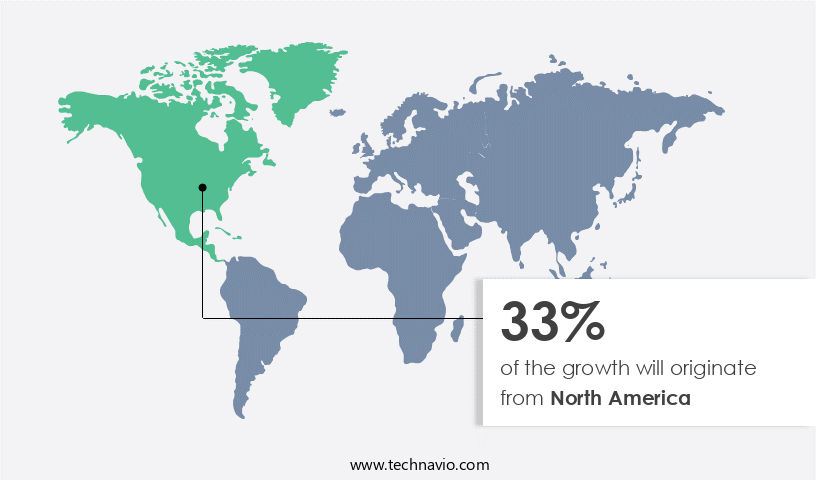
In the US market, the adoption of smart poles is gaining momentum due to the push for infrastructure upgrades and the integration of wireless communication, digital displays, and IoT connectivity. Smart poles are increasingly being used for urban planning, with applications ranging from renewable energy and air quality monitoring to emergency response and traffic management. These poles, often made from composite materials, serve as integral components of smart city infrastructure, offering real-time data and energy efficiency. Urban areas are seeing the installation of smart kiosks, charging stations, and smart parking systems, all interconnected through edge computing and cloud computing.
Smart pole deployment also includes smart lighting control, public safety, and power distribution, with features like dynamic pricing and data analytics enhancing their functionality. The integration of 5G technology and pole maintenance systems further strengthens their appeal. In North America, the US is a significant contributor to the market, with California leading the way in installation. Smart pole deployment is not only about pole installation but also about network management, fiber optic cable integration, and sensor networks for predictive maintenance. The future of smart poles lies in their ability to provide a harmonious blend of technology and urban design, addressing the needs of modern cities while minimizing noise pollution and ensuring energy efficiency.
Market Dynamics
Our researchers analyzed the data with 2024 as the base year, along with the key drivers, trends, and challenges. A holistic analysis of drivers will help companies refine their marketing strategies to gain a competitive advantage.
What are the key market drivers leading to the rise in the adoption of Smart Pole Industry?
- The smart pole, which facilitates multiple functionalities, serves as the primary market driver.
- Smart poles, an advanced form of street lighting, are increasingly being adopted by cities worldwide due to their energy efficiency and multiple functionalities. Compared to traditional streetlights, LED lights in smart poles save approximately 40% of energy. However, their benefits extend beyond energy savings. Smart poles are equipped with features such as auto dimming, which adjusts light intensity based on surrounding conditions, potentially saving cities up to 50% on overall lighting costs. These advanced structures contribute significantly to urban infrastructure by enhancing environmental monitoring, increasing public and traffic safety, and upgrading connectivity through public Wi-Fi hotspots. Smart poles enable location-based services like smart parking and traffic management, making city life more convenient and efficient.
- Additionally, they offer features such as video surveillance, digital signage, electric vehicle charging, and street furniture integration. Galvanized steel construction ensures robustness and longevity, making smart poles a valuable investment for urban planning. In conclusion, smart poles represent a significant step forward in the intelligent transformation of cities, offering energy savings, enhanced functionality, and improved connectivity.
What are the market trends shaping the Smart Pole Industry?
- The trend toward the development of smart cities is gaining momentum in the market. With an increasing number of cities embracing advanced technologies to enhance their infrastructure and improve the quality of life for residents, this sector is poised for significant growth.
- Smart poles are an integral part of connected infrastructure in the context of smart cities, which are digital urban areas characterized by interconnected technologies that enhance communication among devices, improve performance, and reduce costs. These technologies include edge computing, sensor networks, and 5G technology, among others. The deployment of smart poles is expected to gain momentum as the number of smart cities grows during the forecast period. Smart poles serve various functions, such as smart lighting control, power distribution, public safety, and pole maintenance, utilizing predictive maintenance and cloud computing for efficient resource usage and improved transportation quality.
- The integration of smart pole solutions into urban infrastructure is essential for a future with faster connectivity and prompt suggestion-based services, contributing to a more harmonious and immersive urban experience.
What challenges does the Smart Pole Industry face during its growth?
- The expansion of the smart poles industry is confronted by significant costs, a major challenge that necessitates continued innovation and efficiency in design and implementation.
- The market growth is influenced by the integration of advanced technologies such as LED lighting, network management, fiber optic cable, smart signage, data visualization, environmental sensors, security systems, dynamic pricing, and data analytics. Smart poles are essential components of smart cities, offering numerous benefits, including energy efficiency and improved urban infrastructure. However, the high cost of smart pole installation remains a significant barrier to market expansion. The average cost of a smart pole is approximately USD14,000, with installation costs ranging from USD500 to USD1,000. In comparison, conventional street light poles and LED street light poles are more cost-effective.
- Despite this challenge, the market is expected to grow due to the increasing demand for sustainable and connected urban infrastructure. Smart poles offer a harmonious blend of technology and aesthetics, emphasizing energy efficiency, data analytics, and security systems. The market's future potential lies in its ability to provide a robust and immersive urban experience, making it an essential investment for governments and municipalities.
Exclusive Customer Landscape
The smart pole market forecasting report includes the adoption lifecycle of the market, covering from the innovator’s stage to the laggard’s stage. It focuses on adoption rates in different regions based on penetration. Furthermore, the smart pole market report also includes key purchase criteria and drivers of price sensitivity to help companies evaluate and develop their market growth analysis strategies.
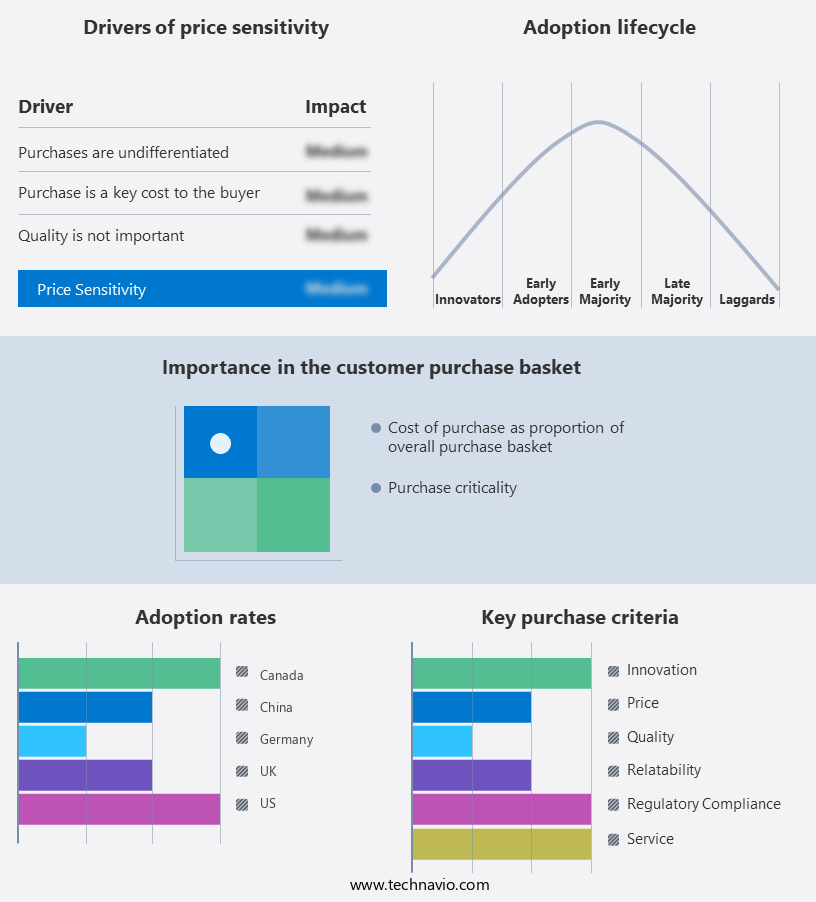
Customer Landscape
Key Companies & Market Insights
Companies are implementing various strategies, such as strategic alliances, smart pole market forecast, partnerships, mergers and acquisitions, geographical expansion, and product/service launches, to enhance their presence in the industry.
Acuity Brands Inc. - The company specializes in innovative smart pole technology for infrastructure applications, including roads, bridges, and tunnels. These advanced poles enhance infrastructure efficiency and safety through integrated lighting, telecommunications, and environmental monitoring systems. By optimizing energy consumption and improving data connectivity, our solutions contribute to sustainable urban development and enhanced public services.
The industry research and growth report includes detailed analyses of the competitive landscape of the market and information about key companies, including:
- Acuity Brands Inc.
- Eaton Corp. plc
- ELKO EP Holding SE
- General Electric Co.
- Goldspar Australia Pty Ltd.
- Hubbell Inc.
- Itron Inc.
- Jaquar India
- Koninklijke Philips NV
- Lumca Inc.
- Mobile Pro Systems
- Norsk Hydro ASA
- OMNIFLOW SA
- Renesas Electronics Corp.
- Shanghai Sansi Electronic Engineering Technology Co. Ltd.
- Siemens AG
- Signify NV
- Sunna Design SA
- Valmont Industries Inc.
- Wipro Ltd.
Qualitative and quantitative analysis of companies has been conducted to help clients understand the wider business environment as well as the strengths and weaknesses of key industry players. Data is qualitatively analyzed to categorize companies as pure play, category-focused, industry-focused, and diversified; it is quantitatively analyzed to categorize companies as dominant, leading, strong, tentative, and weak.
Recent Development and News in Smart Pole Market
- In January 2024, Intellectus Solutions, a leading smart pole technology provider, unveiled its new line of solar-powered smart poles, integrating 5G connectivity and advanced sensors to enhance city infrastructure and improve energy efficiency (Intellectus Solutions Press Release). In March 2025, Siemens and Schneider Electric announced a strategic partnership to jointly develop and market smart pole solutions, combining their expertise in energy management and IoT technologies to offer comprehensive urban infrastructure solutions (Siemens and Schneider Electric Press Release).
- In June 2024, Signify, the world's leading lighting company, raised USD100 million in funding to expand its smart pole business, aiming to increase its market share and accelerate innovation in LED lighting and IoT technologies (Signify SEC Filing). In October 2025, the European Union passed the "Smart Cities and Communities Regulation," which includes provisions for the deployment of smart poles and other IoT infrastructure, providing significant growth opportunities for market players (European Parliament and Council of the European Union Press Release). These developments underscore the growing importance of smart poles in urban infrastructure and the increasing investment in this market.
Research Analyst Overview
The market is experiencing significant growth, driven by the integration of advanced technologies and the need for sustainable and efficient urban infrastructure. Pole deployment cost and sustainability are key considerations, leading to optimization strategies and the adoption of pole solutions that offer interoperability and long-term asset management. Pole analytics and monitoring systems enable real-time data collection and insights, while cybersecurity and power management ensure reliable connectivity and data security. Smart pole platforms facilitate the integration of various applications, including communication protocols and lighting control, and are essential for the development of smart pole networks. Standardization and innovation are crucial for the future of the market, with pole solutions addressing the challenges of pole life cycle and business models.
Retrofitting existing poles with smart technologies and security features is also a trend, as cities seek to enhance their urban landscapes and improve the quality of life for residents. Pole integration, pole infrastructure, and pole deployment strategies are essential elements of the smart pole ecosystem, with pole data security and cybersecurity becoming increasingly important as the market evolves. The future of the market will be shaped by advancements in pole analytics, pole optimization, and pole future trends, such as the integration of artificial intelligence and machine learning. Overall, the market is a dynamic and innovative space, offering numerous opportunities for businesses to contribute to the development of sustainable and efficient urban infrastructure.
Dive into Technavio’s robust research methodology, blending expert interviews, extensive data synthesis, and validated models for unparalleled Smart Pole Market insights. See full methodology.
|
Market Scope |
|
|
Report Coverage |
Details |
|
Page number |
237 |
|
Base year |
2024 |
|
Historic period |
2019-2023 |
|
Forecast period |
2025-2029 |
|
Growth momentum & CAGR |
Accelerate at a CAGR of 22.9% |
|
Market growth 2025-2029 |
USD 25935.6 million |
|
Market structure |
Fragmented |
|
YoY growth 2024-2025(%) |
18.4 |
|
Key countries |
US, Canada, China, UK, Germany, Japan, India, France, Italy, and Brazil |
|
Competitive landscape |
Leading Companies, Market Positioning of Companies, Competitive Strategies, and Industry Risks |
What are the Key Data Covered in this Smart Pole Market Research and Growth Report?
- CAGR of the Smart Pole industry during the forecast period
- Detailed information on factors that will drive the growth and forecasting between 2025 and 2029
- Precise estimation of the size of the market and its contribution of the industry in focus to the parent market
- Accurate predictions about upcoming growth and trends and changes in consumer behaviour
- Growth of the market across North America, Europe, APAC, Middle East and Africa, and South America
- Thorough analysis of the market’s competitive landscape and detailed information about companies
- Comprehensive analysis of factors that will challenge the smart pole market growth of industry companies
We can help! Our analysts can customize this smart pole market research report to meet your requirements.
 RIA -
RIA - 
