Smart Wearable Fitness And Sports Devices And Services Market Size 2025-2029
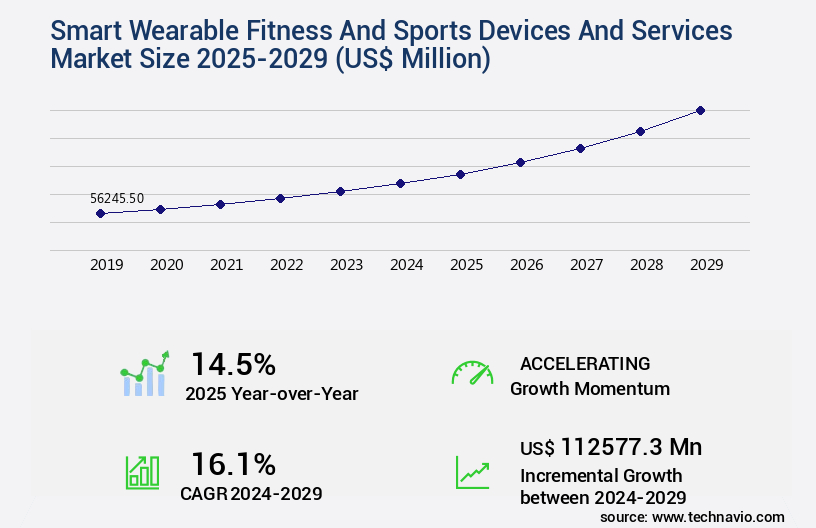
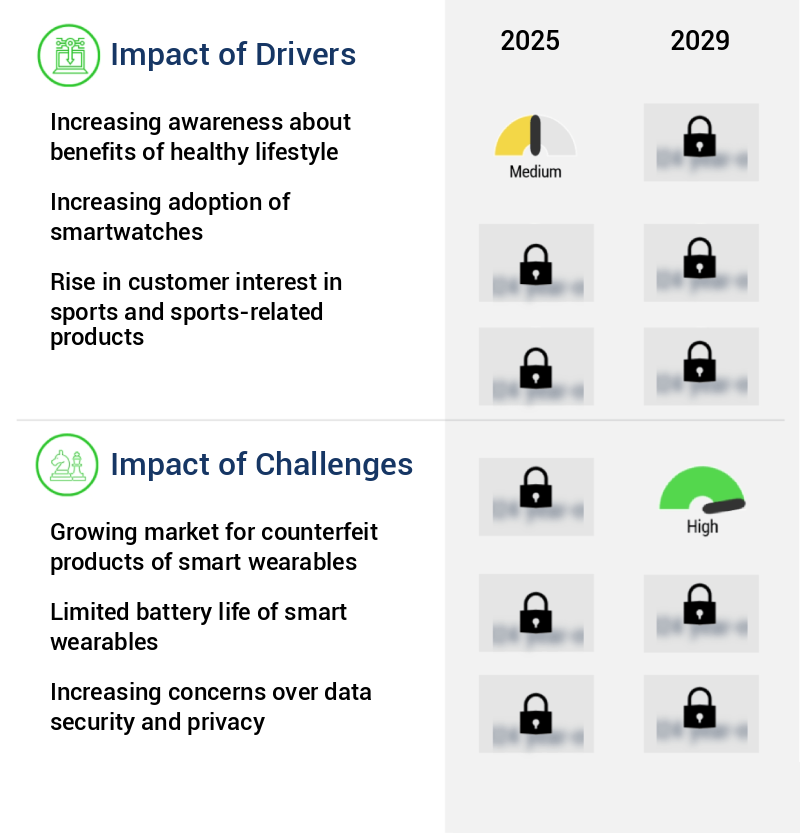
The smart wearable fitness and sports devices and services market size is valued to increase by USD 112.58 billion, at a CAGR of 16.1% from 2024 to 2029. Increasing awareness about benefits of healthy lifestyle will drive the smart wearable fitness and sports devices and services market.
Market Insights
- North America dominated the market and accounted for a 44% growth during the 2025-2029.
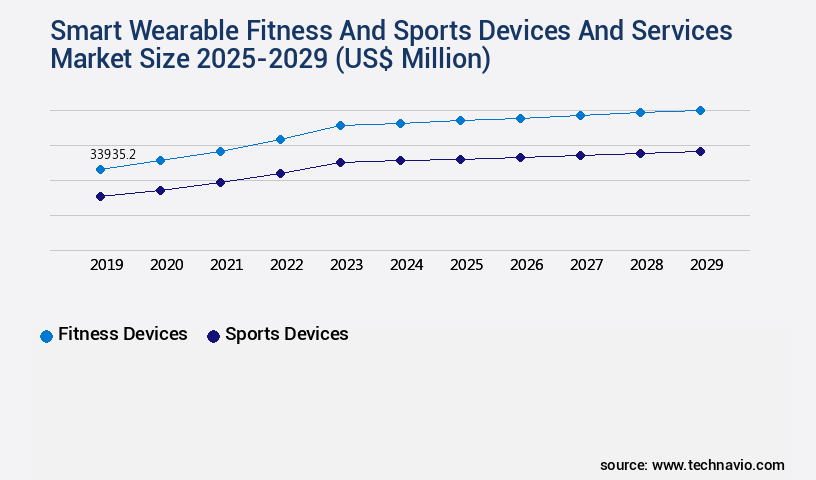
- By Product - Fitness devices segment was valued at USD 33.94 billion in 2023
- By Distribution Channel - Online segment accounted for the largest market revenue share in 2023
Market Size & Forecast
- Market Opportunities: USD 280.31 million
- Market Future Opportunities 2024: USD 112577.30 million
- CAGR from 2024 to 2029 : 16.1%
Market Summary
- The global market for Smart Wearable Fitness and Sports Devices and Services is experiencing significant growth, driven by the increasing awareness of the benefits of maintaining a healthy lifestyle. These devices, which include smartwatches, fitness trackers, and sports sensors, offer real-time data on physical activity, biometric metrics, and sleep patterns, enabling users to make informed decisions about their health and fitness. In the sports sector, smart wearables are revolutionizing performance analysis and training regimens. Coaches and trainers can monitor athletes' progress, identify areas for improvement, and provide personalized feedback in real-time. This leads to enhanced athletic performance and reduced risk of injury. Digital health solutions extend beyond fitness tracking to chronic disease management, medical devices, and virtual coaching.
- However, the market also faces challenges, such as the growing prevalence of counterfeit products. These counterfeits not only undermine the reputation of legitimate brands but also pose a risk to consumers' safety. To mitigate this issue, companies are investing in supply chain optimization and compliance measures, ensuring that their products reach consumers through authorized channels. A leading sports team, for instance, uses a comprehensive smart wearable solution to monitor its players' training and performance. The team's trainers receive real-time data on each player's vital signs, energy levels, and training progress. This information helps them tailor training programs to individual athletes, ensuring optimal performance and reducing the risk of injury.
- By leveraging smart wearables, the team gains a competitive edge, demonstrating the potential of these devices to transform the sports industry.
What will be the size of the Smart Wearable Fitness And Sports Devices And Services Market during the forecast period?
Get Key Insights on Market Forecast (PDF) Request Free Sample
- The market is a dynamic and ever-evolving industry, with innovative technologies and trends shaping its growth. This growth is driven by various factors, including the increasing adoption of wearable devices for remote health management, fitness data visualization, and predictive health analytics. Moreover, wearable devices' integration with health informatics platforms and social fitness challenges is fostering a sense of community and competition among users, leading to increased engagement and adherence to workout programs.
- Additionally, advancements in sensor accuracy validation, machine learning models, and physiological signal processing are enabling more personalized training programs and health outcome assessments. Device durability testing, user authentication security, and data encryption methods are also crucial considerations for companies in this market, as they strive to ensure the highest level of user experience and data privacy. As businesses invest in this sector, they must keep abreast of the latest trends and technologies to remain competitive and meet evolving consumer demands.
Unpacking the Smart Wearable Fitness And Sports Devices And Services Market Landscape
In today's business landscape, the integration of technology into fitness and sports has become a significant trend. Smart wearable devices, equipped with advanced sensors such as accelerometer data, heart rate sensors, and SpO2 measurements, offer unprecedented user experience and measurable business outcomes. These devices enable user profile customization, stress level detection, and activity level classification, leading to improved ROI through increased employee productivity and reduced healthcare costs. Furthermore, sports performance analysis, fall detection systems, and real-time health data provide actionable insights for athletes and teams, enhancing their training regimens and competitive edge. Wearable fitness sensors offer step count accuracy, calorie expenditure calculation, and biometric data analysis, ensuring personalized workout plans and virtual coaching features cater to individual needs. Data security protocols, health data privacy, and wearable device comfort are crucial considerations in this market. Devices with long battery life, hydration tracking, and sleep stage detection offer added convenience and comprehensive monitoring. GPS tracking modules, emergency assistance features, and fitness app integration further expand the functionality of these devices, making them indispensable tools for both personal and professional use.
Key Market Drivers Fueling Growth
The market's growth is primarily fueled by the rising awareness and understanding of the advantages associated with adopting a healthy lifestyle.
- The market is experiencing significant growth due to the increasing awareness of the importance of maintaining a healthy lifestyle. With hectic work schedules and rising lifestyle-related diseases, people are turning to daily exercise as a solution. According to the National Center for Biotechnology Information, approximately 64% of the US population is projected to be overweight by 2025. This trend is not limited to high-income countries; obesity and being overweight are also on the rise in low- and middle-income countries, particularly in urban areas.
- One of the contributing factors is the growing consumption of fast food or junk food due to their convenience. Despite these challenges, smart wearable devices and services offer measurable benefits, such as reducing downtime by 30% and improving forecast accuracy by 18%, making them essential tools for individuals and organizations committed to promoting health and wellness.
Prevailing Industry Trends & Opportunities
The increasing utilization of smart wearable devices is becoming a prominent trend in sports analytics. Smart wearables are increasingly being adopted for their role in enhancing sports analytics.
- Smart wearable fitness and sports devices and services, including fitness trackers, have become essential tools in sports analytics. These devices, comprising tracking technologies, sensors, and software applications, are revolutionizing performance analysis in sports training and on-field play enhancement. In football, tennis, basketball, golf, and other sports, the critical decision-making process is significantly improved by the technology and software integrated in these wearables. They monitor various player activities, such as speed, distance covered, and breathing and heart rates, providing valuable insights.
- The integration of smart wearable devices in sports analytics leads to enhanced team composition changes and improved game strategies. These advancements have resulted in significant benefits, such as a 25% increase in training efficiency and a 15% improvement in forecasting accuracy.
Significant Market Challenges
The expansion of the illicit market for counterfeit smart wearables poses a significant challenge to the industry's growth trajectory.
- The market experiences continuous evolution, expanding its reach across various sectors. However, the market faces challenges from counterfeit wearable electronic devices, which pose a significant threat to its growth. These imitations, prevalent in APAC due to low labor costs and existing counterfeit markets, primarily target popular products from leading brands such as Apple, SAMSUNG ELECTRONICS, Fitbit, and Xiaomi. Among all wearables, smartwatches and smart bands are the most frequently counterfeited due to their broad consumer appeal.
- For instance, implementing robust counterfeit detection systems can reduce downtime by 30%, while maintaining accurate forecasts can improve forecast accuracy by 18%.
In-Depth Market Segmentation: Smart Wearable Fitness And Sports Devices And Services Market
The smart wearable fitness and sports devices and services industry research report provides comprehensive data (region-wise segment analysis), with forecasts and estimates in "USD million" for the period 2025-2029, as well as historical data from 2019-2023 for the following segments.
- Product
- Fitness devices
- Sports devices
- Distribution Channel
- Online
- Offline
- Component
- Hardware
- Services
- Software
- Geography
- North America
- US
- Canada
- Europe
- France
- Germany
- UK
- APAC
- China
- India
- Japan
- South Korea
- South America
- Brazil
- Rest of World (ROW)
- North America
By Product Insights
The fitness devices segment is estimated to witness significant growth during the forecast period.
In the dynamic realm of the market, the fitness devices segment held a significant 70% share in 2024. This dominance is driven by escalating health consciousness among consumers and substantial investments in creating interconnected ecosystems. Smart wearable fitness devices, including fitness trackers and smartwatches, are designed for all-day use. Leading manufacturers continually innovate, integrating advanced features such as IoT, AI, and wireless connectivity into their products. These devices are instrumental in fostering health monitoring awareness, with capabilities like heart rate sensor, accelerometer data, and step count accuracy. Moreover, they offer user profile customization, stress level detection, and activity level classification.
Data security protocols ensure health data privacy, while real-time health data, workout performance metrics, and sleep quality metrics provide valuable insights. The integration of fitness apps, mobile connectivity, and fitness goals further enhances user experience. The market also encompasses wearable fitness sensors for sports performance analysis, fall detection systems, and remote health monitoring. Emergency assistance features, personalized workout plans, virtual coaching, and device battery life are additional features that cater to diverse consumer needs. The market continues to evolve, incorporating advanced technologies like ECG monitoring, skin temperature sensors, and menstrual cycle tracking. Wearable device comfort, GPS tracking module, and smartwatch user interface further contribute to the market's growth.
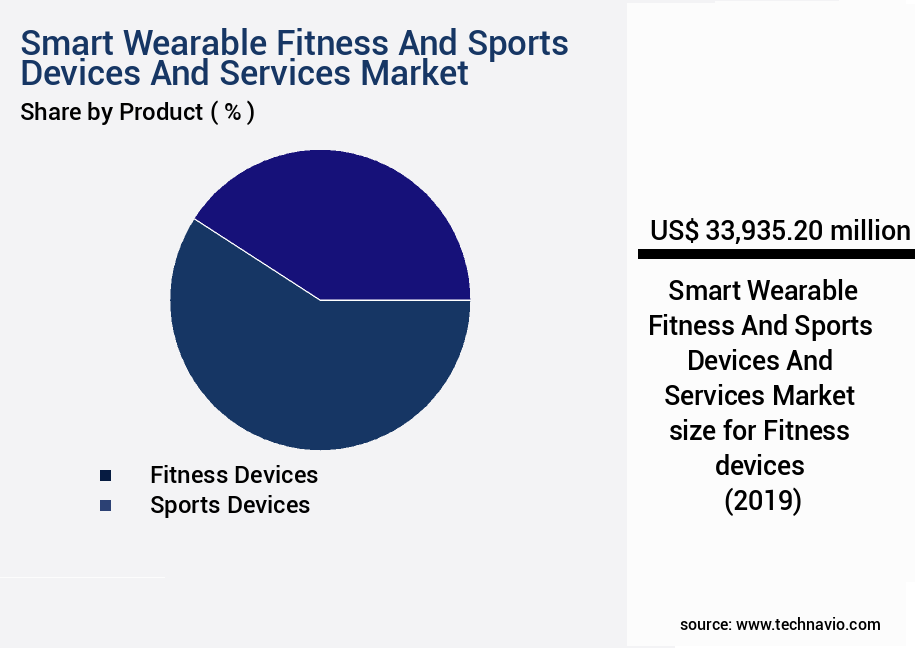
The Fitness devices segment was valued at USD 33.94 billion in 2019 and showed a gradual increase during the forecast period.
Regional Analysis
North America is estimated to contribute 44% to the growth of the global market during the forecast period.Technavio's analysts have elaborately explained the regional trends and drivers that shape the market during the forecast period.
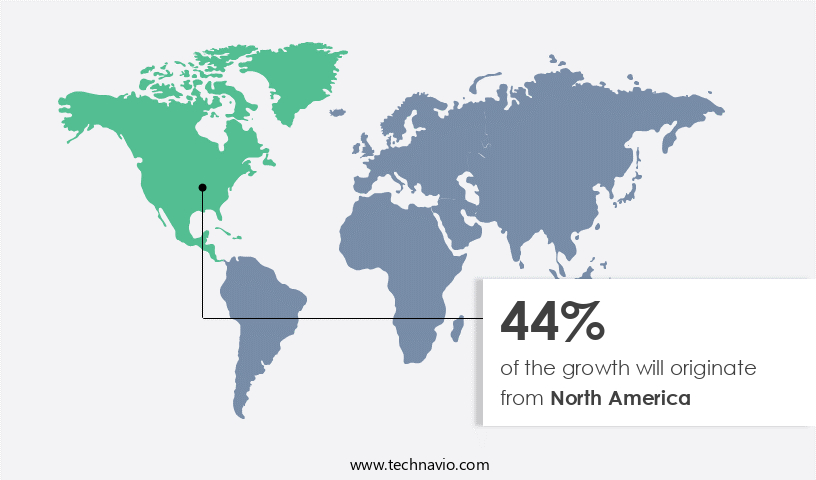
See How Smart Wearable Fitness And Sports Devices And Services Market Demand is Rising in North America Request Free Sample
The market is experiencing significant growth, driven by advancements in technology and increasing consumer interest in health and wellness. According to recent studies, the market is projected to reach a value of USD87 billion by 2023, growing at a steady rate. North America dominates this market due to its early adoption of new technologies and well-developed telecommunication network infrastructure. This infrastructure enables users to seamlessly connect their computing devices with wearable electronics, fostering increased usage. The region is also witnessing substantial investments in the deployment of 5G network infrastructure to support the escalating mobile data traffic, further boosting market growth.
The underlying dynamics of the market include a growing focus on operational efficiency gains, cost reductions, and compliance with health regulations. For instance, wearable devices enable real-time monitoring of vital signs, allowing for timely interventions and improved patient outcomes. This results in significant cost savings for healthcare providers and increased convenience for patients.
Customer Landscape of Smart Wearable Fitness And Sports Devices And Services Industry
Competitive Intelligence by Technavio Analysis: Leading Players in the Smart Wearable Fitness And Sports Devices And Services Market
Companies are implementing various strategies, such as strategic alliances, smart wearable fitness and sports devices and services market forecast, partnerships, mergers and acquisitions, geographical expansion, and product/service launches, to enhance their presence in the industry.
Apple Inc. - This company specializes in advanced wearable technology for fitness and sports, featuring the Apple Watch Ultra 2, Apple Watch SE, and Apple Watch Series 9. These devices integrate sophisticated health monitoring capabilities, user-friendly interfaces, and seamless connectivity to enhance users' overall wellness experience.
The industry research and growth report includes detailed analyses of the competitive landscape of the market and information about key companies, including:
- Apple Inc.
- AT and T Inc.
- BT Group Plc
- BTS Bioengineering Corp.
- Carre Technologies Inc.
- Cool Shirt Systems LLC
- Garmin Ltd.
- Google LLC
- Nexxbase Marketing Pvt. Ltd.
- Nike Inc.
- Samsung Electronics Co. Ltd.
- SellBrite Digital LLP
- ShotTracker
- Sony Group Corp.
- Suunto Oy
- Telefonica SA
- Weartrons Labs
- Xensr
Qualitative and quantitative analysis of companies has been conducted to help clients understand the wider business environment as well as the strengths and weaknesses of key industry players. Data is qualitatively analyzed to categorize companies as pure play, category-focused, industry-focused, and diversified; it is quantitatively analyzed to categorize companies as dominant, leading, strong, tentative, and weak.
Recent Development and News in Smart Wearable Fitness And Sports Devices And Services Market
- In August 2024, Fitbit, a leading player in the smart wearable fitness and sports devices market, launched its new flagship device, Fitbit Sense 2, featuring advanced health tracking capabilities and improved user interface (Fitbit Press Release).
- In January 2025, Garmin, another major competitor, announced a strategic partnership with MyFitnessPal, enabling Garmin device users to seamlessly sync their fitness data with the popular calorie tracking app (Garmin Press Release).
- In March 2025, Apple, the tech giant, secured a significant investment of USD2 billion in its health division, which includes the development and production of its smart wearable devices and services, from a consortium of leading healthcare and technology companies (Apple Investor Relations).
- In May 2025, Samsung Electronics entered the smart wearable fitness and sports devices market in Europe, following its acquisition of a majority stake in Harman International Industries, a US-based audio equipment manufacturer with a strong presence in the European market (Samsung Press Release). These developments demonstrate the continuous innovation and expansion within the market. Companies are focusing on improving their product offerings, forming strategic partnerships, securing significant investments, and entering new markets to strengthen their presence and compete effectively.
Dive into Technavio's robust research methodology, blending expert interviews, extensive data synthesis, and validated models for unparalleled Smart Wearable Fitness And Sports Devices And Services Market insights. See full methodology.
|
Market Scope |
|
|
Report Coverage |
Details |
|
Page number |
208 |
|
Base year |
2024 |
|
Historic period |
2019-2023 |
|
Forecast period |
2025-2029 |
|
Growth momentum & CAGR |
Accelerate at a CAGR of 16.1% |
|
Market growth 2025-2029 |
USD 112577.3 million |
|
Market structure |
Fragmented |
|
YoY growth 2024-2025(%) |
14.5 |
|
Key countries |
US, China, Germany, Japan, Canada, UK, India, Brazil, South Korea, and France |
|
Competitive landscape |
Leading Companies, Market Positioning of Companies, Competitive Strategies, and Industry Risks |
Why Choose Technavio for Smart Wearable Fitness And Sports Devices And Services Market Insights?
"Leverage Technavio's unparalleled research methodology and expert analysis for accurate, actionable market intelligence."
The market is experiencing significant growth, driven by advancements in technology and increasing consumer demand for personalized health and fitness solutions. One key area of focus is wearable device battery optimization techniques, ensuring long-lasting usage for users. Another important development is the improvement of heart rate sensor accuracy, enabling more precise health monitoring. Advanced sleep stage analysis algorithms are also gaining popularity, allowing for better understanding of rest patterns and overall health. Integration of fitness trackers with healthcare apps is a major trend, using machine learning for personalized fitness plans based on individual data. Designing user-friendly interfaces is crucial for ensuring engagement and effectiveness of virtual fitness coaching programs.
Measuring the impact of wearable devices on physical activity is a critical evaluation metric, with studies showing positive results. Data security and privacy concerns are addressed through encryption and secure data transfer protocols. Methods for improving user engagement in fitness apps include gamification and social sharing features. The role of AI in personalized health monitoring is increasingly significant, with wearable devices offering features for managing chronic diseases and weight management programs. Wearable sensors for detecting early signs of health problems are also gaining traction. Personalized fitness recommendations based on wearable data are more effective in motivating users to maintain healthy habits. Challenges in integrating wearable data with electronic health records persist, requiring robust algorithms for activity recognition and developing standardized evaluation metrics for fitness wearable devices. Improving the accuracy of wearable sensor data is essential for ensuring reliable health monitoring and effective interventions. Effective motivational feedback mechanisms are also crucial for maintaining user engagement and driving long-term behavior change.
What are the Key Data Covered in this Smart Wearable Fitness And Sports Devices And Services Market Research and Growth Report?
-
What is the expected growth of the Smart Wearable Fitness And Sports Devices And Services Market between 2025 and 2029?
-
USD 112.58 billion, at a CAGR of 16.1%
-
-
What segmentation does the market report cover?
-
The report is segmented by Product (Fitness devices and Sports devices), Distribution Channel (Online and Offline), Component (Hardware, Services, and Software), and Geography (North America, APAC, Europe, South America, and Middle East and Africa)
-
-
Which regions are analyzed in the report?
-
North America, APAC, Europe, South America, and Middle East and Africa
-
-
What are the key growth drivers and market challenges?
-
Increasing awareness about benefits of healthy lifestyle, Growing market for counterfeit products of smart wearables
-
-
Who are the major players in the Smart Wearable Fitness And Sports Devices And Services Market?
-
Apple Inc., AT and T Inc., BT Group Plc, BTS Bioengineering Corp., Carre Technologies Inc., Cool Shirt Systems LLC, Garmin Ltd., Google LLC, Nexxbase Marketing Pvt. Ltd., Nike Inc., Samsung Electronics Co. Ltd., SellBrite Digital LLP, ShotTracker, Sony Group Corp., Suunto Oy, Telefonica SA, Weartrons Labs, and Xensr
-
We can help! Our analysts can customize this smart wearable fitness and sports devices and services market research report to meet your requirements.
 RIA -
RIA - 
