
Socially Stigmatized Diseases Market Size 2024-2028
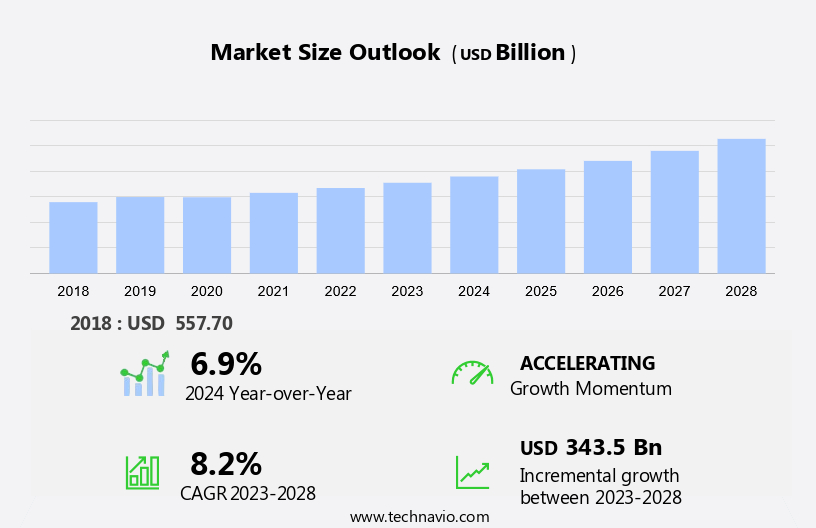
The socially stigmatized diseases market size is forecast to increase by USD 343.5 billion, at a CAGR of 8.2% between 2023 and 2028.
- The market is experiencing significant growth due to several key factors. One of the primary drivers is the high prevalence of diseases such as HIV and AIDS, which necessitates the development of effective treatments and delivery routes. Another trend is the increasing availability of medication for these diseases online, making it more accessible to those who may face social stigma or geographical barriers. However, there are also challenges that must be addressed, including bottlenecks in the supply chain and the persistent social stigma surrounding these diseases, which can hinder access to healthcare and treatment. To address these challenges, it is essential to focus on improving delivery routes and addressing the root causes of social stigma. By doing so, we can ensure that those in need have access to the care and treatment they require, ultimately leading to better health outcomes and a reduced burden on healthcare systems.
What will be the Size of the Market During the Forecast Period?
- The market encompasses a range of health conditions that carry a significant social stigma, often leading to discrimination and marginalization. Effective data management and real-time analytics are crucial for understanding the dynamics of these diseases, improving public health interventions, and mitigating their societal impact. Data management in the market faces unique challenges. The lack of standardization in data collection, storage, and sharing across various industries and sectors hampers comprehensive disease surveillance and response efforts. Moreover, the sensitive nature of medical information associated with these diseases necessitates strong data security measures. Graph databases and property graph models offer promising solutions to address these challenges. Graph databases enable efficient handling of complex relationships between vertices (nodes) and edges (connections) in data. Labels can be assigned to vertices to represent different disease entities, while indexes facilitate rapid data retrieval.
- In the market, long tasks and stored procedures are essential for processing large volumes of data in real-time. Real-time analytics enables logistics professionals in the finance and logistics industries to optimize routes, manage warehouses, and ensure efficient disease surveillance. The finance industry can leverage data modeling and visualization tools to identify patterns and trends in financial transactions related to socially stigmatized diseases. This information can inform investment strategies and risk assessments. In the logistics industry, real-time analytics can optimize supply chain operations and improve response times to disease outbreaks. Data centers and cloud regions play a vital role market by providing secure, scalable, and cost-effective storage solutions. Business processes can be automated using programming ease and visualization tools, enabling more efficient data analysis and decision-making.
How is this market segmented and which is the largest segment?
The market research report provides comprehensive data (region-wise segment analysis), with forecasts and estimates in "USD billion" for the period 2024-2028, as well as historical data from 2018-2022 for the following segments.
- Disease Type
- STIs
- Mental health disorders
- Cancer
- Others
- Therapy
- Medications
- Therapy and counseling
- Others
- Geography
- North America
- Canada
- US
- Europe
- Germany
- UK
- France
- Italy
- Asia
- China
- India
- Japan
- South Korea
- Rest of World (ROW)
- North America
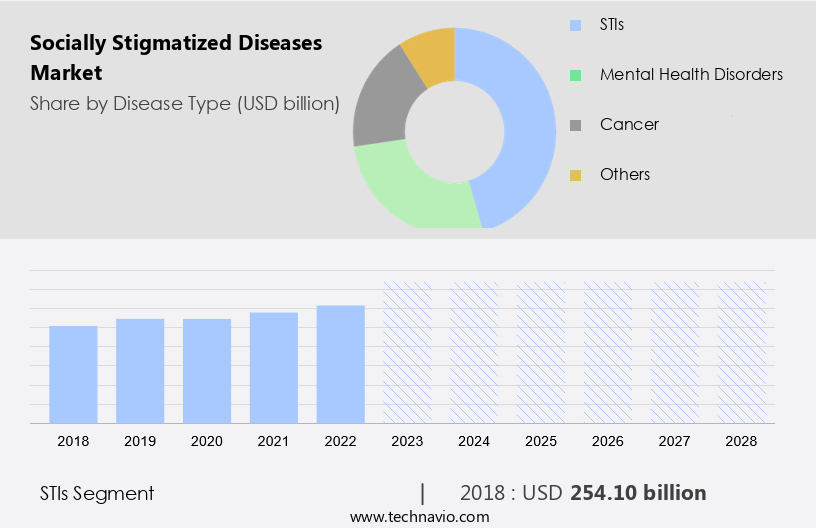
By Disease Type Insights
- The STIs segment is estimated to witness significant growth during the forecast period.
Sexually transmitted infections (STIs), also known as sexually transmitted diseases (STDs), are a significant sector within the global market for socially stigmatized diseases. These infections are contracted through sexual contact, affecting various parts of the body including the mouth, anus, vagina, and penis. STIs encompass a range of conditions, each presenting unique symptoms and health consequences. Common symptoms include discomfort such as burning sensations and itching in the genital area, as well as discharge. In India, as of 2023, the prevalence of STIs is substantial, with around 6% of the adult population reportedly affected by one or more STIs or reproductive tract infections (RTIs). This equates to approximately 30 to 35 million cases annually, underscoring the considerable public health challenge posed by these infections.
Get a glance at the market report of share of various segments Request Free Sample
The STIs segment was valued at USD 254.10 billion in 2018 and showed a gradual increase during the forecast period.
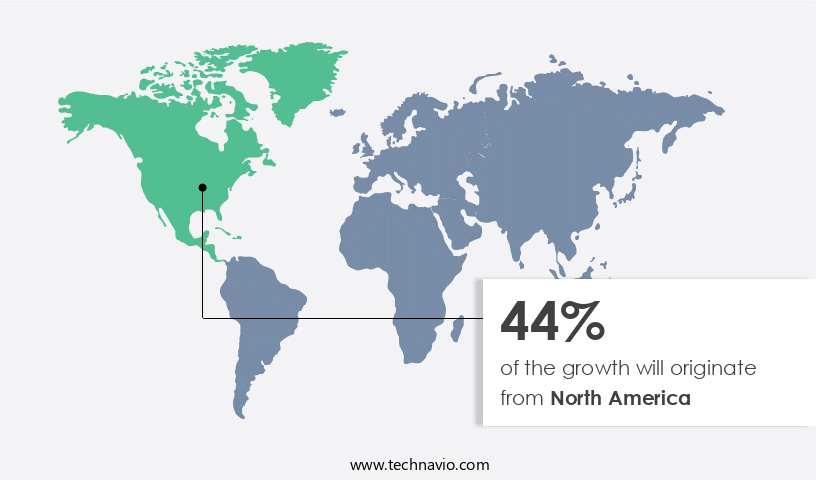
Regional Analysis
- North America is estimated to contribute 44% to the growth of the global market during the forecast period.
Technavio's analysts have elaborately explained the regional trends and drivers that shape the market during the forecast period.
For more insights on the market share of various regions Request Free Sample
In North America, particularly the United States, the market holds substantial importance due to the high incidence and fatalities linked to conditions such as cancer and HIV. According to the Centers for Disease Control and Prevention (CDC), in 2024, the U.S. Reported over 611,000 cancer-related deaths by October, equating to approximately 1,600 deaths daily. This represents an increase from 2022, when 608,366 individuals lost their lives to cancer. These statistics highlight the urgent demand for effective cancer prevention, early detection, and innovative treatment methods. Moreover, advancements in HIV treatment significantly impact the market dynamics in North America. Food and Drug Administration (FDA) for their HIV treatment, underscoring the ongoing efforts to improve disease management and patient outcomes. Medical information and disease surveillance play crucial roles in addressing these health challenges. Route optimization and efficient data management are essential for healthcare providers to ensure timely and accurate diagnosis and treatment. As a result, the market in North America is expected to grow, driven by a combination of increasing disease prevalence, advancements in treatment, and the need for improved healthcare infrastructure.
Market Dynamics
Our researchers analyzed the data with 2023 as the base year, along with the key drivers, trends, and challenges. A holistic analysis of drivers will help companies refine their marketing strategies to gain a competitive advantage.
What are the key market drivers leading to the rise in the adoption of market?
The high prevalence of HIV is the key driver of the market.
- In the United States, an estimated 1.2 million individuals live with socially stigmatized diseases, specifically HIV, as of August 2024 (CDC, 2024). Unfortunately, around 13% of these individuals remain unaware of their infection status, emphasizing the importance of increased testing and early diagnosis (CDC, 2022). According to the Centers for Disease Control and Prevention (CDC), approximately 31,800 new HIV infections were reported in the U.S. In 2022. This ongoing issue underscores the significance of continuous public health initiatives to control the spread of HIV and manage its impact. Logistics professionals play a crucial role in ensuring the timely and efficient distribution of essential medical supplies and medications for socially stigmatized diseases.
- Warehouse management systems and shipment tracking are essential components of this process, ensuring the availability of critical resources for those in need. The United States is home to approximately 1.2 million individuals living with socially stigmatized diseases, primarily HIV, as of August 2024 (CDC, 2024). Regrettably, around 13% of these individuals remain unaware of their infection status, underscoring the importance of increased testing and early diagnosis (CDC, 2022). In 2022, the CDC reported approximately 31,800 new HIV infections in the U.S.
- This ongoing issue highlights the significance of continuous public health initiatives to control the spread of HIV and manage its impact. Logistics professionals play a vital role in ensuring the timely and efficient distribution of essential medical supplies and medications for socially stigmatized diseases. Warehouse management systems and shipment tracking are essential components of this process, ensuring the availability of critical resources for those in need.
What are the market trends shaping the market?
The availability of HIV medication online is the upcoming trend in the market.
- The market, specifically focusing on Human Immunodeficiency Virus (HIV), is experiencing a notable transition towards online medication services. This trend is underscored by the introduction of an online HIV medication program in East Sussex, UK, launched in August 2024. This pilot project aims to distribute preventative PrEP (pre-exposure prophylaxis) medication digitally to individuals at risk of HIV infection, circumventing traditional in-person consultations.
- PrEP, a daily pill that prevents HIV from taking hold within the body, is intended for high-risk individuals due to sexual activity or drug use. Advanced data modelling and analytics tools are being employed to ensure the effective and safe delivery of these services. The shift towards online healthcare for socially stigmatized diseases represents a significant step forward in accessible and confidential care.
What challenges does the market face during the growth?
Social stigma is a key challenge affecting market growth.
- Social stigma continues to pose a significant barrier in the international market for socially stigmatized diseases, with HIV being a notable example. Prejudiced attitudes and beliefs towards individuals diagnosed with HIV result in pervasive stigma, which frequently materializes as discrimination. Discriminatory practices lead to unequal treatment of HIV-positive individuals compared to their healthy counterparts, adversely affecting their overall health and well-being.
- The stigma surrounding HIV can discourage people from accessing essential medical services, such as testing, prevention, and treatment. The fear of judgment and social exclusion keeps many from interacting with healthcare systems, leading to delayed diagnoses and suboptimal health outcomes. This reluctance to seek care perpetuates the cycle of stigma, exacerbating the public health challenge.
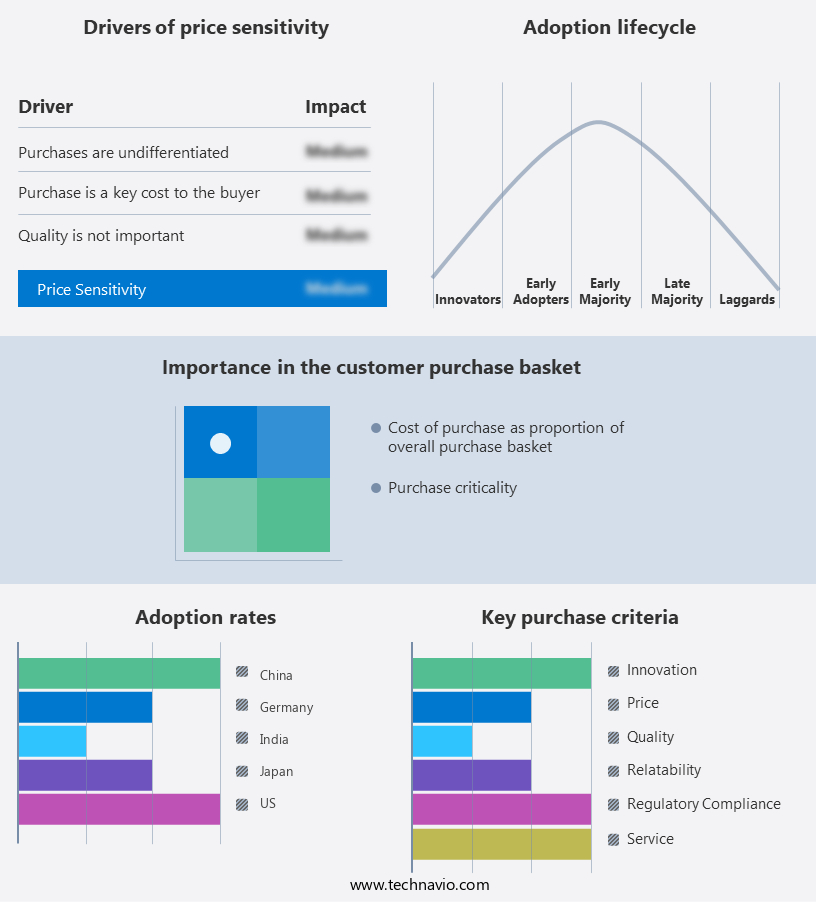
Exclusive Customer Landscape
The market forecasting report includes the adoption lifecycle of the market, covering from the innovator's stage to the laggard's stage. It focuses on adoption rates in different regions based on penetration. Furthermore, the market report also includes key purchase criteria and drivers of price sensitivity to help companies evaluate and develop their market growth analysis strategies.
Customer Landscape
Key Companies & Market Insights
Companies are implementing various strategies, such as strategic alliances, market forecast , partnerships, mergers and acquisitions, geographical expansion, and product/service launches, to enhance their presence in the market.
AbbVie Inc. - The company offers Alinity m STI Assay, which simultaneously detects and differentiates four common STDs like Chlamydia Trachomatis, Neisseria Gonorrhoeae, Trichomonas Vaginalis, and Mycoplasma Genitalium using advanced molecular PCR technology.
The market research and growth report includes detailed analyses of the competitive landscape of the market and information about key companies, including:
- Aurobindo Pharma Ltd.
- Bristol Myers Squibb Co.
- Cipla Inc.
- Dr Reddys Laboratories Ltd.
- F. Hoffmann La Roche Ltd.
- Gilead Sciences Inc.
- GlaxoSmithKline Plc
- Johnson and Johnson Inc.
- Lupin Ltd.
- Merck and Co. Inc.
- Pfizer Inc.
- Sanofi SA
- Sun Pharmaceutical Industries Ltd.
- Viatris Inc.
- ViiV Healthcare
Qualitative and quantitative analysis of companies has been conducted to help clients understand the wider business environment as well as the strengths and weaknesses of key market players. Data is qualitatively analyzed to categorize companies as pure play, category-focused, industry-focused, and diversified; it is quantitatively analyzed to categorize companies as dominant, leading, strong, tentative, and weak.
Research Analyst Overview
The market encompasses various medical conditions that carry a significant social stigma, leading to discrimination and marginalization of affected individuals. These diseases often carry a social taboo, making it challenging for people to seek timely and effective treatment. The market for addressing socially stigmatized diseases is growing due to the increasing awareness and efforts to reduce the social stigma surrounding these conditions. Medical organizations and research institutions play a crucial role in this market by providing accurate medical information and disease surveillance. Big data and real-time analytics are being employed to identify disease outbreaks and monitor their spread, enabling early intervention and effective treatment. In addition, advanced data modeling and analytics tools are used to gain insights into disease patterns and trends, helping to inform public health policies and strategies. Logistics professionals and supply chain organizations are also essential players in the market. They ensure the timely and efficient delivery of medical components and services to healthcare providers, reducing bottlenecks and ensuring uninterrupted access to critical treatments.
Additionally, the use of route optimization and shipment tracking technologies further enhances the efficiency and effectiveness of the supply chain, ensuring that medical supplies reach their intended destinations in a timely and cost-effective manner. Also, the market is experiencing significant growth, driven by innovations in fraud detection and advancements in logistics industry solutions. Think tanks are actively studying the impact of stigma on patients and the healthcare system. This market encompasses various locations, including urban and rural places, where access to treatment can vary. Organizations and health professionals are working together to create awareness and reduce discrimination. Recommendation engines are being used to suggest tailored treatments for patients. A property graph model is being utilized to map connections between individuals, diseases, and societal attitudes. This comprehensive approach is essential for tackling the stigma around diseases, ensuring a supportive environment for affected individuals. These developments highlight the importance of understanding components like social networks in reducing societal discrimination.
|
Market Scope |
|
|
Report Coverage |
Details |
|
Page number |
209 |
|
Base year |
2023 |
|
Historic period |
2018-2022 |
|
Forecast period |
2024-2028 |
|
Growth momentum & CAGR |
Accelerate at a CAGR of 8.2% |
|
Market Growth 2024-2028 |
USD 343.5 billion |
|
Market structure |
Fragmented |
|
YoY growth 2023-2024(%) |
6.9 |
|
Key countries |
US, Germany, UK, Canada, France, China, Japan, India, Italy, and South Korea |
|
Competitive landscape |
Leading Companies, Market Positioning of Companies, Competitive Strategies, and Industry Risks |
What are the Key Data Covered in this Market Research and Growth Report?
- CAGR of the market during the forecast period
- Detailed information on factors that will drive the market growth and forecasting between 2024 and 2028
- Precise estimation of the size of the market and its contribution of the market in focus to the parent market
- Accurate predictions about upcoming market growth and trends and changes in consumer behaviour
- Growth of the market across North America, Europe, Asia, and Rest of World (ROW)
- Thorough analysis of the market's competitive landscape and detailed information about companies
- Comprehensive analysis of factors that will challenge the growth of market companies
We can help! Our analysts can customize this market research report to meet your requirements.
 RIA -
RIA - 
