
Stable Isotope Labeled Biomolecules Market Size 2024-2028
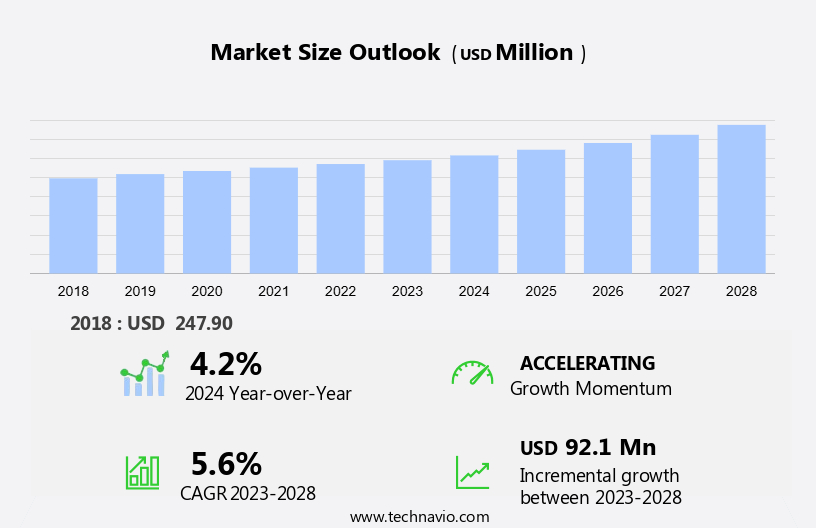
The stable isotope labeled biomolecules market size is forecast to increase by USD 92.1 million at a CAGR of 5.6% between 2023 and 2028.
- The market is experiencing significant growth due to several key trends. The expansion of environmental and ecological research is one such trend, as stable isotopes are increasingly being used to study the carbon cycle, water cycle, and nutrient cycling in various ecosystems. Additionally, the strong drug discovery and development process relies heavily on stable isotopes for tracking metabolic pathways and understanding protein-protein interactions. Additionally, the drug discovery and development sector is driving market growth as stable isotopes are increasingly being used in the production of therapeutic proteins and monoclonal antibodies. However, the high costs of stable isotopes remain a challenge for market growth. Despite this, the market is expected to continue its upward trajectory due to these driving factors. Stable isotopes play a crucial role in various research applications, including metabolic studies, environmental research, and drug discovery, making them an essential tool for scientific advancements.
What will be the Size of the Stable Isotope Labeled Biomolecules Market During the Forecast Period?
- The market encompasses the production and supply of isotopically labeled biomolecules, including proteins, lipids, nucleic acids, metabolites, and other biomolecules, for use in scientific research and the life sciences industry. Isotopic labeling, achieved through techniques such as radiolabeling and isotope-coded affinity tagging, involves the addition of stable isotopes, such as carbon-13, nitrogen-15, oxygen-18, and deuterium, to biomolecules for enhanced detection and analysis. Neutron count variations In these isotopes enable metabolic pathway tracing, structural biology, metabolomics, lipidomics, and medical imaging applications. The market is driven by the increasing demand for carbon neutrality and the need for early cancer diagnosis and metabolism tracking. Custom synthesis services cater to the specific requirements of researchers and industries, ensuring the production of high-purity, isotopically labeled biomolecules.
How is this Stable Isotope Labeled Biomolecules Industry segmented and which is the largest segment?
The stable isotope labeled biomolecules industry research report provides comprehensive data (region-wise segment analysis), with forecasts and estimates in "USD million" for the period 2024-2028, as well as historical data from 2018-2022 for the following segments.
- Type
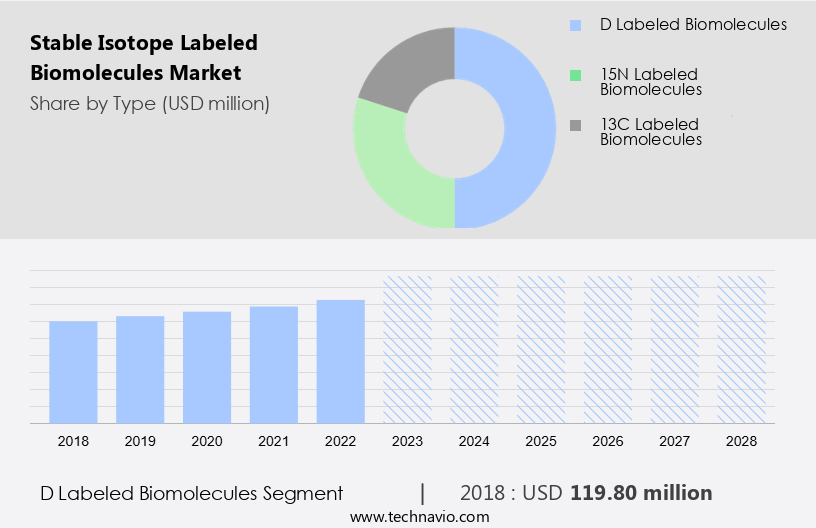
- D labeled biomolecules
- 15N labeled biomolecules
- 13C labeled biomolecules
- End-user
- Scientific research
- Medical
- Geography
- North America
- Canada
- US
- Europe
- Germany
- UK
- Asia
- China
- Rest of World (ROW)
- North America
By Type Insights
- The D labeled biomolecules segment is estimated to witness significant growth during the forecast period.
The market is experiencing notable expansion, primarily In the D labeled biomolecules segment. This growth is attributed to the expanding utilization of deuterium (D) in various sectors, such as pharmaceuticals and semiconductor manufacturing. Deuterated small molecules have emerged as innovative drug leads due to their enhanced metabolic stability and bioavailability, making them valuable in drug synthesis. Pharmaceutical researchers and developers are increasingly turning to D labeled biomolecules to create more effective and long-lasting therapeutic agents. High-throughput analyses, miniaturized labeling systems, and automated microfluidic platforms are driving the advancement of deuteration techniques, enabling the production of increasingly precise and efficient D labeled biomolecules. These trends are fueling demand for D labeled biomolecules in biomedical research, drug development, diagnostics, and chronic disease studies.
Get a glance at the Stable Isotope Labeled Biomolecules Industry report of share of various segments Request Free Sample
The D labeled biomolecules segment was valued at USD 119.80 billion in 2018 and showed a gradual increase during the forecast period.
Regional Analysis
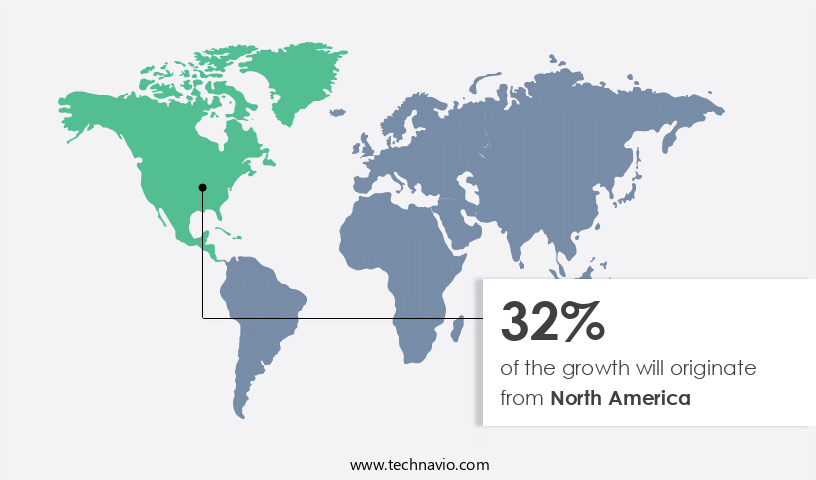
- North America is estimated to contribute 32% to the growth of the global market during the forecast period.
Technavio's analysts have elaborately explained the regional trends and drivers that shape the market during the forecast period.
For more insights on the market share of various regions, Request Free Sample
The market is experiencing notable growth worldwide, with North America being a significant contributor. This expansion is primarily due to substantial investments in research and development, particularly In the field of radiopharmaceuticals. Radioligand therapy, an innovative cancer treatment approach, is driving market growth. In this method, a radioisotope is attached to a targeting molecule, delivering radiation directly to cancer cells while minimizing damage to healthy tissues. Notable programs include PNT20021, targeting prostate-specific membrane antigens for metastatic castration-resistant prostate cancer, and PNT20031, targeting somatostatin receptors for gastroenteropancreatic neuroendocrine tumors. Carbon neutrality is also a growing consideration In the market, with the use of 15N labeled biomolecules and 13C labeled biomolecules gaining popularity. Isotope labeling, using neutron counts, enables metabolic pathways to be traced, providing valuable insights into biological processes.
Market Dynamics
Our stable isotope labeled biomolecules market researchers analyzed the data with 2023 as the base year, along with the key drivers, trends, and challenges. A holistic analysis of drivers will help companies refine their marketing strategies to gain a competitive advantage.
What are the key market drivers leading to the rise In the adoption of Stable Isotope Labeled Biomolecules Industry?
Expansion of environmental and ecological research is the key driver of the market.
- The market is witnessing notable expansion due to the increasing application of isotopic labeling in scientific research across various sectors. Isotopic labeling, utilizing stable isotopes such as Carbon-13, Nitrogen-15, Oxygen-18, and Deuterium, plays a pivotal role in understanding metabolic pathways and molecular interactions. In the life sciences industry, this technology is employed In the production of 15N labeled Biomolecules and 13C labeled Biomolecules for use in structural biology, metabolomics, proteomics, drug discovery, and metabolic processes. Stable isotopes are essential for drug development, medical research, and diagnostics. In the medical field, they are used for metabolism tracking, personalized medicine, precision diagnostics, and early detection of chronic diseases.
- Additionally, high-throughput analyses and miniaturized labeling systems, coupled with automated microfluidic platforms, facilitate efficient and accurate isotopic labeling. The biotech sector leverages stable isotopes for biomarker discovery, clean energy sources, water analysis, and soil analysis. Mass spectrometry, a primary tool for isotopic analysis, enables the detection of protein interactions, drug metabolism, and cancer diagnosis. This technology's ability to trace metabolic processes and molecular pathways makes it indispensable for advancing scientific knowledge and developing innovative solutions.
What are the market trends shaping the Stable Isotope Labeled Biomolecules Industry?
Strong drug discovery and development is the upcoming market trend.
- The market is experiencing notable growth, especially within the scientific research, medical, and industrial sectors of the life sciences industry. Stable isotopes, such as Carbon-13, Nitrogen-15, Oxygen-18, and Deuterium, are utilized for isotopic labeling in various biomolecules, including proteins, lipids, nucleic acids, metabolites, and more. This technique plays a pivotal role in structural biology, metabolomics, proteomics, drug discovery, and metabolic processes, revealing molecular pathways and elucidating protein interactions, drug metabolism, and metabolism tracking. Isotope labeling is essential for biomedical research, drug development, diagnostics, and chronic disease research. For instance, 15N labeled biomolecules and 13C labeled biomolecules are widely used for metabolic studies, enabling high-throughput analyses and miniaturized labeling systems on automated microfluidic platforms.
- In addition, stable isotope labeling is indispensable for personalized medicine and precision diagnostics, contributing to the discovery of biomarkers and early detection of diseases like cancer. Moreover, stable isotope labeling is applied in various industries, such as environmental testing, water analysis, soil analysis, and biomarker discovery. This versatile technology is also employed in clean energy sources and research tools, making it an indispensable asset for numerous applications. Mass spectrometry is a primary tool for the detection and analysis of stable isotope-labeled biomolecules, offering valuable insights into various fields, from metabolism tracking to drug development and medical imaging.
What challenges does the Stable Isotope Labeled Biomolecules Industry face during its growth?
High costs of stable isotopes are a key challenge affecting the industry growth.
- The market is experiencing a notable challenge due to the escalating prices of stable isotopes, such as 13C and 15N, which are essential for various scientific applications, including metabolic pathway analysis, structural biology, and metabolomics. These isotopes, with slightly distinct properties compared to their natural counterparts (12C and 14N), play a pivotal role in scientific research across disciplines, including medical, industrial, and life sciences. The market for stable isotope labeled chemicals has witnessed a substantial price increase of over 200% In the past year. This growth is particularly pronounced In the prices of fundamental stable isotopes, such as 13CO2 and 15NH3, which started to rise In the first half of 2022.
- Similarly, stable isotopes, including Carbon-13, Nitrogen-15, Oxygen-18, and Deuterium, are integral to the production of biomolecules like proteins, lipids, nucleic acids, metabolites, and other molecular structures. They contribute significantly to drug discovery, metabolic processes, molecular pathways, and biotech sector advancements. Moreover, they are instrumental in biomedical research, drug development, diagnostics, and the identification of biomarkers for personalized medicine, precision diagnostics, and early disease detection. High-throughput analyses, miniaturized labeling systems, and automated microfluidic platforms are also driving the demand for stable isotope labeled biomolecules. Applications of stable isotope labeled biomolecules extend beyond scientific research to environmental testing, water analysis, soil analysis, and biomarker discovery in diagnostic centers.
- Thus, the market's growth is further fueled by the increasing interest in clean energy sources and the potential for carbon neutrality. Mass spectrometry, protein interactions, drug metabolism, medical imaging, cancer diagnosis, and metabolism tracking are some of the key areas where stable isotope labeled biomolecules play a crucial role. Custom synthesis is another significant application area, providing researchers with the flexibility to create isotope-labeled compounds tailored to their specific needs.
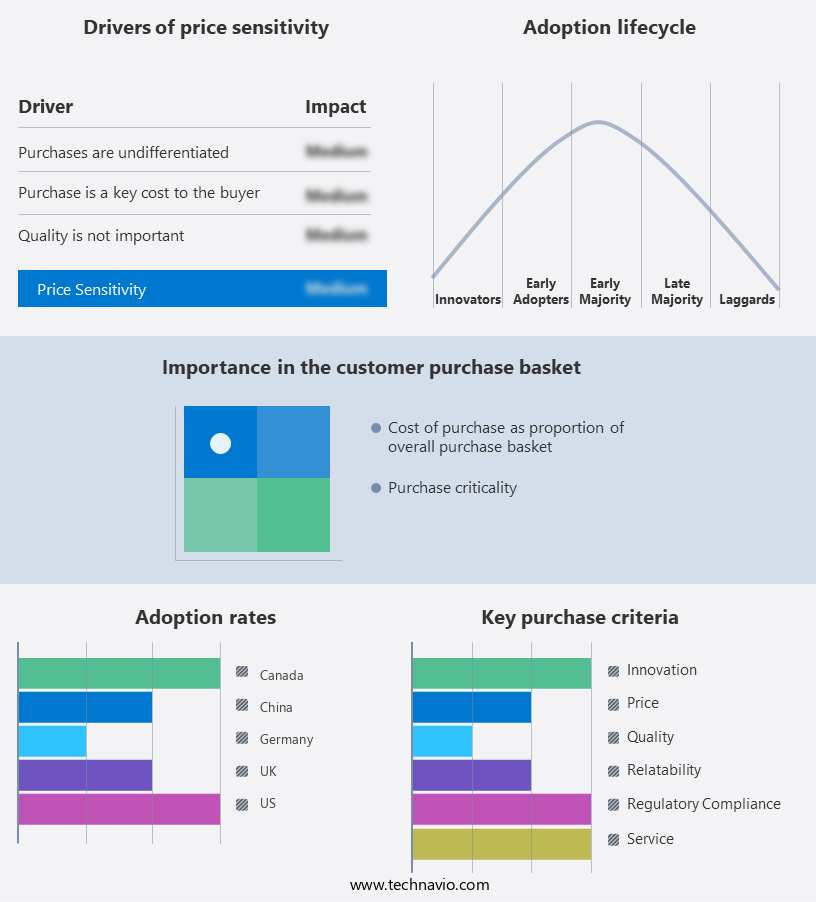
Exclusive Customer Landscape
The stable isotope labeled biomolecules market forecasting report includes the adoption lifecycle of the market, covering from the innovator's stage to the laggard's stage. It focuses on adoption rates in different regions based on penetration. Furthermore, the stable isotope labeled biomolecules market report also includes key purchase criteria and drivers of price sensitivity to help companies evaluate and develop their market growth analysis strategies.
Customer Landscape
Key Companies & Market Insights
Companies are implementing various strategies, such as strategic alliances, stable isotope labeled biomolecules market forecast, partnerships, mergers and acquisitions, geographical expansion, and product/service launches, to enhance their presence In the industry. The industry research and growth report includes detailed analyses of the competitive landscape of the market and information about key companies, including:
- BOCSCI Inc.
- Cambridge Isotope Laboratories Inc
- Entegris Inc.
- Icon Labeling Inc
- ISOFLEX USA
- Isolife BV
- LGC Ltd
- Medical Isotopes Inc
- Oak Ridge National Laboratory
- Omicron Biochemicals Inc
- SAS Alsachim
- Sigma Aldrich Chemicals Pvt Ltd
- Silantes GmbH
- Symeres
- Triad National Security LLC
- Urenco Ltd.
- WITEGA Laboratorien Berlin-Adlershof GmbH
Qualitative and quantitative analysis of companies has been conducted to help clients understand the wider business environment as well as the strengths and weaknesses of key industry players. Data is qualitatively analyzed to categorize companies as pure play, category-focused, industry-focused, and diversified; it is quantitatively analyzed to categorize companies as dominant, leading, strong, tentative, and weak.
Research Analyst Overview
Stable isotope-labeled biomolecules have emerged as essential tools in various fields, including scientific research, medicine, and industry. These biomolecules, which carry isotopes with distinct atomic masses, enable researchers to trace metabolic pathways, study protein-protein interactions, and investigate molecular pathways. Isotopes, such as carbon-13, nitrogen-15, oxygen-18, and deuterium, are naturally occurring variants of elements. When incorporated into biomolecules like proteins, lipids, nucleic acids, metabolites, and other metabolites, they offer valuable insights into their structure, function, and behavior. Isotopic labeling techniques, including radiolabeling and stable isotope labeling, have become indispensable in several research areas. In structural biology, isotope-labeled biomolecules help elucidate protein structures and protein-ligand interactions.
In metabolomics, metabolites labeled with stable isotopes aid in identifying and quantifying metabolic pathways and their intermediates. The life sciences industry, including pharmaceuticals, biotech, and diagnostics, heavily relies on stable isotope labeled biomolecules. In drug discovery, isotopes help trace drug metabolism and pharmacokinetics. In medical research, they contribute to personalized medicine and precision diagnostics by enabling the identification of biomarkers and the development of targeted therapies. High-throughput analyses and miniaturized labeling systems have revolutionized the use of stable isotope labeled biomolecules in research. Automated microfluidic platforms and mass spectrometry have made it possible to analyze large datasets and obtain precise results.
Additionally, the applications of stable isotope labeled biomolecules extend beyond scientific research and medicine. They are also used in industrial processes, environmental testing, and clean energy sources. For instance, in water analysis, isotopes help determine the origin and age of water samples. In soil analysis, they provide insights into nutrient cycling and soil biogeochemistry. The market for stable isotope labeled biomolecules continues to grow as research and development efforts expand in various sectors. The demand for these biomolecules is driven by their ability to offer valuable insights into complex biological systems and processes, enabling advancements in drug development, diagnostics, and other applications.
Thus, stable isotope labeled biomolecules play a crucial role in scientific research, medicine, and industry. They offer unique insights into molecular structures, functions, and processes, enabling advancements in various fields. The market for these biomolecules is expected to continue growing as research and development efforts expand in various sectors.
|
Stable Isotope Labeled Biomolecules Market Scope |
|
|
Report Coverage |
Details |
|
Page number |
202 |
|
Base year |
2023 |
|
Historic period |
2018-2022 |
|
Forecast period |
2024-2028 |
|
Growth momentum & CAGR |
Accelerate at a CAGR of 5.6% |
|
Market growth 2024-2028 |
USD 92.1 million |
|
Market structure |
Fragmented |
|
YoY growth 2023-2024(%) |
4.2 |
|
Key countries |
US, China, UK, Canada, and Germany |
|
Competitive landscape |
Leading Companies, Market Positioning of Companies, Competitive Strategies, and Industry Risks |
What are the Key Data Covered in this Stable Isotope Labeled Biomolecules Market Research and Growth Report?
- CAGR of the Stable Isotope Labeled Biomolecules industry during the forecast period
- Detailed information on factors that will drive the Stable Isotope Labeled Biomolecules growth and forecasting between 2024 and 2028
- Precise estimation of the size of the market and its contribution of the industry in focus to the parent market
- Accurate predictions about upcoming growth and trends and changes in consumer behaviour
- Growth of the market across North America, Europe, Asia, and Rest of World (ROW)
- Thorough analysis of the market's competitive landscape and detailed information about companies
- Comprehensive analysis of factors that will challenge the stable isotope labeled biomolecules market growth of industry companies
We can help! Our analysts can customize this stable isotope labeled biomolecules market research report to meet your requirements.
 RIA -
RIA - 
