Subscription Based Gaming Market Analysis APAC, North America, Europe, South America, Middle East and Africa - US, China, Japan, South Korea, Germany - Size and Forecast 2024-2028

Subscription Based Gaming Market Analysis APAC, North America, Europe, South America, Middle East and Africa - US, China, Japan, South Korea, Germany - Size and Forecast 2024-2028

Published: Jan 2024 179 Pages SKU: IRTNTR75302

Market Overview at a Glance

$7.79 B
Market Opportunity
12.17%
CAGR
11.03
YoY growth 2023-2024(%)

Subscription Based Gaming Market Size 2024-2028 

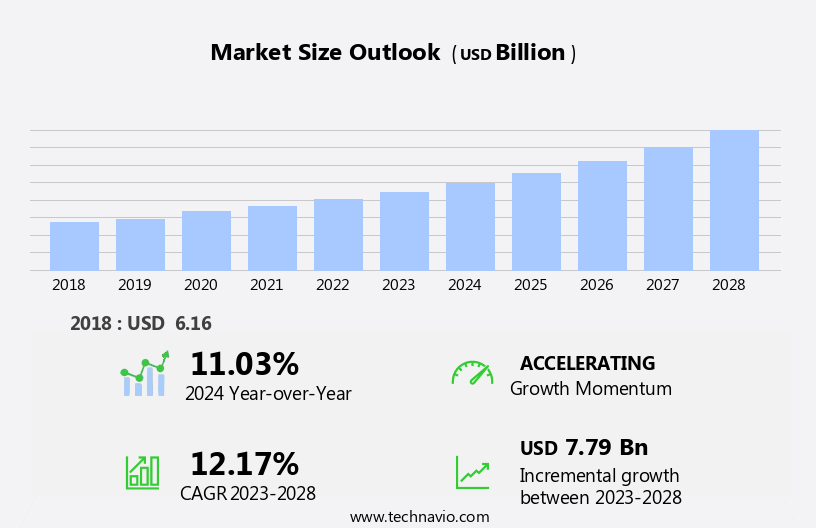
The subscription based gaming market size is forecast to increase by USD 7.79 billion at a CAGR of 12.17% between 2023 and 2028.

  • The market is experiencing significant growth, driven by the enhanced features of next-generation gaming consoles and the emergence of mobile cloud video gaming. The advanced functionalities of new gaming consoles, such as high-definition graphics, seamless connectivity, and great gaming experiences, are compelling gamers to opt for subscription models. Additionally, mobile cloud gaming is gaining popularity, enabling users to access games on-demand without the need for high-end hardware or installation. However, the market faces challenges, including the impact of piracy on subscription-based gaming. Piracy continues to be a major concern, with unauthorized access to games and services posing a significant threat to revenue growth. Despite these challenges, the market is expected to grow at a strong pace, driven by the shifting consumer preferences toward flexible and affordable gaming options.

What will be the Size of the Subscription Based Gaming Market During the Forecast Period?

Subscription Based Gaming Market Size

 Request Free Sample

  • Subscription-based gaming services have gained significant traction In the global market, offering consumers a new way to access and engage with their favorite games. These services, which require a monthly fee, provide additional benefits beyond the game itself, such as exclusive content, discounts, and community features. Gaming consoles and PCs are popular platforms for subscription-based gaming, with augmented reality (AR) and virtual reality (VR) emerging as new frontiers. The pandemic has accelerated the shift towards subscription models, as more people seek out leisure activities at home. The subscription economy has expanded beyond traditional gaming platforms, with Twitch and cloud-based gaming solutions offering new avenues for engagement.
  • AR, VR, and IoT technologies are also influencing the market, while AI and machine learning are enhancing the gaming experience. Smartphone penetration and internet access have expanded the reach of subscription games to mobile gamers, who can now access high-end gaming experiences on their devices. The action and adventure genres continue to dominate the subscription gaming landscape, with microtransactions and paid downloads complementing the subscription model.

How is this Subscription Based Gaming Industry segmented and which is the largest segment?

The subscription based gaming industry research report provides comprehensive data (region-wise segment analysis), with forecasts and estimates in "USD billion" for the period 2024-2028, as well as historical data from 2018-2022 for the following segments.

  • Genre
    • Action
    • Adventure
    • Shooting
    • Sports
    • Others
  • Device
    • Smartphones
    • Console
    • PC
  • Geography
    • APAC
      • China
      • Japan
      • South Korea
    • North America
      • US
    • Europe
      • Germany
    • South America
    • Middle East and Africa

By Genre Insights

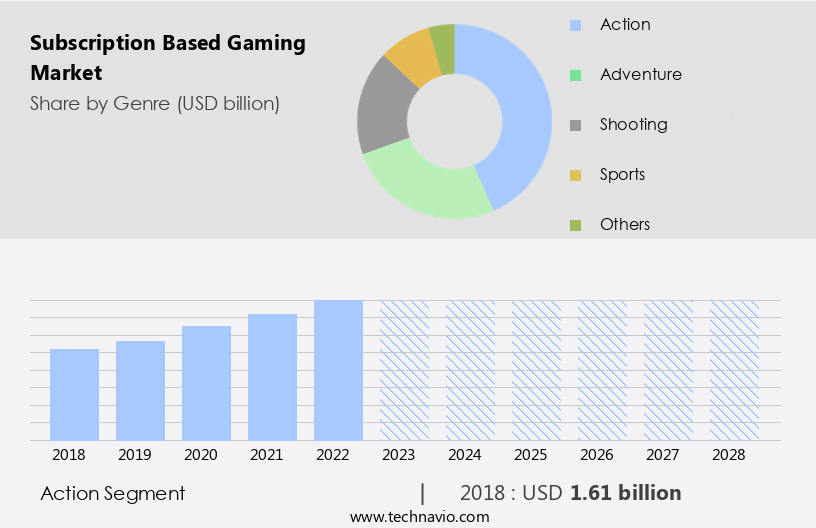
  • The action segment is estimated to witness significant growth during the forecast period.  The action games are packed with thrills, challenges, and entertaining stories that demand to a wide variety of gamers. The thematic element within the action games is driving the growth of the action games segment. Some players are drawn to action games with military themes, such as Battlefield, while others are drawn to fantasy worlds, like Dark Souls, or sci-fi environments, such as Destiny. These thematic differences let developers and marketers target players based on their interests. Thus, the rising adoption of augmented reality and VR in the action genre is a major factor that will fuel the growth of the action segment in the market during the forecast period.

Subscription Based Gaming Market Size

Get a glance at the  Subscription Based Gaming Industry report of share of various segments Request Free Sample

The Action segment was valued at USD 1.61 billion in 2018 and showed a gradual increase during the forecast period.

Regional Analysis

  • APAC is estimated to contribute 42% to the growth of the global market during the forecast period.

Technavio's analysts have elaborately explained the regional trends and drivers that shape the market during the forecast period.

Subscription Based Gaming Market Share by Geography

For more insights on the market share of various regions, Request Free Sample

The Subscription-based Gaming Market in APAC is projected to dominate the global landscape due to the region's expanding middle class, increasing smartphone penetration, and thriving gaming industry. Mobile gaming is a significant contributor to this growth, with major players like Tencent, Sony, and Nintendo leading the charge. companies are collaborating with telecom service providers to introduce cloud-based mobile gaming. The APAC region is home to a vast consumer base of mobile gamers. Key gaming genres include Action, Shooting, Sports, Adventure, Fighting, Role-playing, and Racing, with Action and Role-playing being particularly popular. The market's growth is further fueled by advancements in technologies like Augmented Reality (AR), Virtual Reality (VR), and Artificial Intelligence (AI).

The subscription-based business model offers monthly fees, additional benefits, and access to a vast library of games. The competitive landscape is shaped by key companies such as Google for Games, Microsoft, and Activision Blizzard, offering services like Xbox Cloud Gaming and Call of Duty, Warcraft, Overwatch, Crash Bandicoot, and Guitar Hero. The market's profitability is influenced by factors like device type, game type, and availability on various platforms like smartphones, gaming consoles, and PCs. The COVID-19 pandemic and subsequent lockdown regulations have accelerated the adoption of cloud-based subscription games and competitive games, leading to a rise in demand. The market's growth is also driven by the availability of IoT-enabled devices and high-end smartphones, which facilitate seamless gaming experiences.

SMEs and service providers are also capitalizing on the subscription economy to offer innovative gaming platforms and business models.

Market Dynamics

Our subscription based gaming market researchers analyzed the data with 2023 as the base year, along with the key drivers, trends, and challenges. A holistic analysis of drivers will help companies refine their marketing strategies to gain a competitive advantage.

What are the key market drivers leading to the rise In the adoption of Subscription Based Gaming Industry?

Enhanced features of next-generation gaming consoles is the key driver of the market.

  • The Subscription-based Gaming Market has witnessed significant growth in recent years, with revenue models shifting from paid downloads to monthly fees and additional benefits provided by subscription-based gaming services. This engaged audience trend is observed across various gaming sectors, including Action, Shooting, Sports, Adventure, Fighting, Role-playing, and Racing, on devices such as smartphones, gaming consoles, and PCs. The availability of augmented reality (AR) and virtual reality (VR) games, as well as cloud-based gaming solutions, IoT, and artificial intelligence (AI), have broadened the competitive space In the gaming industry. The COVID-19 pandemic and lockdown regulations have led to a pandemic-driven rise in cloud-based games, with consumers seeking entertainment In their remote work environment and increased leisure time.
  • The subscription economy and gaming platforms have transformed the business models, with companies adopting subscription business models. The competitive market is further fueled by the availability of high-end smartphones, increasing internet access, and the growing popularity of hyper-casual game genres. The prices for subscription-based gaming services vary, with some offering free trials and others charging a monthly fee. SMEs and individual gamers are increasingly adopting these services due to their affordability and convenience.

What are the market trends shaping the Subscription Based Gaming Industry?

The emergence of mobile cloud video gaming is the upcoming market trend.

  • The Subscription-based Gaming Market is experiencing significant growth due to the increasing popularity of cloud gaming services. These services allow users to access and play games hosted on remote servers, which can be streamed through Internet-connected devices. The affordability of subscription-based gaming services is attracting non-core gamers, particularly those who play games on social media and mobile devices. Additional benefits, such as exclusive discounts and early access to new releases, further enhance the value proposition for subscribers. Subscription-based gaming services cater to various gaming sectors, including Action, Shooting, Sports, Adventure, Fighting, Role-playing, and Racing.
  • The Action segment, in particular, is expected to dominate the market due to the high engagement levels of gamers. The availability of cloud-based games on multiple device types, including smartphones, Gaming consoles, and PCs, broadens the reach of subscription-based gaming services. The COVID-19 pandemic and subsequent lockdown regulations have led to an increase in leisure time, driving the demand for subscription-based gaming services. The pandemic's impact on the gaming industry is further accentuated by the rise in remote work environments. As a result, the competitive market for subscription-based gaming services is expected to grow further. Cloud-based gaming solutions are also gaining traction due to the integration of Artificial Intelligence (AI), Augmented Reality (AR), and Virtual Reality (VR) technologies.

What challenges does the Subscription Based Gaming Industry face during its growth?

Impact of piracy on subscription based gaming is a key challenge affecting the industry growth.

  • The Subscription-based Gaming Market is witnessing significant growth, driven by the increasing popularity of monthly fee models and additional benefits offered by subscription-based gaming services. Operators In the gaming sectors are adopting various revenue models, including microtransactions and paid downloads, to cater to the engaged audience. The use of Artificial Intelligence (AI) and the integration of Augmented Reality (AR) and Virtual Reality (VR) technologies are also contributing to the market's growth. Despite the profit potential, the market faces risks, particularly from piracy and the availability of offline games. The COVID-19 pandemic and resulting lockdown regulations have led to a pandemic rise in cloud-based subscription games, as consumers seek new forms of entertainment In their remote work environment.
  • The Service providers are competing in a crowded space, with the Action and Role-playing genres being the most popular among gamers. Smartphone penetration and Internet access have led to an increase in mobile gamers, making it a significant market for subscription-based gaming services. Cloud-based gaming solutions, IoT, and Hardware sales are expected to drive the Subscription Economy further, with Gaming platforms and Subscription business models becoming increasingly popular. The market is highly competitive, with Newzoo estimating a CTR of over 50% for subscription games on Streamlabs, Stream Hatchet, Twitch, and other platforms.

Exclusive Customer Landscape

The market forecasting report includes the adoption lifecycle of the market, covering from the innovator's stage to the laggard's stage. It focuses on adoption rates in different regions based on penetration. Furthermore, the subscription based gaming market report also includes key purchase criteria and drivers of price sensitivity to help companies evaluate and develop their market growth analysis strategies.

Subscription Based Gaming Market Share by Geography

 Customer Landscape

Key Companies & Market Insights

Companies are implementing various strategies, such as strategic alliances, subscription based gaming market forecast, partnerships, mergers and acquisitions, geographical expansion, and product/service launches, to enhance their presence In the industry.

The industry research and growth report includes detailed analyses of the competitive landscape of the market and information about key companies, including:

  • Alphabet Inc.
  • Amazon.com Inc.
  • Apple Inc.
  • BLACKNUT
  • Blade SAS
  • Capcom Co. Ltd.
  • Electronic Arts Inc.
  • Epic Games Inc.
  • Gimzawy
  • Microsoft Corp.
  • NEOM Co.
  • Netflix Inc.
  • Nintendo Co. Ltd.
  • NVIDIA Corp.
  • Roblox Corp.
  • Sony Group Corp.
  • Take Two Interactive Software Inc.
  • Tencent Holdings Ltd.
  • Ubisoft Entertainment SA
  • Ziff Davis Inc.

Qualitative and quantitative analysis of companies has been conducted to help clients understand the wider business environment as well as the strengths and weaknesses of key industry players. Data is qualitatively analyzed to categorize companies as pure play, category-focused, industry-focused, and diversified; it is quantitatively analyzed to categorize companies as dominant, leading, strong, tentative, and weak.

Research Analyst Overview

The subscription-based gaming market has emerged as a significant revenue stream for operators In the gaming industry. This business model allows players to access a library of games for a monthly fee, providing additional benefits beyond the initial purchase price. Subscription-based gaming services have gained traction due to their ability to engage audiences and offer flexibility in game selection. The subscription economy has seen exponential growth, driven by the increasing availability of high-speed internet and the proliferation of smart devices. The gaming sector, in particular, has witnessed a rise in demand for subscription-based services. 

Moreover, the adoption of subscription-based gaming services is influenced by several factors. The gamer's perception of value plays a crucial role in decision-making skills. The convenience of having access to a vast library of games without the need for frequent purchases appeals to many consumers. Additionally, the competitive market dynamics have led to intense price competition among service providers, making subscriptions an attractive option for budget-conscious gamers. The pandemic and resulting lockdown regulations have further accelerated the growth of subscription-based gaming. With remote work environments becoming the norm, individuals have been seeking new ways to fill their leisure time.

Furthermore, subscription games have provided a cost-effective and convenient solution for gamers looking to stay entertained. The gaming industry is witnessing a shift towards cloud-based subscription games, which offer the added benefits of reduced hardware requirements and the ability to play games on multiple devices. The Internet of Things (IoT) has also played a role In the growth of subscription-based gaming, enabling players to access games on smartphones, tablets, and PCs. The competitive space In the subscription-based gaming market is crowded, with key companies offering various pricing models and additional benefits to differentiate themselves. Artificial intelligence (AI) has also emerged as a key trend In the market, with companies leveraging AI to enhance gaming experiences and provide personalized recommendations.

Subscription Based Gaming Market Scope

Report Coverage

Details

Page number

179

Base year

2023

Historic period

2018-2022

Forecast period

2024-2028

Growth momentum & CAGR

Accelerate at a CAGR of 12.17%

Market Growth 2024-2028

USD 7.79 billion

Market structure

Fragmented

YoY growth 2023-2024(%)

11.03

Key countries

US, China, Japan, South Korea, and Germany

Competitive landscape

Leading Companies, Market Positioning of Companies, Competitive Strategies, and Industry Risks

Request Free Sample

What are the Key Data Covered in this Subscription Based Gaming Market Research and Growth Report?

  • CAGR of the Subscription Based Gaming industry during the forecast period
  • Detailed information on factors that will drive the Subscription Based Gaming market growth and forecasting between 2024 and 2028
  • Precise estimation of the size of the market and its contribution of the industry in focus to the parent market
  • Accurate predictions about upcoming growth and trends and changes in consumer behaviour
  • Growth of the market across APAC, North America, Europe, South America, and Middle East and Africa
  • Thorough analysis of the market's competitive landscape and detailed information about companies
  • Comprehensive analysis of factors that will challenge the subscription based gaming market growth of industry companies

We can help! Our analysts can customize this subscription based gaming market research report to meet your requirements.

Get in touch

1 Executive Summary

  • 1.1 Market overview
    • Exhibit 01: Executive Summary – Chart on Market Overview
    • Exhibit 02: Executive Summary – Data Table on Market Overview
    • Exhibit 03: Executive Summary – Chart on Global Market Characteristics
    • Exhibit 04: Executive Summary – Chart on Market by Geography
    • Exhibit 05: Executive Summary – Chart on Market Segmentation by Genre
    • Exhibit 06: Executive Summary – Chart on Market Segmentation by Device
    • Exhibit 07: Executive Summary – Chart on Incremental Growth
    • Exhibit 08: Executive Summary – Data Table on Incremental Growth
    • Exhibit 09: Executive Summary – Chart on Vendor Market Positioning

2 Market Landscape

  • 2.1 Market ecosystem
    • Exhibit 10: Parent market
    • Exhibit 11: Market Characteristics

3 Market Sizing

  • 3.1 Market definition
    • Exhibit 12: Offerings of vendors included in the market definition
  • 3.2 Market segment analysis
    • Exhibit 13: Market segments
  • 3.3 Market size 2023
    • 3.4 Market outlook: Forecast for 2023-2028
      • Exhibit 14: Chart on Global - Market size and forecast 2023-2028 ($ billion)
      • Exhibit 15: Data Table on Global - Market size and forecast 2023-2028 ($ billion)
      • Exhibit 16: Chart on Global Market: Year-over-year growth 2023-2028 (%)
      • Exhibit 17: Data Table on Global Market: Year-over-year growth 2023-2028 (%)

    4 Historic Market Size

    • 4.1 Global subscription based gaming market 2018 - 2022
      • Exhibit 18: Historic Market Size – Data Table on global subscription based gaming market 2018 - 2022 ($ billion)
    • 4.2 Genre Segment Analysis 2018 - 2022
      • Exhibit 19: Historic Market Size – Genre Segment 2018 - 2022 ($ billion)
    • 4.3 Device Segment Analysis 2018 - 2022
      • Exhibit 20: Historic Market Size – Device Segment 2018 - 2022 ($ billion)
    • 4.4 Geography Segment Analysis 2018 - 2022
      • Exhibit 21: Historic Market Size – Geography Segment 2018 - 2022 ($ billion)
    • 4.5 Country Segment Analysis 2018 - 2022
      • Exhibit 22: Historic Market Size – Country Segment 2018 - 2022 ($ billion)

    5 Five Forces Analysis

    • 5.1 Five forces summary
      • Exhibit 23: Five forces analysis - Comparison between 2023 and 2028
    • 5.2 Bargaining power of buyers
      • Exhibit 24: Chart on Bargaining power of buyers – Impact of key factors 2023 and 2028
    • 5.3 Bargaining power of suppliers
      • Exhibit 25: Bargaining power of suppliers – Impact of key factors in 2023 and 2028
    • 5.4 Threat of new entrants
      • Exhibit 26: Threat of new entrants – Impact of key factors in 2023 and 2028
    • 5.5 Threat of substitutes
      • Exhibit 27: Threat of substitutes – Impact of key factors in 2023 and 2028
    • 5.6 Threat of rivalry
      • Exhibit 28: Threat of rivalry – Impact of key factors in 2023 and 2028
    • 5.7 Market condition
      • Exhibit 29: Chart on Market condition - Five forces 2023 and 2028

    6 Market Segmentation by Genre

    • 6.1 Market segments
      • Exhibit 30: Chart on Genre - Market share 2023-2028 (%)
      • Exhibit 31: Data Table on Genre - Market share 2023-2028 (%)
    • 6.2 Comparison by Genre
      • Exhibit 32: Chart on Comparison by Genre
      • Exhibit 33: Data Table on Comparison by Genre
    • 6.3 Action - Market size and forecast 2023-2028
      • Exhibit 34: Chart on Action - Market size and forecast 2023-2028 ($ billion)
      • Exhibit 35: Data Table on Action - Market size and forecast 2023-2028 ($ billion)
      • Exhibit 36: Chart on Action - Year-over-year growth 2023-2028 (%)
      • Exhibit 37: Data Table on Action - Year-over-year growth 2023-2028 (%)
    • 6.4 Adventure - Market size and forecast 2023-2028
      • Exhibit 38: Chart on Adventure - Market size and forecast 2023-2028 ($ billion)
      • Exhibit 39: Data Table on Adventure - Market size and forecast 2023-2028 ($ billion)
      • Exhibit 40: Chart on Adventure - Year-over-year growth 2023-2028 (%)
      • Exhibit 41: Data Table on Adventure - Year-over-year growth 2023-2028 (%)
    • 6.5 Shooting - Market size and forecast 2023-2028
      • Exhibit 42: Chart on Shooting - Market size and forecast 2023-2028 ($ billion)
      • Exhibit 43: Data Table on Shooting - Market size and forecast 2023-2028 ($ billion)
      • Exhibit 44: Chart on Shooting - Year-over-year growth 2023-2028 (%)
      • Exhibit 45: Data Table on Shooting - Year-over-year growth 2023-2028 (%)
    • 6.6 Sports - Market size and forecast 2023-2028
      • Exhibit 46: Chart on Sports - Market size and forecast 2023-2028 ($ billion)
      • Exhibit 47: Data Table on Sports - Market size and forecast 2023-2028 ($ billion)
      • Exhibit 48: Chart on Sports - Year-over-year growth 2023-2028 (%)
      • Exhibit 49: Data Table on Sports - Year-over-year growth 2023-2028 (%)
    • 6.7 Others - Market size and forecast 2023-2028
      • Exhibit 50: Chart on Others - Market size and forecast 2023-2028 ($ billion)
      • Exhibit 51: Data Table on Others - Market size and forecast 2023-2028 ($ billion)
      • Exhibit 52: Chart on Others - Year-over-year growth 2023-2028 (%)
      • Exhibit 53: Data Table on Others - Year-over-year growth 2023-2028 (%)
    • 6.8 Market opportunity by Genre
      • Exhibit 54: Market opportunity by Genre ($ billion)
      • Exhibit 55: Data Table on Market opportunity by Genre ($ billion)

    7 Market Segmentation by Device

    • 7.1 Market segments
      • Exhibit 56: Chart on Device - Market share 2023-2028 (%)
      • Exhibit 57: Data Table on Device - Market share 2023-2028 (%)
    • 7.2 Comparison by Device
      • Exhibit 58: Chart on Comparison by Device
      • Exhibit 59: Data Table on Comparison by Device
    • 7.3 Smartphones - Market size and forecast 2023-2028
      • Exhibit 60: Chart on Smartphones - Market size and forecast 2023-2028 ($ billion)
      • Exhibit 61: Data Table on Smartphones - Market size and forecast 2023-2028 ($ billion)
      • Exhibit 62: Chart on Smartphones - Year-over-year growth 2023-2028 (%)
      • Exhibit 63: Data Table on Smartphones - Year-over-year growth 2023-2028 (%)
    • 7.4 Console - Market size and forecast 2023-2028
      • Exhibit 64: Chart on Console - Market size and forecast 2023-2028 ($ billion)
      • Exhibit 65: Data Table on Console - Market size and forecast 2023-2028 ($ billion)
      • Exhibit 66: Chart on Console - Year-over-year growth 2023-2028 (%)
      • Exhibit 67: Data Table on Console - Year-over-year growth 2023-2028 (%)
    • 7.5 PC - Market size and forecast 2023-2028
      • Exhibit 68: Chart on PC - Market size and forecast 2023-2028 ($ billion)
      • Exhibit 69: Data Table on PC - Market size and forecast 2023-2028 ($ billion)
      • Exhibit 70: Chart on PC - Year-over-year growth 2023-2028 (%)
      • Exhibit 71: Data Table on PC - Year-over-year growth 2023-2028 (%)
    • 7.6 Market opportunity by Device
      • Exhibit 72: Market opportunity by Device ($ billion)
      • Exhibit 73: Data Table on Market opportunity by Device ($ billion)

    8 Customer Landscape

    • 8.1 Customer landscape overview
      • Exhibit 74: Analysis of price sensitivity, lifecycle, customer purchase basket, adoption rates, and purchase criteria

    9 Geographic Landscape

    • 9.1 Geographic segmentation
      • Exhibit 75: Chart on Market share by geography 2023-2028 (%)
      • Exhibit 76: Data Table on Market share by geography 2023-2028 (%)
    • 9.2 Geographic comparison
      • Exhibit 77: Chart on Geographic comparison
      • Exhibit 78: Data Table on Geographic comparison
    • 9.3 APAC - Market size and forecast 2023-2028
      • Exhibit 79: Chart on APAC - Market size and forecast 2023-2028 ($ billion)
      • Exhibit 80: Data Table on APAC - Market size and forecast 2023-2028 ($ billion)
      • Exhibit 81: Chart on APAC - Year-over-year growth 2023-2028 (%)
      • Exhibit 82: Data Table on APAC - Year-over-year growth 2023-2028 (%)
    • 9.4 North America - Market size and forecast 2023-2028
      • Exhibit 83: Chart on North America - Market size and forecast 2023-2028 ($ billion)
      • Exhibit 84: Data Table on North America - Market size and forecast 2023-2028 ($ billion)
      • Exhibit 85: Chart on North America - Year-over-year growth 2023-2028 (%)
      • Exhibit 86: Data Table on North America - Year-over-year growth 2023-2028 (%)
    • 9.5 Europe - Market size and forecast 2023-2028
      • Exhibit 87: Chart on Europe - Market size and forecast 2023-2028 ($ billion)
      • Exhibit 88: Data Table on Europe - Market size and forecast 2023-2028 ($ billion)
      • Exhibit 89: Chart on Europe - Year-over-year growth 2023-2028 (%)
      • Exhibit 90: Data Table on Europe - Year-over-year growth 2023-2028 (%)
    • 9.6 South America - Market size and forecast 2023-2028
      • Exhibit 91: Chart on South America - Market size and forecast 2023-2028 ($ billion)
      • Exhibit 92: Data Table on South America - Market size and forecast 2023-2028 ($ billion)
      • Exhibit 93: Chart on South America - Year-over-year growth 2023-2028 (%)
      • Exhibit 94: Data Table on South America - Year-over-year growth 2023-2028 (%)
    • 9.7 Middle East and Africa - Market size and forecast 2023-2028
      • Exhibit 95: Chart on Middle East and Africa - Market size and forecast 2023-2028 ($ billion)
      • Exhibit 96: Data Table on Middle East and Africa - Market size and forecast 2023-2028 ($ billion)
      • Exhibit 97: Chart on Middle East and Africa - Year-over-year growth 2023-2028 (%)
      • Exhibit 98: Data Table on Middle East and Africa - Year-over-year growth 2023-2028 (%)
    • 9.8 US - Market size and forecast 2023-2028
      • Exhibit 99: Chart on US - Market size and forecast 2023-2028 ($ billion)
      • Exhibit 100: Data Table on US - Market size and forecast 2023-2028 ($ billion)
      • Exhibit 101: Chart on US - Year-over-year growth 2023-2028 (%)
      • Exhibit 102: Data Table on US - Year-over-year growth 2023-2028 (%)
    • 9.9 China - Market size and forecast 2023-2028
      • Exhibit 103: Chart on China - Market size and forecast 2023-2028 ($ billion)
      • Exhibit 104: Data Table on China - Market size and forecast 2023-2028 ($ billion)
      • Exhibit 105: Chart on China - Year-over-year growth 2023-2028 (%)
      • Exhibit 106: Data Table on China - Year-over-year growth 2023-2028 (%)
    • 9.10 Japan - Market size and forecast 2023-2028
      • Exhibit 107: Chart on Japan - Market size and forecast 2023-2028 ($ billion)
      • Exhibit 108: Data Table on Japan - Market size and forecast 2023-2028 ($ billion)
      • Exhibit 109: Chart on Japan - Year-over-year growth 2023-2028 (%)
      • Exhibit 110: Data Table on Japan - Year-over-year growth 2023-2028 (%)
    • 9.11 South Korea - Market size and forecast 2023-2028
      • Exhibit 111: Chart on South Korea - Market size and forecast 2023-2028 ($ billion)
      • Exhibit 112: Data Table on South Korea - Market size and forecast 2023-2028 ($ billion)
      • Exhibit 113: Chart on South Korea - Year-over-year growth 2023-2028 (%)
      • Exhibit 114: Data Table on South Korea - Year-over-year growth 2023-2028 (%)
    • 9.12 Germany - Market size and forecast 2023-2028
      • Exhibit 115: Chart on Germany - Market size and forecast 2023-2028 ($ billion)
      • Exhibit 116: Data Table on Germany - Market size and forecast 2023-2028 ($ billion)
      • Exhibit 117: Chart on Germany - Year-over-year growth 2023-2028 (%)
      • Exhibit 118: Data Table on Germany - Year-over-year growth 2023-2028 (%)
    • 9.13 Market opportunity by geography
      • Exhibit 119: Market opportunity by geography ($ billion)
      • Exhibit 120: Data Tables on Market opportunity by geography ($ billion)

    10 Drivers, Challenges, and Trends

    • 10.1 Market drivers
      • 10.2 Market challenges
        • 10.3 Impact of drivers and challenges
          • Exhibit 121: Impact of drivers and challenges in 2023 and 2028
        • 10.4 Market trends

          11 Vendor Landscape

          • 11.1 Overview
            • 11.2 Vendor landscape
              • Exhibit 122: Overview on Criticality of inputs and Factors of differentiation
            • 11.3 Landscape disruption
              • Exhibit 123: Overview on factors of disruption
            • 11.4 Industry risks
              • Exhibit 124: Impact of key risks on business

            12 Vendor Analysis

            • 12.1 Vendors covered
              • Exhibit 125: Vendors covered
            • 12.2 Market positioning of vendors
              • Exhibit 126: Matrix on vendor position and classification
            • 12.3 Alphabet Inc.
              • Exhibit 127: Alphabet Inc. - Overview
              • Exhibit 128: Alphabet Inc. - Business segments
              • Exhibit 129: Alphabet Inc. - Key news
              • Exhibit 130: Alphabet Inc. - Key offerings
              • Exhibit 131: Alphabet Inc. - Segment focus
            • 12.4 Amazon.com Inc.
              • Exhibit 132: Amazon.com Inc. - Overview
              • Exhibit 133: Amazon.com Inc. - Business segments
              • Exhibit 134: Amazon.com Inc. - Key news
              • Exhibit 135: Amazon.com Inc. - Key offerings
              • Exhibit 136: Amazon.com Inc. - Segment focus
            • 12.5 Apple Inc.
              • Exhibit 137: Apple Inc. - Overview
              • Exhibit 138: Apple Inc. - Business segments
              • Exhibit 139: Apple Inc. - Key news
              • Exhibit 140: Apple Inc. - Key offerings
              • Exhibit 141: Apple Inc. - Segment focus
            • 12.6 BLACKNUT
              • Exhibit 142: BLACKNUT - Overview
              • Exhibit 143: BLACKNUT - Product / Service
              • Exhibit 144: BLACKNUT - Key offerings
            • 12.7 Electronic Arts Inc.
              • Exhibit 145: Electronic Arts Inc. - Overview
              • Exhibit 146: Electronic Arts Inc. - Product / Service
              • Exhibit 147: Electronic Arts Inc. - Key offerings
            • 12.8 Microsoft Corp.
              • Exhibit 148: Microsoft Corp. - Overview
              • Exhibit 149: Microsoft Corp. - Business segments
              • Exhibit 150: Microsoft Corp. - Key news
              • Exhibit 151: Microsoft Corp. - Key offerings
              • Exhibit 152: Microsoft Corp. - Segment focus
            • 12.9 Netflix Inc.
              • Exhibit 153: Netflix Inc. - Overview
              • Exhibit 154: Netflix Inc. - Product / Service
              • Exhibit 155: Netflix Inc. - Key offerings
            • 12.10 Nintendo Co. Ltd.
              • Exhibit 156: Nintendo Co. Ltd. - Overview
              • Exhibit 157: Nintendo Co. Ltd. - Product / Service
              • Exhibit 158: Nintendo Co. Ltd. - Key offerings
            • 12.11 NVIDIA Corp.
              • Exhibit 159: NVIDIA Corp. - Overview
              • Exhibit 160: NVIDIA Corp. - Business segments
              • Exhibit 161: NVIDIA Corp. - Key news
              • Exhibit 162: NVIDIA Corp. - Key offerings
              • Exhibit 163: NVIDIA Corp. - Segment focus
            • 12.12 Roblox Corp.
              • Exhibit 164: Roblox Corp. - Overview
              • Exhibit 165: Roblox Corp. - Product / Service
              • Exhibit 166: Roblox Corp. - Key offerings
            • 12.13 Sony Group Corp.
              • Exhibit 167: Sony Group Corp. - Overview
              • Exhibit 168: Sony Group Corp. - Business segments
              • Exhibit 169: Sony Group Corp. - Key news
              • Exhibit 170: Sony Group Corp. - Key offerings
              • Exhibit 171: Sony Group Corp. - Segment focus
            • 12.14 Take Two Interactive Software Inc.
              • Exhibit 172: Take Two Interactive Software Inc. - Overview
              • Exhibit 173: Take Two Interactive Software Inc. - Product / Service
              • Exhibit 174: Take Two Interactive Software Inc. - Key offerings
            • 12.15 Tencent Holdings Ltd.
              • Exhibit 175: Tencent Holdings Ltd. - Overview
              • Exhibit 176: Tencent Holdings Ltd. - Business segments
              • Exhibit 177: Tencent Holdings Ltd. - Key offerings
              • Exhibit 178: Tencent Holdings Ltd. - Segment focus
            • 12.16 Ubisoft Entertainment SA
              • Exhibit 179: Ubisoft Entertainment SA - Overview
              • Exhibit 180: Ubisoft Entertainment SA - Business segments
              • Exhibit 181: Ubisoft Entertainment SA - Key news
              • Exhibit 182: Ubisoft Entertainment SA - Key offerings
              • Exhibit 183: Ubisoft Entertainment SA - Segment focus
            • 12.17 Ziff Davis Inc.
              • Exhibit 184: Ziff Davis Inc. - Overview
              • Exhibit 185: Ziff Davis Inc. - Business segments
              • Exhibit 186: Ziff Davis Inc. - Key offerings
              • Exhibit 187: Ziff Davis Inc. - Segment focus

            13 Appendix

            • 13.1 Scope of the report
              • 13.2 Inclusions and exclusions checklist
                • Exhibit 188: Inclusions checklist
                • Exhibit 189: Exclusions checklist
              • 13.3 Currency conversion rates for US$
                • Exhibit 190: Currency conversion rates for US$
              • 13.4 Research methodology
                • Exhibit 191: Research methodology
                • Exhibit 192: Validation techniques employed for market sizing
                • Exhibit 193: Information sources
              • 13.5 List of abbreviations
                • Exhibit 194: List of abbreviations

              Research Methodology

              Technavio presents a detailed picture of the market by way of study, synthesis, and summation of data from multiple sources. The analysts have presented the various facets of the market with a particular focus on identifying the key industry influencers. The data thus presented is comprehensive, reliable, and the result of extensive research, both primary and secondary.

              INFORMATION SOURCES

              Primary sources

              • Manufacturers and suppliers
              • Channel partners
              • Industry experts
              • Strategic decision makers

              Secondary sources

              • Industry journals and periodicals
              • Government data
              • Financial reports of key industry players
              • Historical data
              • Press releases

              DATA ANALYSIS

              Data Synthesis

              • Collation of data
              • Estimation of key figures
              • Analysis of derived insights

              Data Validation

              • Triangulation with data models
              • Reference against proprietary databases
              • Corroboration with industry experts

              REPORT WRITING

              Qualitative

              • Market drivers
              • Market challenges
              • Market trends
              • Five forces analysis

              Quantitative

              • Market size and forecast
              • Market segmentation
              • Geographical insights
              • Competitive landscape

              Interested in this report?

              Get your sample now to see our research methodology and insights!

              Download Now

              Frequently Asked Questions

              Subscription Based Gaming market growth will increase by $ 7.79 bn during 2024-2028.

              The Subscription Based Gaming market is expected to grow at a CAGR of 12.17% during 2024-2028.

              Subscription Based Gaming market is segmented by Genre( Action, Adventure, Shooting, Sports, Others) Device( Smartphones, Console, PC)

              Alphabet Inc., Amazon.com Inc., Apple Inc., BLACKNUT, Blade SAS, Capcom Co. Ltd., Electronic Arts Inc., Epic Games Inc., Gimzawy, Microsoft Corp., NEOM Co., Netflix Inc., Nintendo Co. Ltd., NVIDIA Corp., Roblox Corp., Sony Group Corp., Take Two Interactive Software Inc., Tencent Holdings Ltd., Ubisoft Entertainment SA, Ziff Davis Inc. are a few of the key vendors in the Subscription Based Gaming market.

              APAC will register the highest growth rate of 42% among the other regions. Therefore, the Subscription Based Gaming market in APAC is expected to garner significant business opportunities for the vendors during the forecast period.

              US, China, Japan, South Korea, Germany

              • Enhanced features of next-generation gaming consolesDespite the fact that an average gamer has used gaming consoles for nearly a decade is the driving factor this market.
              • the next generation of gaming consoles is released every five years (on average). The major reason for this is the increased consumer demands as consumers look forward to enriched audio and visual experiences for gaming. The increasing disposable incomes have made gamers able to afford high-end displays and TV sets. The HD displays is the driving factor this market.
              • along with high-definition multimedia interface (HDMI) and wireless network compatibility is the driving factor this market.
              • have increased the expectations of gamers. These add-ons have increased the availability of gaming as well. Also is the driving factor this market.
              • the penetration of high-end sound systems is the driving factor this market.
              • such as home theatre sound systems is the driving factor this market.
              • provides gamers with a real-life-like gaming experience. With the enhancing features of gaming consoles is the driving factor this market.
              • the global subscription based gaming market is expected to witness high growth during the forecast period. is the driving factor this market.

              The Subscription Based Gaming market vendors should focus on grabbing business opportunities from the Action segment as it accounted for the largest market share in the base year.