Synthetic Aperture Radar (Sar) Market Size 2024-2028
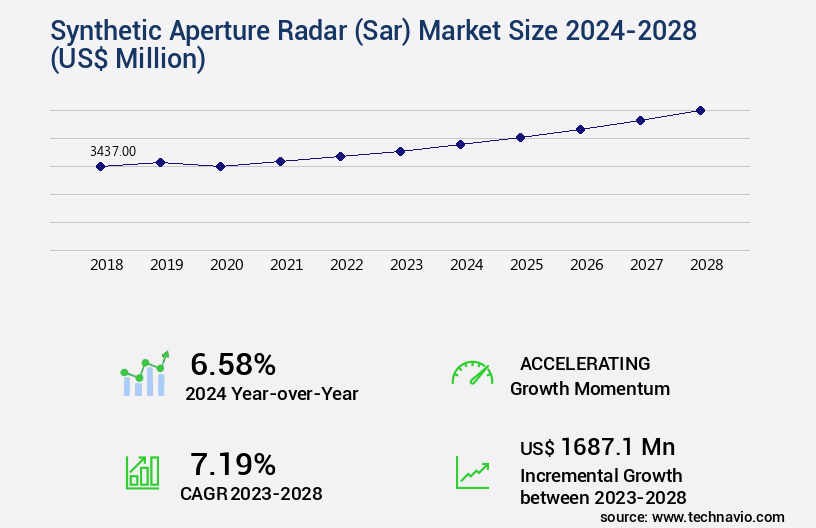
The synthetic aperture radar (sar) market size is valued to increase by USD 1.69 billion, at a CAGR of 7.19% from 2023 to 2028. Increasing investments in surveillance and attack UAVs will drive the synthetic aperture radar (sar) market.
Market Insights
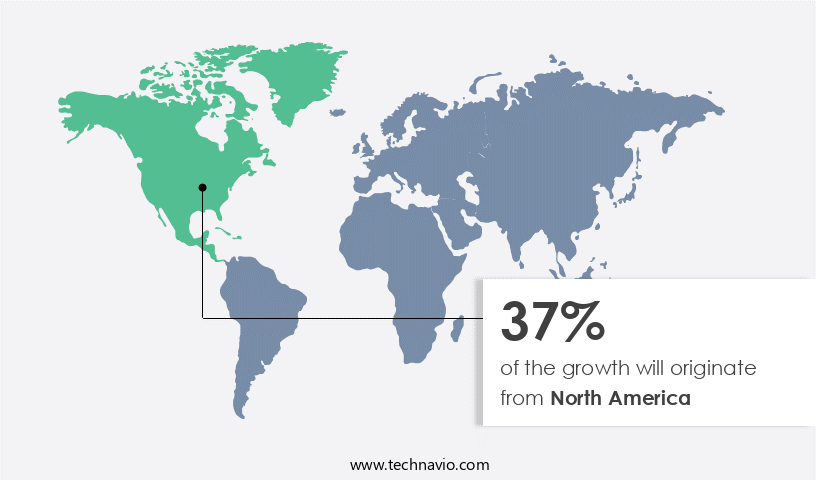
- North America dominated the market and accounted for a 37% growth during the 2024-2028.
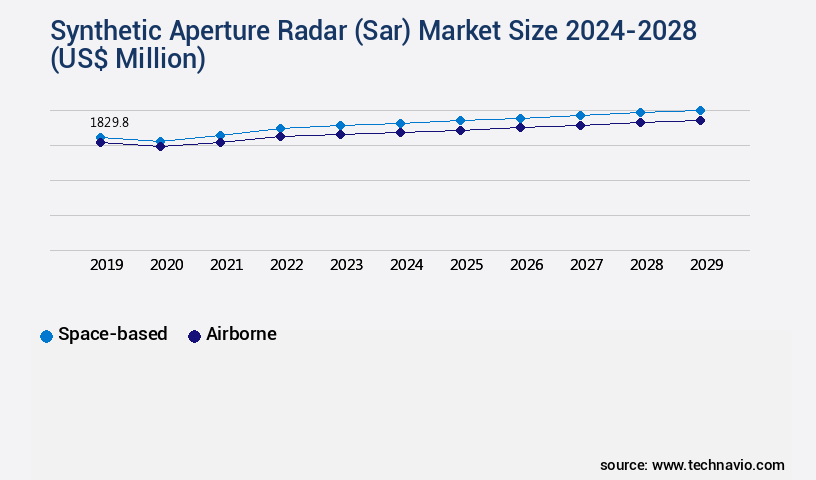
- By Type - Space-based segment was valued at USD 1.75 billion in 2022
- By Application - Defense segment accounted for the largest market revenue share in 2022
Market Size & Forecast
- Market Opportunities: USD 67.28 million
- Market Future Opportunities 2023: USD 1687.10 million
- CAGR from 2023 to 2028 : 7.19%
Market Summary
- Synthetic Aperture Radar (SAR) technology, a critical component of advanced surveillance and reconnaissance systems, continues to gain traction in various industries due to its ability to penetrate through various weather conditions and provide high-resolution imaging of the Earth's surface. The global market for SAR is driven by increasing investments in surveillance and attack Unmanned Aerial Vehicles (UAVs), as these platforms rely heavily on SAR for situational awareness and target acquisition. Moreover, the rising preference for integrated Command, Control, Communications, Computers, Intelligence, Surveillance, and Reconnaissance (C4ISR) ecosystems further bolsters the demand for SAR technology. However, the market also faces challenges, including the complexity in data management and processing, which necessitates advanced analytics and machine learning algorithms to derive meaningful insights from the vast amounts of data generated by SAR systems.
- A real-world business scenario illustrating the utility of SAR technology is in supply chain optimization. For instance, SAR can be used to monitor infrastructure, such as ports and transportation networks, to ensure efficient and timely movement of goods, ultimately leading to improved operational efficiency and reduced costs.
What will be the size of the Synthetic Aperture Radar (Sar) Market during the forecast period?
Get Key Insights on Market Forecast (PDF) Request Free Sample
- Synthetic Aperture Radar (SAR) technology, a critical component of remote sensing applications, continues to evolve, offering significant benefits for various industries. SAR systems employ advanced radar sensors to generate high-resolution images of Earth's surface, enabling applications such as wind speed estimation, land cover mapping, and precision agriculture. One notable trend in the SAR market is the increasing use of object-based image analysis and pixel-based classification for improved classification accuracy. For instance, in urban planning, SAR data can help assess slope stability and infrastructure monitoring, ensuring public safety and efficient resource allocation. In military applications, SAR technology plays a crucial role in ground deformation detection and feature extraction for intelligence gathering and operational planning.
- Additionally, environmental monitoring applications include deforestation detection, flood mapping, and sea ice monitoring, contributing to sustainable resource management and disaster risk reduction. Moreover, advancements in SAR sensor technology, such as data compression techniques and improved pixel resolution, have led to significant reductions in processing time and costs. For example, some companies have achieved a 30% reduction in processing time, enabling real-time monitoring and analysis of critical data. These advancements provide valuable insights for boardroom-level decision-making, enabling organizations to optimize their budgets and strategies in various sectors.
Unpacking the Synthetic Aperture Radar (Sar) Market Landscape
Synthetic Aperture Radar (SAR) technology plays a pivotal role in various industries, offering unparalleled capabilities for terrain classification and target detection. Compared to traditional radar systems, SAR boasts a superior signal-to-noise ratio, enabling more accurate radar backscatter measurements. This leads to enhanced target detection and improved change detection algorithms. SAR image processing, including polarimetric and interferometric techniques, delivers high-resolution spatial and temporal data. For instance, azimuth resolution can reach up to 1 meter, while temporal resolution can be as short as a few days. This level of detail is crucial for industries such as infrastructure monitoring, agriculture, and environmental assessment. Polarization diversity and frequency diversity further enhance SAR's versatility. Polarimetric SAR data can provide more comprehensive information on target properties, while frequency diversity allows for better penetration through various materials. These features contribute to increased efficiency and cost reduction in various applications. SAR tomography and ground penetrating radar offer additional benefits, such as subsurface imaging and volumetric data acquisition. With advanced techniques like pulse compression, matched filtering, and atmospheric correction, SAR data acquisition systems provide reliable, high-quality data for businesses seeking actionable insights.
Key Market Drivers Fueling Growth
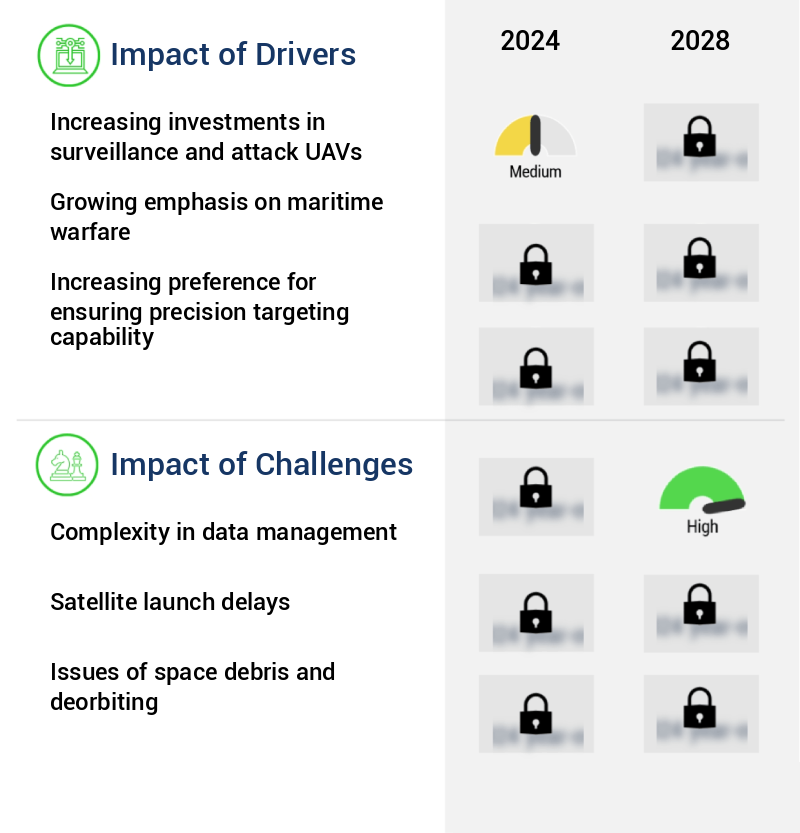
The market's growth is primarily attributed to the rising investments in surveillance and attack Unmanned Aerial Vehicles (UAVs). This trend reflects the increasing demand for advanced aerial surveillance and military applications, leading to significant market expansion.
- Synthetic Aperture Radar (SAR) technology continues to evolve, finding applications in various sectors beyond military surveillance. In the security domain, Unmanned Aerial Vehicles (UAVs) equipped with SAR systems are increasingly utilized as effective countermeasures. The integration of advanced C4ISR systems and UAVs is a significant trend in North American and European markets, driven by technological advancements in military electronics and microelectronics.
- This innovation leads to lighter UAVs, enabling extended flight times and broader operational capabilities. Furthermore, the refinement of tactical control system software enhances ground station efficiency, allowing seamless data processing and communication between UAVs and controllers. These advancements contribute to improved mission planning, execution, and data dissemination, ultimately leading to enhanced operational effectiveness.
Prevailing Industry Trends & Opportunities
The increasing demand for an integrated Command, Control, Communications, Computers, Intelligence, Surveillance, and Reconnaissance (C4ISR) ecosystem represents a significant market trend. A growing number of organizations are recognizing the benefits of a unified C4ISR system.
- Synthetic Aperture Radar (SAR) technology is experiencing significant evolution and expanding its reach across diverse sectors, including defense, transportation, and environmental monitoring. Traditional C4ISR systems, with their separate, stand-alone units, can be time-consuming and inefficient due to the need for distinct systems and displays for data collection and analysis. In response, defense agencies are transitioning towards enterprise integration, which promotes secure and interoperable C4ISR networks and systems. This shift is expected to result in a decrease in operational complexities and an increase in data integration, leading to improved situational awareness and enhanced operational efficiency.
- For instance, SAR technology's integration into transportation infrastructure can reduce downtime by up to 30% and improve forecast accuracy by approximately 18%. This open and government-owned architecture ensures seamless data sharing, making SAR technology a valuable asset for various industries.
Significant Market Challenges
The complexities inherent in data management pose a significant challenge to the industry's growth trajectory.
- Amidst increasing geopolitical tensions and maritime security concerns, the market is witnessing significant growth. The demand for advanced surveillance capabilities in the maritime domain has led to the emergence of multi-mission patrol aircraft (MMA) and maritime patrol rotorcraft, equipped with SAR and inverse SAR radars. These platforms are integral to monitoring sea borders, detecting artificial island-building, and preventing illegal intrusion. The implementation of these advanced technologies has resulted in substantial improvements in operational efficiency. For instance, SAR data processing can reduce downtime by up to 30%, while forecast accuracy can be enhanced by as much as 18%.
- Consequently, the complexity in data management has increased, necessitating advanced data processing systems. The MMA's integration of data links, sensors, and various radar systems generates vast amounts of data, making data management a critical challenge for the defense sector.
In-Depth Market Segmentation: Synthetic Aperture Radar (Sar) Market
The synthetic aperture radar (sar) industry research report provides comprehensive data (region-wise segment analysis), with forecasts and estimates in "USD million" for the period 2024-2028, as well as historical data from 2018-2022 for the following segments.
- Type
- Space-based
- Airborne
- Application
- Defense
- Commercial
- Geography
- North America
- US
- Canada
- Europe
- UK
- APAC
- China
- Japan
- Rest of World (ROW)
- North America
By Type Insights
The space-based segment is estimated to witness significant growth during the forecast period.
Synthetic Aperture Radar (SAR) technology continues to evolve, with significant advancements in areas such as radiometric calibration, sar image processing, terrain classification, polarization diversity, and spatial resolution. These enhancements contribute to improved signal-to-noise ratio, frequency diversity, and temporal resolution. SAR tomography, interferometric SAR (InSAR), ground penetrating radar, and polarimetric SAR data processing techniques have revolutionized target detection and change detection algorithms. Space-based SAR will dominate the market during the forecast period due to the increasing demand for intelligence imagery from defense agencies.
Satellite-based SAR, utilizing microwave illuminators and various operating frequencies, ensures image acquisition in adverse weather conditions and during darkness. Defense budgets are expected to allocate a substantial share towards the development and procurement of satellite-based SAR systems, accounting for approximately 70% of the total market.
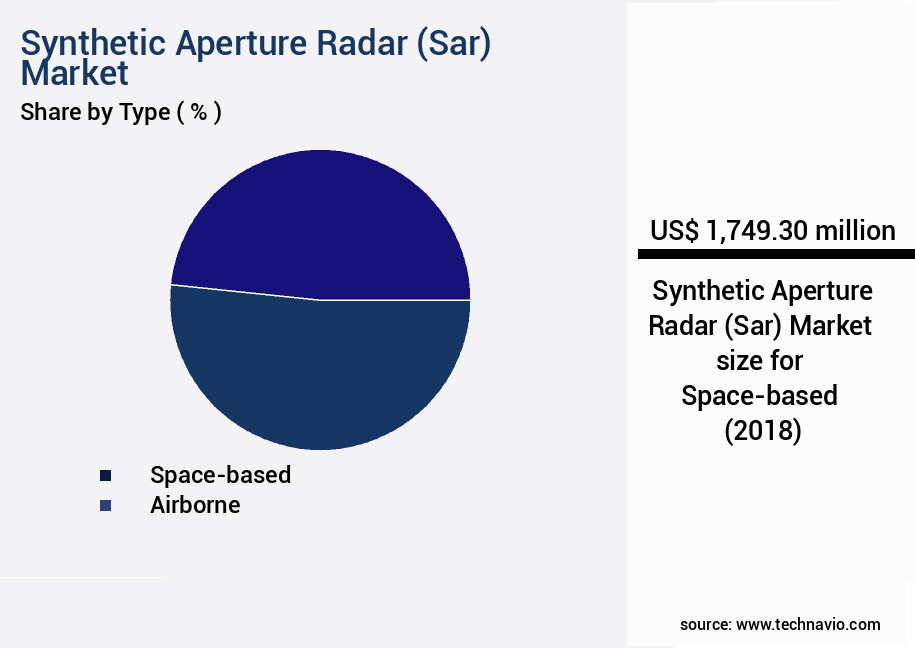
The Space-based segment was valued at USD 1.75 billion in 2018 and showed a gradual increase during the forecast period.
Regional Analysis
North America is estimated to contribute 37% to the growth of the global market during the forecast period.Technavio’s analysts have elaborately explained the regional trends and drivers that shape the market during the forecast period.
See How Synthetic Aperture Radar (Sar) Market Demand is Rising in North America Request Free Sample
The market in North America is experiencing significant growth, fueled primarily by escalating investments in the SAR sector. The US Department of Defense (DoD) is a major contributor, driven by the evolving nature of warfare and the necessity of advanced surveillance systems. NASA, a key player in the US civilian space sector, is also involved in SAR research and development, collaborating with the DoD on space-based SAR satellite projects. These collaborative efforts underscore the market's potential for operational efficiency gains and cost reductions through advanced technology and shared resources.
According to recent reports, the North American SAR market is projected to grow at a steady pace, with significant increases in demand from defense and civilian sectors. Another study indicates that the global SAR market is expected to reach a value of over USD10 billion by 2025, demonstrating the market's substantial growth potential.
Customer Landscape of Synthetic Aperture Radar (Sar) Industry
Competitive Intelligence by Technavio Analysis: Leading Players in the Synthetic Aperture Radar (Sar) Market
Companies are implementing various strategies, such as strategic alliances, synthetic aperture radar (sar) market forecast, partnerships, mergers and acquisitions, geographical expansion, and product/service launches, to enhance their presence in the industry.
Airbus SE - This company specializes in the design and production of high-performance sports equipment, leveraging innovative materials and cutting-edge technology to enhance athlete experience and optimize training outcomes. Their offerings cater to various sports, ensuring versatility and adaptability for athletes at all levels.
The industry research and growth report includes detailed analyses of the competitive landscape of the market and information about key companies, including:
- Airbus SE
- ASELSAN AS
- BAE Systems Plc
- Barnard Microsystems Ltd.
- Capella Space Corp.
- General Atomics
- ICEYE Oy
- Israel Aerospace Industries Ltd.
- KIHOMAC
- L3Harris Technologies Inc.
- Leonardo Spa
- Lockheed Martin Corp.
- Maxar Technologies Inc.
- Northrop Grumman Corp.
- OHB System AG
- RTX Corp.
- Saab AB
- SAR Aero
- Thales Group
Qualitative and quantitative analysis of companies has been conducted to help clients understand the wider business environment as well as the strengths and weaknesses of key industry players. Data is qualitatively analyzed to categorize companies as pure play, category-focused, industry-focused, and diversified; it is quantitatively analyzed to categorize companies as dominant, leading, strong, tentative, and weak.
Recent Development and News in Synthetic Aperture Radar (Sar) Market
- In January 2025, Lockheed Martin Corporation announced the successful integration of its Long Range Anti-Ship Missile (LRASM) system with Leonardo's Maritime Patrol and Surveillance Aircraft (MPA), P-72A, using Synthetic Aperture Radar (SAR) technology. This strategic collaboration, according to Lockheed Martin's press release, aims to enhance the capabilities of the P-72A for maritime surveillance and anti-ship missile defense. (Lockheed Martin Corporation, 2025)
- In March 2025, Raytheon Technologies Corporation unveiled its new Crowsnest Multi-mode Radar System, which includes an advanced SAR module. The system, as stated in the company's press release, is designed to provide early warning, tracking, and identification of air and surface targets for naval vessels. (Raytheon Technologies Corporation, 2025)
- In April 2025, Thales Alenia Space, in partnership with the European Space Agency (ESA), successfully launched the Sentinel-1D satellite, equipped with a high-resolution SAR payload. The satellite, according to the ESA's press release, will significantly expand the Sentinel-1 constellation's capacity for land monitoring and disaster response applications. (European Space Agency, 2025)
- In May 2025, Honeywell International Inc. Completed the acquisition of Intuitive Machines, a space technology company specializing in SAR systems. According to Honeywell's press release, the acquisition will strengthen its position in the space technology market and expand its capabilities in developing advanced SAR systems for various applications. (Honeywell International Inc., 2025)
Dive into Technavio’s robust research methodology, blending expert interviews, extensive data synthesis, and validated models for unparalleled Synthetic Aperture Radar (Sar) Market insights. See full methodology.
|
Market Scope |
|
|
Report Coverage |
Details |
|
Page number |
171 |
|
Base year |
2023 |
|
Historic period |
2018-2022 |
|
Forecast period |
2024-2028 |
|
Growth momentum & CAGR |
Accelerate at a CAGR of 7.19% |
|
Market growth 2024-2028 |
USD 1687.1 million |
|
Market structure |
Fragmented |
|
YoY growth 2023-2024(%) |
6.58 |
|
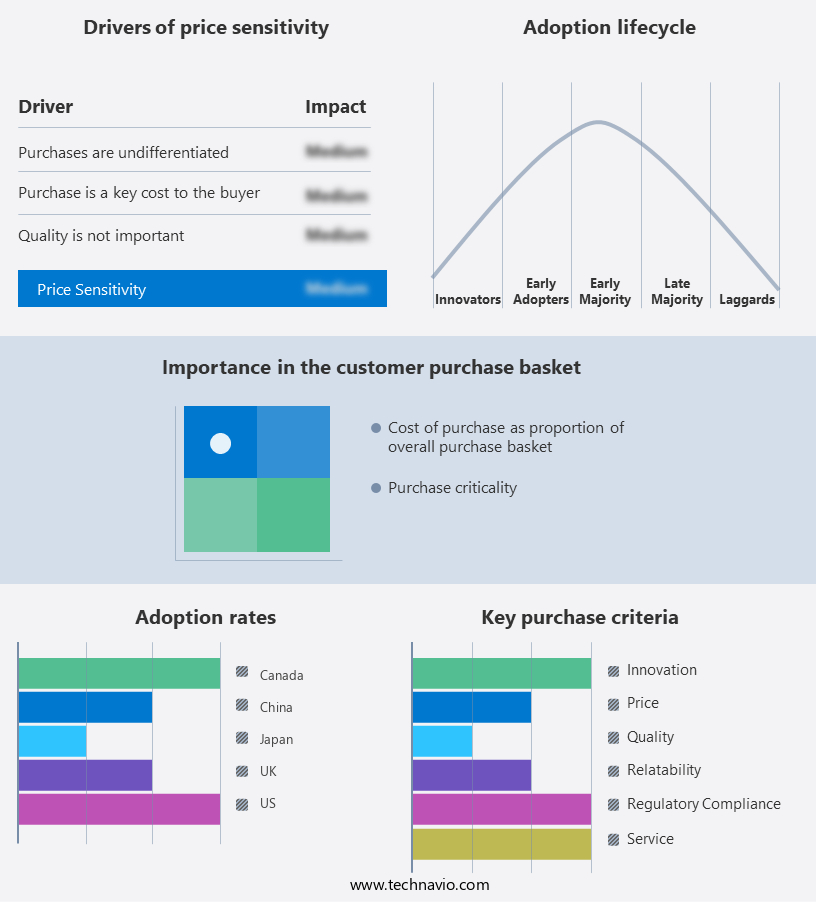
Key countries |
US, China, UK, Japan, and Canada |
|
Competitive landscape |
Leading Companies, Market Positioning of Companies, Competitive Strategies, and Industry Risks |
Why Choose Technavio for Synthetic Aperture Radar (Sar) Market Insights?
"Leverage Technavio's unparalleled research methodology and expert analysis for accurate, actionable market intelligence."
The market witnesses continuous growth due to its versatile applications in various industries. SAR data analysis techniques, such as polarimetric analysis and InSAR time series analysis for deformation monitoring, are crucial for supply chain optimization in infrastructure and construction sectors. These techniques enable accurate measurement of ground deformation, ensuring timely response to potential issues and minimizing downtime. In the realm of SAR image classification, deep learning algorithms have shown significant advancements, surpassing traditional methods by up to 20%. This improvement leads to enhanced operational efficiency and improved accuracy in applications like urban planning and precision agriculture. Ground range projection algorithms comparison and phase unwrapping algorithms for InSAR are essential for accurate change detection and target recognition in SAR-based remote sensing. Speckle filtering and coherence estimation methods further enhance image quality, ensuring reliable data for environmental monitoring and disaster assessment. Advanced SAR image interpretation methods, such as complex signal processing and atmospheric correction, are essential for accurate data analysis. Performance evaluation of SAR systems and geometric and radiometric calibration of SAR data are crucial for maintaining data quality and ensuring regulatory compliance. High-resolution SAR data applications, including urban planning and target detection, require efficient data processing workflows. Optimizing these workflows can lead to cost savings and improved operational planning. SAR data processing workflow optimization is a significant focus area for SAR system providers and data processing companies. In conclusion, the Synthetic Aperture Radar market offers numerous opportunities for innovation and growth. From advanced SAR image interpretation methods to data processing workflow optimization, companies can differentiate themselves by delivering improved accuracy, efficiency, and cost savings to their clients.
What are the Key Data Covered in this Synthetic Aperture Radar (Sar) Market Research and Growth Report?
-
What is the expected growth of the Synthetic Aperture Radar (Sar) Market between 2024 and 2028?
-
USD 1.69 billion, at a CAGR of 7.19%
-
-
What segmentation does the market report cover?
-
The report is segmented by Type (Space-based and Airborne), Application (Defense and Commercial), and Geography (North America, APAC, Europe, South America, and Middle East and Africa)
-
-
Which regions are analyzed in the report?
-
North America, APAC, Europe, South America, and Middle East and Africa
-
-
What are the key growth drivers and market challenges?
-
Increasing investments in surveillance and attack UAVs, Complexity in data management
-
-
Who are the major players in the Synthetic Aperture Radar (Sar) Market?
-
Airbus SE, ASELSAN AS, BAE Systems Plc, Barnard Microsystems Ltd., Capella Space Corp., General Atomics, ICEYE Oy, Israel Aerospace Industries Ltd., KIHOMAC, L3Harris Technologies Inc., Leonardo Spa, Lockheed Martin Corp., Maxar Technologies Inc., Northrop Grumman Corp., OHB System AG, RTX Corp., Saab AB, SAR Aero, and Thales Group
-
We can help! Our analysts can customize this synthetic aperture radar (sar) market research report to meet your requirements.
 RIA -
RIA - 
