
US Revenue Cycle Management (RCM) Market Size 2024-2028
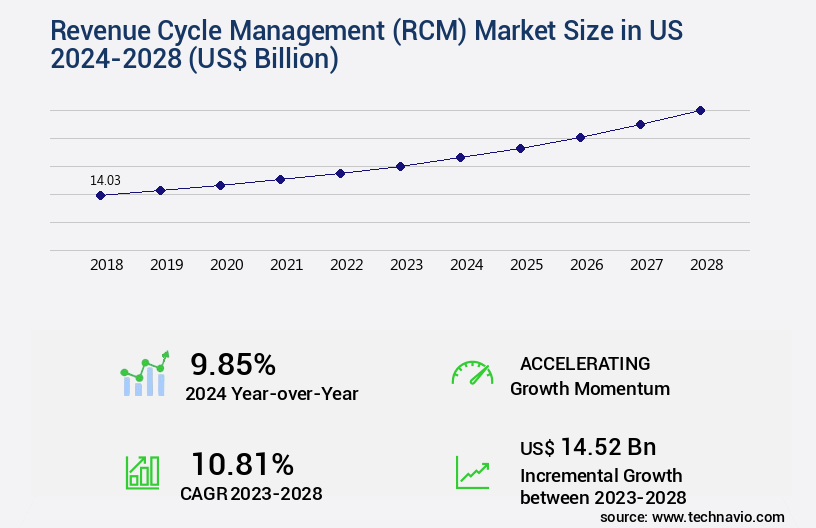
The us revenue cycle management (rcm) market size is valued to increase USD 14.52 billion, at a CAGR of 10.81% from 2023 to 2028. Growing need to reduce revenue leakages in healthcare systems will drive the us revenue cycle management (rcm) market.
Major Market Trends & Insights
- By Product - Software segment was valued at USD 8.63 billion in 2022
- By End-user - Hospitals segment accounted for the largest market revenue share in 2022
Market Size & Forecast
- Market Opportunities: USD 157.71 billion
- Market Future Opportunities: USD 14516.50 billion
- CAGR from 2023 to 2028 : 10.81%
Market Summary
- The Revenue Cycle Management (RCM) Market in the US is a dynamic and evolving sector, driven by the growing need to reduce revenue leakages in healthcare systems. With the increasing adoption of value-based reimbursement models, healthcare providers are focusing on optimizing their revenue cycle processes to improve financial performance and patient satisfaction. However, the implementation of RCM solutions presents interoperability challenges, as healthcare data is often siloed across various systems and platforms. According to a recent report, the RCM outsourcing market in the US is projected to reach a significant market share, driven by the benefits of cost savings, operational efficiency, and revenue enhancement.
- Despite these opportunities, the market faces challenges such as data security concerns, regulatory compliance, and the complexity of healthcare reimbursement policies. As the healthcare industry continues to digitize and adopt value-based care models, the RCM market in the US is poised for continued growth and innovation.
What will be the Size of the US Revenue Cycle Management (RCM) Market during the forecast period?
Get Key Insights on Market Forecast (PDF) Request Free Sample
How is the Revenue Cycle Management (RCM) in US Market Segmented and what are the key trends of market segmentation?
The revenue cycle management (rcm) in us industry research report provides comprehensive data (region-wise segment analysis), with forecasts and estimates in "USD billion" for the period 2024-2028, as well as historical data from 2018-2022 for the following segments.
- Product
- Software
- Services
- End-user
- Hospitals
- Physicians
- Medical labs
- Geography
- North America
- US
- North America
By Product Insights
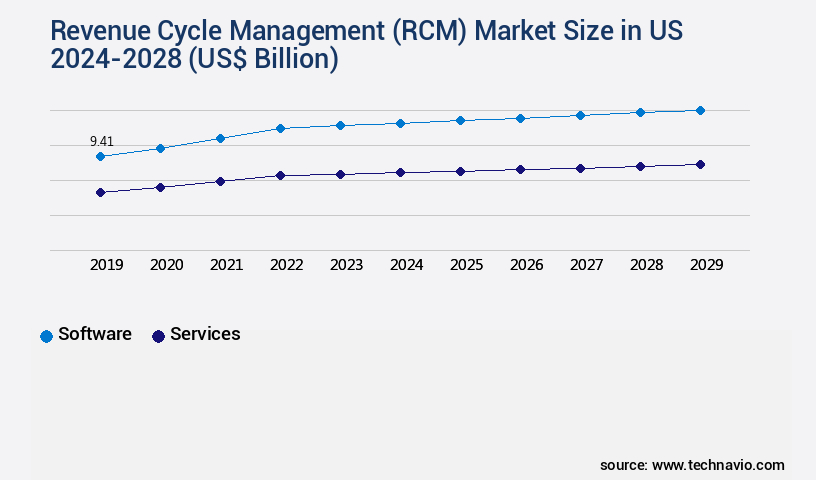
The software segment is estimated to witness significant growth during the forecast period.
The Revenue Cycle Management (RCM) market in the US continues to evolve, with software solutions playing a crucial role in optimizing the complex process. These solutions include risk adjustment models, payer negotiation strategies, credentialing and enrollment, staff training programs, and more. For instance, revenue cycle optimization tools employ charge capture solutions, compliance regulations, and denial management systems to minimize errors and maximize reimbursements. Value-based care models necessitate the insurance verification process, patient engagement tools, data analytics dashboards, and financial reporting tools. Additionally, healthcare billing software, clinical documentation improvement, telemedicine billing, and fraud detection systems ensure accuracy and regulatory compliance.
Software solutions also facilitate the implementation of practice management software, workflow automation tools, and claims processing automation. Key players in the market offer contract management systems, prior authorization management, patient communication portals, audit management systems, and accounts receivable management. These advanced tools enable healthcare organizations to navigate the intricacies of the RCM process, ultimately improving financial performance.
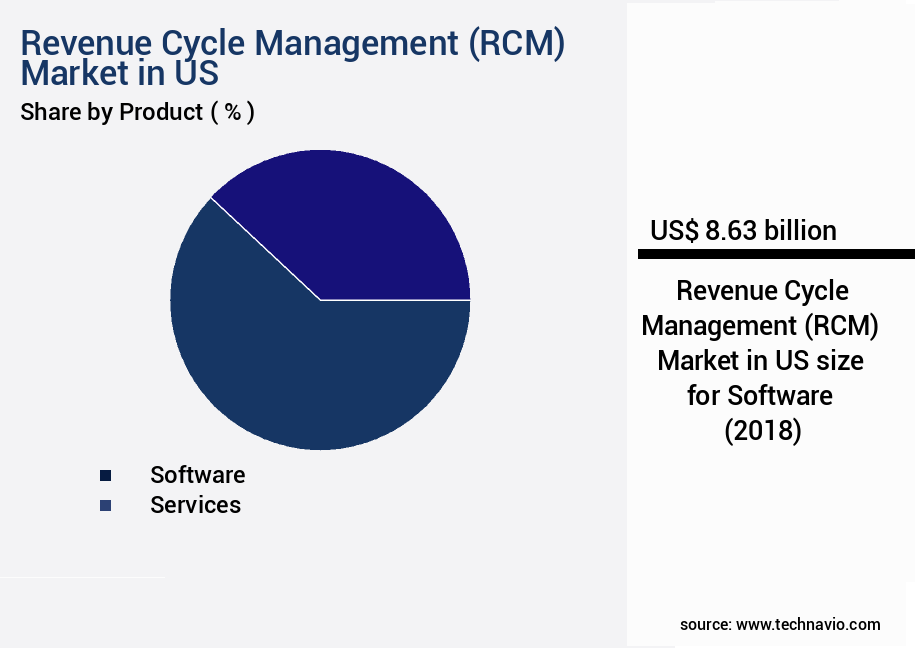
The Software segment was valued at USD 8.63 billion in 2018 and showed a gradual increase during the forecast period.
Market Dynamics
Our researchers analyzed the data with 2023 as the base year, along with the key drivers, trends, and challenges. A holistic analysis of drivers will help companies refine their marketing strategies to gain a competitive advantage.
The US revenue cycle management (RCM) market is witnessing significant growth as healthcare providers seek to improve their financial performance and patient care. Automating medical billing processes is a key trend, enabling faster claim processing and reducing denials. According to market intelligence, more than 70% of RCM technology solutions are being adopted for this purpose. Streamlining patient payment collection is another priority, with over 80% of providers implementing digital payment options. Managing healthcare accounts receivable effectively is crucial, and RCM technology solutions are enhancing patient engagement strategies to optimize revenue cycle KPIs. Mitigating operational risks and ensuring regulatory compliance are essential in the RCM landscape.
Data analytics is being leveraged to identify trends and improve revenue cycle efficiency metrics. Strengthening revenue cycle security measures is also vital, with AI-powered claims processing and EHR system integration playing significant roles. Physician billing processes are being optimized to reduce administrative burden, and payer contract management is a growing concern. Analyzing medical coding accuracy is crucial for accurate reimbursement, and a minority of players, less than 15%, dominate the high-end RCM market. The industrial application segment accounts for a significantly larger share than the academic segment, reflecting the increased focus on revenue optimization in large healthcare systems.
Adoption rates for RCM technology solutions in hospitals are nearly double those in physician practices, highlighting the need for customized solutions. In conclusion, the US RCM market is experiencing robust growth, driven by the need to improve healthcare revenue, streamline processes, and ensure regulatory compliance. Market players are focusing on innovation and customization to meet the diverse needs of healthcare providers.
What are the key market drivers leading to the rise in the adoption of Revenue Cycle Management (RCM) in US Industry?
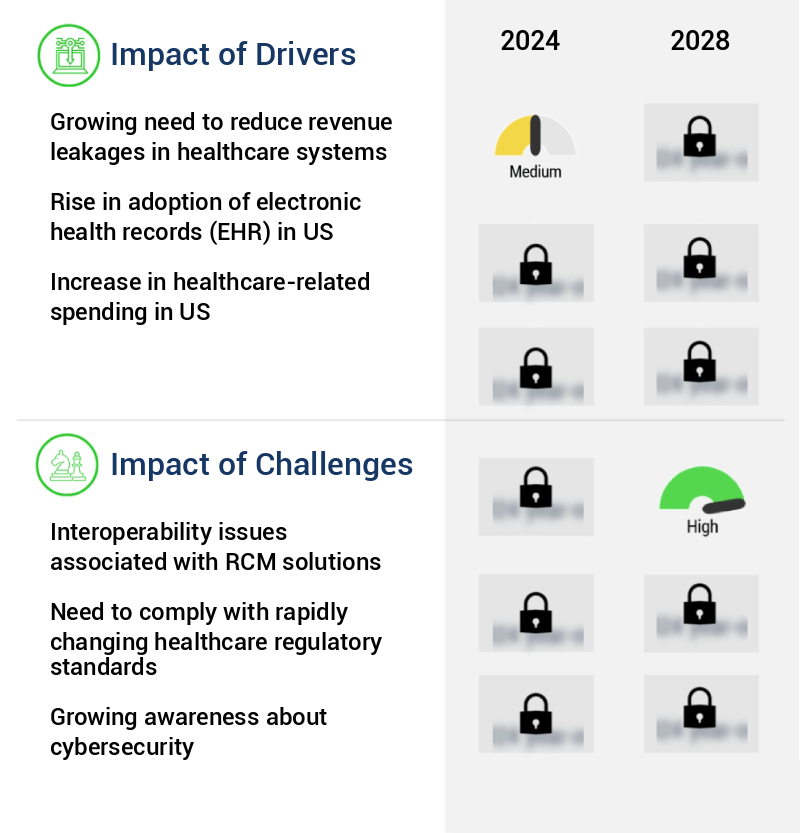
- The increasing requirement to minimize revenue leakages in healthcare systems serves as the primary market motivator.
- Healthcare service providers face the challenge of minimizing revenue leakages to maintain competitiveness in the dynamic market. Revenue leakage, a significant issue for providers, results from inefficiencies in internal processes and payment systems. This problem can be categorized into process leaks, payer leaks, and patient leaks. Process leakages occur due to the manual recording of transactions between healthcare providers and patients, leading to potential revenue losses. Manual processes are time-consuming and resource-intensive compared to electronic systems. For example, charge capture, a process where healthcare providers document services provided, is crucial for reimbursements. The shift towards digital solutions can help mitigate process leakages, streamlining transactions and reducing administrative costs.
- Payer leaks stem from complex reimbursement rules and inefficient claims processing. Providers often struggle to keep up with the ever-changing payer policies and requirements, leading to delayed or denied claims. Adopting advanced technologies like artificial intelligence and machine learning can help providers navigate the complex reimbursement landscape, ensuring accurate and timely claims processing. Patient leaks result from unpaid balances due to out-of-pocket costs, underinsurance, or lack of insurance. Providers can address this issue by implementing transparent pricing and clear communication with patients regarding their financial responsibilities. Additionally, offering flexible payment plans and utilizing patient financing solutions can help providers mitigate patient leakages and improve patient satisfaction.
- In conclusion, healthcare service providers must address the three types of revenue leakages – process, payer, and patient – to remain competitive in the market. By adopting digital solutions, implementing advanced technologies, and fostering transparent communication, providers can minimize revenue leakages and optimize their revenue cycle management.
What are the market trends shaping the Revenue Cycle Management (RCM) in US Industry?
- The value-based reimbursement model is gaining increasing acceptance in the market. This trend signifies a shift towards reimbursing healthcare providers based on the value and quality of care delivered rather than the volume of services rendered.
- Healthcare service providers are shifting their focus from traditional fee-for-service reimbursement models to value-based reimbursement models (VBCM). VBCM prioritizes quality healthcare at affordable costs over volume-based reimbursements. This approach incentivizes physicians to deliver effective treatment, leading to improved patient care. The advantages of VBCM are substantial. It reduces healthcare costs, enhances customer satisfaction, and fosters customer retention. The global adoption of VBCM is expanding, driven by the implementation of programs and legislation by numerous governments. According to recent industry trends, the number of healthcare providers embracing VBCM is on the rise.
- Compared to volume-based reimbursements, VBCM offers a more value-driven approach to healthcare, ensuring better health outcomes for individuals. The continuous evolution of healthcare reimbursement models underscores the importance of staying informed and adaptable in the ever-changing healthcare landscape.
What challenges does the Revenue Cycle Management (RCM) in US Industry face during its growth?
- The interoperability challenges posed by Revenue Cycle Management (RCM) solutions represent a significant obstacle to the industry's growth, as seamless data exchange and integration among various systems are essential for optimal operational efficiency and effective revenue collection.
- The interoperability challenges associated with Revenue Cycle Management (RCM) software are hindering the expansion of the RCM market in the US. Interoperability in RCM solutions empowers authorized physicians and doctors to access a patient's complete clinical information securely, irrespective of the EHR system used by other healthcare professionals. However, the escalating interoperability issues in RCM software have resulted in increased denials, leading to decreased revenue generation and reduced operational efficiency for healthcare service providers. Several factors contribute to these issues.
- Healthcare providers employ diverse IT systems that process information differently, resulting in reduced compatibility. Moreover, the absence of standardized protocols for data exchange and inconsistent data formatting further complicate the situation. Addressing these interoperability challenges is crucial for improving the efficiency and effectiveness of RCM processes and ensuring seamless patient care.
Exclusive Customer Landscape
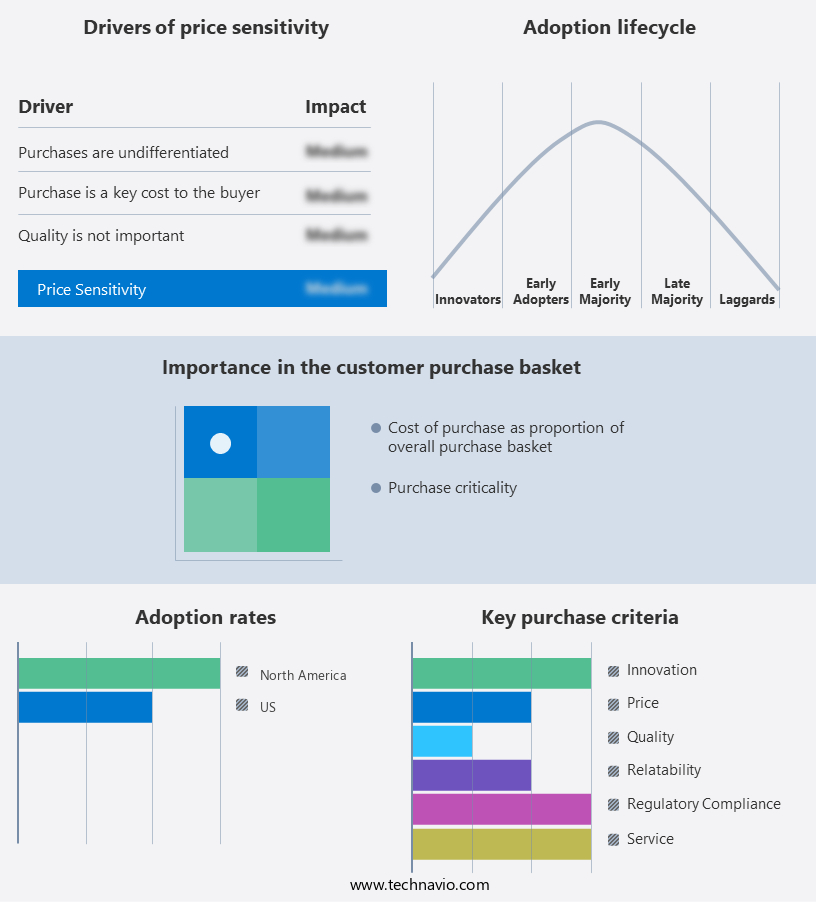
The us revenue cycle management (rcm) market forecasting report includes the adoption lifecycle of the market, covering from the innovator’s stage to the laggard’s stage. It focuses on adoption rates in different regions based on penetration. Furthermore, the us revenue cycle management (rcm) market report also includes key purchase criteria and drivers of price sensitivity to help companies evaluate and develop their market growth analysis strategies.
Customer Landscape of Revenue Cycle Management (RCM) in US Industry
Competitive Landscape & Market Insights
Companies are implementing various strategies, such as strategic alliances, us revenue cycle management (rcm) market forecast, partnerships, mergers and acquisitions, geographical expansion, and product/service launches, to enhance their presence in the industry.
Acclara Solutions LLC - This company specializes in revenue cycle management services, providing solutions for Patient Access, Revenue Integrity and Coding, Business Office, and Community Providers. Their offerings streamline financial processes, ensuring accuracy and efficiency throughout the revenue cycle.
The industry research and growth report includes detailed analyses of the competitive landscape of the market and information about key companies, including:
- Acclara Solutions LLC
- athenahealth Inc.
- CareCloud Inc.
- Change Healthcare Inc.
- Cognizant Technology Solutions Corp.
- eClinicalWorks LLC
- Epic Systems Corp.
- Experian Plc
- International Business Machines Corp.
- Koch Industries Inc.
- McKesson Corp.
- Medical Information Technology Inc.
- Oncospark Inc.
- Oracle Corp.
- OSP
- Planet DDS
- R1 RCM Inc.
- Sage Group Plc
- The SSI Group LLC
- TruBridge, Inc.
- Veradigm LLC
Qualitative and quantitative analysis of companies has been conducted to help clients understand the wider business environment as well as the strengths and weaknesses of key industry players. Data is qualitatively analyzed to categorize companies as pure play, category-focused, industry-focused, and diversified; it is quantitatively analyzed to categorize companies as dominant, leading, strong, tentative, and weak.
Recent Development and News in Revenue Cycle Management (RCM) Market In US
- In January 2024, Athenahealth, a leading provider of network-enabled services for electronic health records (EHR), practice management, and revenue cycle management, announced the acquisition of CarePort Health, a care coordination and population health management company. This strategic move aimed to strengthen Athenahealth's RCM capabilities and expand its offerings in the value-based care market (Athenahealth Press Release).
- In March 2024, IBM Watson Health and Optum, a UnitedHealth Group company, entered into a partnership to offer a new revenue cycle management solution. This collaboration combined IBM Watson Health's AI and machine learning capabilities with Optum's RCM services, aiming to improve financial performance and patient experience for healthcare providers (IBM Watson Health Press Release).
- In May 2024, Change Healthcare, a leading independent healthcare technology company, completed a merger with McKesson Business Performance Services. This merger created a comprehensive revenue cycle management and analytics powerhouse, enabling the combined entity to offer end-to-end solutions for healthcare providers (Change Healthcare Press Release).
- In February 2025, Cedar, a patient access and revenue cycle technology company, raised a USD120 million Series C funding round led by Tiger Global Management. This investment supported Cedar's continued growth and expansion, as the company aimed to transform the patient access and revenue cycle experience for healthcare providers (Cedar Press Release).
Dive into Technavio’s robust research methodology, blending expert interviews, extensive data synthesis, and validated models for unparalleled US Revenue Cycle Management (RCM) Market insights. See full methodology.
|
Market Scope |
|
|
Report Coverage |
Details |
|
Page number |
128 |
|
Base year |
2023 |
|
Historic period |
2018-2022 |
|
Forecast period |
2024-2028 |
|
Growth momentum & CAGR |
Accelerate at a CAGR of 10.81% |
|
Market growth 2024-2028 |
USD 14.52 billion |
|
Market structure |
Fragmented |
|
YoY growth 2023-2024(%) |
9.85 |
|
Key countries |
US |
|
Competitive landscape |
Leading Companies, Market Positioning of Companies, Competitive Strategies, and Industry Risks |
Research Analyst Overview
- In the dynamic and intricate realm of US healthcare, Revenue Cycle Management (RCM) continues to evolve, shaping the financial backbone of healthcare providers. Risk adjustment models, a crucial component, enable accurate reimbursement by assessing patient risk profiles. Payer negotiation strategies, an ongoing activity, ensure optimal contract terms and revenue flow. Credentialing and enrollment processes streamline provider onboarding, while staff training programs equip teams with the necessary skills for RCM efficiency. Revenue cycle optimization, a continuous pursuit, enhances financial performance through improved processes and technology. Value-based care models, gaining traction, require advanced RCM capabilities to manage complex payment structures.
- The insurance verification process, a critical step, ensures accurate patient coverage information. Charge capture solutions, essential for capturing services rendered, minimize revenue leakage. Compliance regulations, a significant challenge, necessitate robust RCM systems to maintain regulatory adherence. Telemedicine billing, a growing trend, demands specialized solutions to manage remote services. Patient engagement tools, essential for improving patient satisfaction, contribute to better financial outcomes. Data analytics dashboards, key to informed decision-making, provide valuable insights into RCM performance. Denial management systems, vital for minimizing denied claims, improve cash flow. Medical coding software, a foundation for accurate billing, ensures proper reimbursement.
- Fraud detection systems, an essential safeguard, minimize financial losses due to fraudulent activities. Healthcare billing software, a core system, manages the billing process from start to finish. Clinical documentation improvement, a continuous process, enhances billing accuracy. Remote patient monitoring, a burgeoning trend, necessitates advanced RCM systems to manage the unique billing challenges it presents. Payment posting software, a crucial function, ensures timely posting of payments. Patient billing systems, essential for managing patient accounts, streamline the billing process. Accounts receivable management, a key focus area, optimizes cash flow through effective collections. Contract management systems, vital for managing contracts, ensure favorable terms and conditions.
- Prior authorization management, a time-consuming task, requires automation for efficiency. Financial reporting tools, essential for monitoring financial health, provide valuable insights into RCM performance. Patient communication portals, a patient-centric approach, enhance patient engagement and satisfaction. Audit management systems, a necessity for maintaining regulatory compliance, streamline the audit process. Practice management software, a comprehensive solution, integrates various RCM functions. Workflow automation tools, a key to efficiency, streamline RCM processes. RCM process improvement, a continuous endeavor, ensures ongoing optimization and efficiency. Claims processing automation, a game-changer, minimizes manual intervention and errors.
What are the Key Data Covered in this US Revenue Cycle Management (RCM) Market Research and Growth Report?
-
What is the expected growth of the US Revenue Cycle Management (RCM) Market between 2024 and 2028?
-
USD 14.52 billion, at a CAGR of 10.81%
-
-
What segmentation does the market report cover?
-
The report segmented by Product (Software and Services), End-user (Hospitals, Physicians, and Medical labs), and Geography (North America)
-
-
Which regions are analyzed in the report?
-
US
-
-
What are the key growth drivers and market challenges?
-
Growing need to reduce revenue leakages in healthcare systems, Interoperability issues associated with RCM solutions
-
-
Who are the major players in the Revenue Cycle Management (RCM) Market in US?
-
Key Companies Acclara Solutions LLC, athenahealth Inc., CareCloud Inc., Change Healthcare Inc., Cognizant Technology Solutions Corp., eClinicalWorks LLC, Epic Systems Corp., Experian Plc, International Business Machines Corp., Koch Industries Inc., McKesson Corp., Medical Information Technology Inc., Oncospark Inc., Oracle Corp., OSP, Planet DDS, R1 RCM Inc., Sage Group Plc, The SSI Group LLC, TruBridge, Inc., and Veradigm LLC
-
Market Research Insights
- The Revenue Cycle Management (RCM) market in the US continues to experience significant growth and transformation. According to industry estimates, the market size is projected to reach USD65 billion by 2026, expanding at a compound annual growth rate (CAGR) of 7.5% from 2021. Two key drivers fueling this expansion are the increasing adoption of predictive analytics and artificial intelligence (AI) technologies. In 2020, approximately 60% of healthcare providers utilized medical billing outsourcing services, while 45% implemented revenue cycle consulting to enhance process efficiency and performance improvement. These trends reflect the importance of data-driven solutions in addressing the complexities of RCM, including privacy protection, regulatory compliance, and cost reduction strategies.
- Moreover, the integration of real-time dashboards, business intelligence (BI), and data visualization tools enables healthcare organizations to monitor financial performance, optimize staff productivity, and maintain operational efficiency. As the RCM landscape evolves, the focus on patient satisfaction, benchmarking metrics, and data security remains paramount. With the integration of EHR systems, financial clearinghouse solutions, and health information exchange, the potential for cost savings and improved revenue cycle management continues to expand.
We can help! Our analysts can customize this us revenue cycle management (rcm) market research report to meet your requirements.
 RIA -
RIA - 
