Wellness Real Estate Market Size 2025-2029
The wellness real estate market size is forecast to increase by USD 768.6 billion, at a CAGR of 20.2% between 2024 and 2029.
- The rising demand for wellness real estate from the luxury residential sector is the key driver of the market. As affluent buyers seek healthier living environments, the increasing demand for regenerative living is emerging as a significant trend. This trend focuses on sustainable, restorative spaces that promote physical and mental well-being, incorporating elements like biophilic design, eco-friendly materials, and holistic amenities to enhance the quality of life for residents. Key factors contributing to this trend include the rising awareness of health and wellness, the desire for work-life balance, and the growing popularity of sustainable and eco-friendly practices.
- However, the market faces stiff competition, with numerous players vying for market share. To stay competitive, industry players must focus on offering unique and innovative features that cater to the evolving needs and preferences of consumers. In summary, the market is poised for continued growth, fueled by the increasing demand for properties that prioritize mental health and well-being, while also facing competition from a crowded marketplace.
What will be the Size of the Wellness Real Estate Market During the Forecast Period?
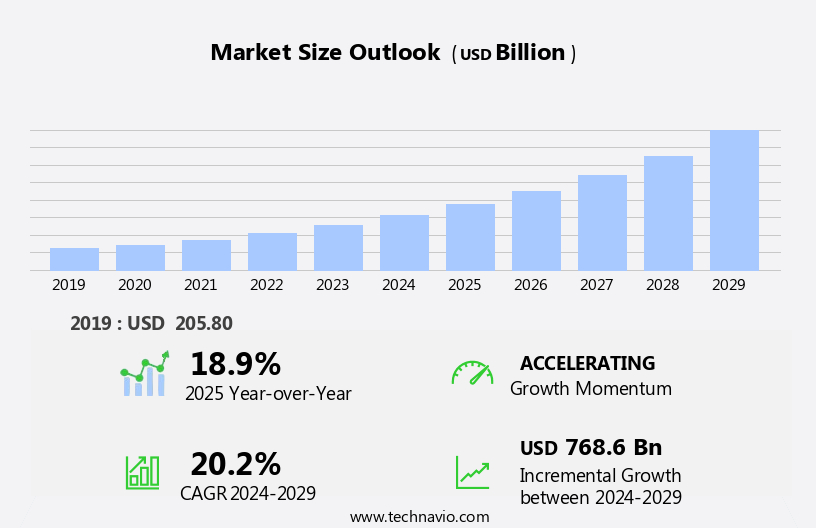
To learn more about the market report, Request Free Sample
- The wellness movement has significantly influenced residential real estate, leading to the emergence of wellness communities that prioritize environmental sustainability and health outcomes. These communities cater to various demographics, including affluent foreign tourists, senior corporates, and urban youths, in metros and non-metros alike. The focus on personal investment in wellness and expenditure on healthier lifestyles has fueled the demand for properties that offer access to outdoor yoga studios, medicinal gardens, meditation courtyards, and eco-friendly homes. The culinary movement and design-driven movement have also played a role in this trend, with an increasing preference for properties that prioritize healthy eating and aesthetics.
- The green building movement is another significant factor driving the growth of the market. Buildings that prioritize safety, sanitation, and energy efficiency are in high demand. The importance of building safety, especially in the aftermath of natural disasters and pandemics, has become increasingly apparent. Traditional boundaries between urban and rural areas have blurred, with scenic hill stations, picturesque foothills, and lush green valleys becoming popular destinations for those seeking a healthier lifestyle.
- Secluded sea beaches offer a similar appeal, providing residents with a tranquil environment conducive to relaxation and rejuvenation. The luxury sector has also embraced the wellness movement, with high-end developments offering top-notch healthcare services, ensuring the safety and well-being of residents. Urbanism, too, is evolving to accommodate the needs of health-conscious individuals, with a focus on creating sustainable, walkable communities that prioritize green spaces and public health. In conclusion, the wellness movement has transformed the residential real estate market, with a growing demand for properties that prioritize health outcomes, environmental sustainability, and personal well-being. This trend is expected to continue, with various demographics seeking properties that cater to their unique needs and preferences.
How is the Wellness Real Estate Market Segmented?
The market research report provides comprehensive data (region-wise segment analysis), with forecasts and estimates in "USD billion" for the period 2025-2029, as well as historical data from 2019-2023 for the following segments.
- End-user
- Commercial
- Residential
- Wellness Features
- Physical wellness
- Meditation Room
- Nutritional wellness
- Environmental wellness
- Geography
- North America
- Canada
- US
- APAC
- China
- India
- Japan
- South Korea
- Europe
- Germany
- UK
- France
- Middle East and Africa
- UAE
- South America
- Brazil
- North America
By End-user Insights
The commercial segment is estimated to witness significant growth during the forecast period. The market in the commercial sector is experiencing notable expansion, driven by an increasing number of wellness commercial pipeline projects and the development of wellness communities. This growth is evident in various sectors, including commercial real estate, offices and workplaces, public buildings, hospitality developments, and medical facilities. Factors contributing to this trend include the rise in energy-efficient technologies and regulatory mandates promoting renovation and modernization activities. Wellness communities, which prioritize connection, intention, and holistic health, are becoming increasingly popular among residents seeking a lifestyle that integrates design principles, construction output, and luxury amenities. These communities cater to the food movement, intentional living, and virtual communities, offering a range of benefits for both personal and professional growth.
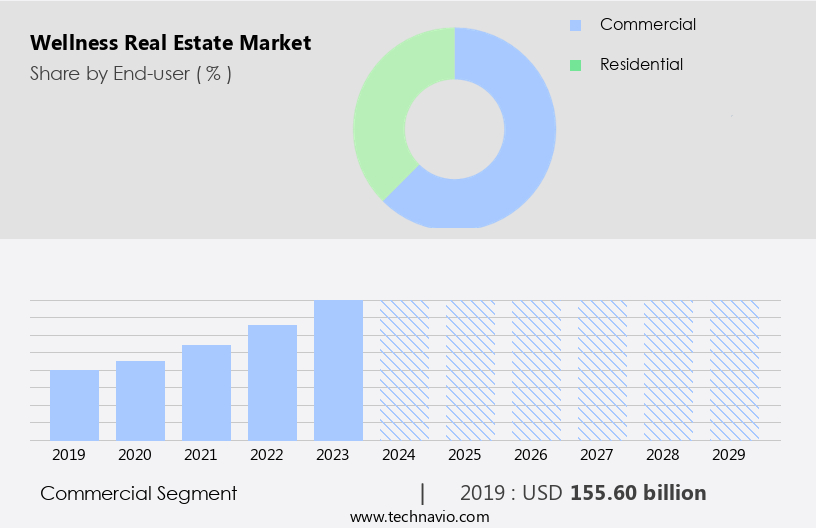
Get a glance at the share of various segments. Request Free Sample
The commercial segment was valued at USD 155.60 billion in 2019 and showed a gradual increase during the forecast period.
Regional Analysis
North America is estimated to contribute 36% to the growth of the global market during the forecast period. Technavio's analysts have elaborately explained the regional trends and drivers that shape the market during the forecast period.

For more insights on the market share of various regions, Request Free Sample
The market is experiencing notable expansion during the forecast period, driven by the growing preference for luxury wellness properties and an escalating number of commercial and residential projects in this sector. The US and Canada lead the North American market, with the US witnessing substantial growth due to the support of various organizations, such as the US Centers for Disease Control and Prevention (CDC), American Planning Association (APA), Urban Land Institute (ULI), Center for Active Design, and International WELL Building Institute (IWBI), in promoting wellness real estate through research and on-ground programs. This trend is particularly evident among affluent foreign tourists, senior corporates, urban youths, and those seeking personal wellbeing in metros, non-metros, scenic hill stations, picturesque foothills, lush green valleys, and secluded sea beaches. The market encompasses general-purpose spas, Ayurveda, destination spas, and ecohotels, catering to medical wellbeing and stress management naturally.
Wellness Real Estate Market Dynamics
Our researchers analyzed the data with 2024 as the base year, along with the key drivers, trends, and challenges. A holistic analysis of drivers will help companies refine their marketing strategies to gain a competitive advantage.
What are the key market drivers leading to the rise in the adoption of the market?
- Rising demand for wellness real estate from the luxury residential sector is the key driver of the market.
- In the residential real estate market, the wellness movement is gaining momentum as developers cater to the growing demand for healthier living environments. Wellness communities, with their focus on personal investment in health outcomes, are becoming increasingly popular. These communities prioritize the environment, offering sanitation and building safety features, as well as conveniences that support active lifestyles and healthy eating. The wellness lifestyle is driving expenditure on design-driven movements such as the culinary and green building movements. Buyers seek eco-friendly homes, and there is a rising demand for buildings with WELL Building Standards. The luxury sector is responding with up-scaled residential and master-planned communities, multifamily housing, and urban districts that prioritize environmental impacts and minimize toxic substance exposure.
- Moreover, the wellness community concept extends beyond physical health, addressing mental wellbeing through stress reduction, behavior change, and social encounters. This includes outdoor recreation areas, meditation courtyards, and green spaces. Virtual communities and intentional communities also play a role, offering a sense of connection and belonging. The wellness lifestyle encompasses mind-body health, with a focus on holistic health and spiritual enhancements. Wellness providers, such as health clubs and fitness professionals, offer dietary solutions, medical wellbeing, and stress management services. The tourism industry is also embracing wellness tourism, with spas and wellness resorts offering a range of services from sleep management and weight loss to air quality and biodiversity.
What are the market trends shaping the market?
- Increasing demand for regenerative living is the upcoming trend in the market.
- The market in residential properties is experiencing significant growth due to the wellness movement's increasing influence on lifestyles and health outcomes. This trend is reflected in the development of wellness communities that prioritize environmental sustainability, building safety, and reduced exposure to infectious diseases. These communities offer conveniences such as telecommunications, entertainment, and access to outdoor recreation, while also addressing sedentary lifestyles and poor diet through design-driven movements like the culinary and green building movements. Wellness communities are not limited to master-planned communities or luxury, buy-in developments. They can also be found in multifamily housing and urban districts, catering to a diverse range of buyers, including affluent foreign tourists, senior corporates, and urban youths.
- The pipeline for these communities is strong, with potential buyers seeking healthier lifestyles and wellness goals, as well as wellness providers offering services such as health clubs, fitness professionals, and dietary solutions. The design principles of these communities prioritize ambiance, décor, and spatial designs that promote mind-body health, as well as holistic health offerings such as spas, Ayurveda centers, destination spas, eco-hotels, and medical wellbeing centers.
- Builders and developers of real estate are prioritizing the use of green constructions, reducing toxic substance exposure, and promoting stress reduction and behavior change through wellness philosophies. In summary, the market is a dynamic and growing sector that prioritizes the health and wellbeing of residents through sustainable, regenerative, and biophilic design principles. This trend is driven by the increasing importance of holistic health and wellness lifestyles, as well as the desire for a sense of connection and community.
What challenges does the market face during the growth?
- High competition in the market is a key challenge affecting the market growth.
- The market in residential properties is experiencing significant growth due to the wellness movement's increasing influence on lifestyles and health outcomes. This market includes communities designed with environmental considerations, building safety, and infectious disease prevention in mind. Personal investment in wellness lifestyles, which includes expenditures on healthy food, fitness, and mental health, is driving demand for wellness communities. These communities offer conveniences such as telecommunications, entertainment, and access to outdoor recreation to promote active lifestyles and reduce sedentary behaviors. Design-driven movements, such as the culinary and green building movements, are also shaping the market. Wellness communities prioritize sanitation, fresh air, and natural light to promote healthier living.
- They also offer amenities like meditation courtyards, eco-friendly homes, and medical wellbeing centers for stress reduction, behavior change, and healthier lifestyles. The market is diverse, with offerings ranging from luxury master-planned communities to multifamily housing and urban districts. The environmental impacts of wellness real estate are also a consideration, with a focus on reducing greenhouse gas emissions, improving air quality, and preserving biodiversity. Potential buyers include affluent foreign tourists, senior corporates, and urban youths in metros and non-metros. Wellness communities offer a sense of connection, intention, and community interaction, addressing health challenges such as loneliness and chronic diseases.
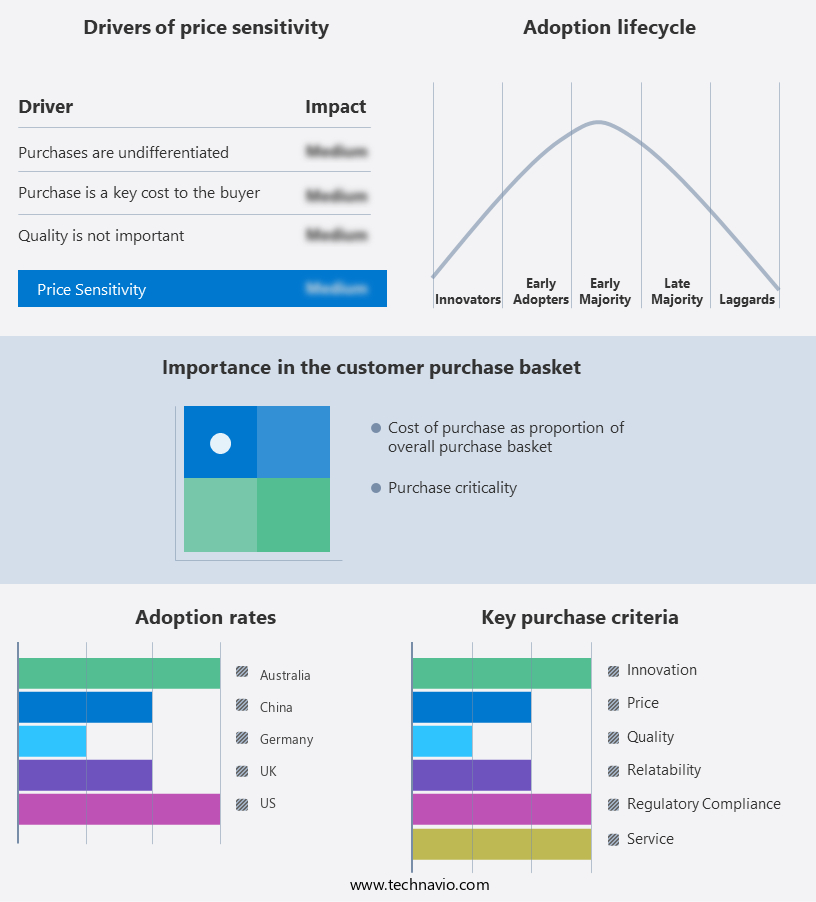
Customer Landscape
The market forecasting report includes the adoption lifecycle of the market, covering from the innovator's stage to the laggard's stage. It focuses on adoption rates in different regions based on penetration. Furthermore, the market growth analysis report also includes key purchase criteria and drivers of price sensitivity to help companies evaluate and develop their market growth analysis strategies.
Customer Landscape
Key Wellness Real Estate Market Companies
Companies are implementing various strategies, such as strategic alliances, market forecast, partnerships, mergers and acquisitions, geographical expansion, and product/service launches, to enhance their presence in the market.
Berkeley Group - The company offers wellness real estate such as wellness suite, gym, cinema room, residents lounge, and concierge.
The market research and growth report includes detailed analyses of the competitive landscape of the market and information about key companies, including:
- CBRE Group Inc.
- Delos Living LLC
- DPZ CoDesign LLC
- EFFEKT Arkitekter ApS
- Gamuda Berhad
- GOCO HOSPITALITY
- Heta Architects
- Humaniti Montreal Inc.
- Jones Lang LaSalle Inc.
- Sansiri Public Co. Ltd.
- Signify NV
- Tata Housing Development Co. Ltd.
- Tokyu Land Corp.
- Welltower Inc.
Qualitative and quantitative analysis of companies has been conducted to help clients understand the wider business environment as well as the strengths and weaknesses of key market players. Data is qualitatively analyzed to categorize companies as pure play, category-focused, industry-focused, and diversified; it is quantitatively analyzed to categorize companies as dominant, leading, strong, tentative, and weak.
Latest Market Developments and News
-
In December 2024, a prominent real estate developer unveiled a new luxury wellness community designed with biophilic architecture and sustainable health-focused amenities. The community features air and water purification systems, fitness centers, and stress-reducing landscapes, catering to high-end buyers seeking holistic living environments.
-
In November 2024, a partnership was formed between a leading wellness brand and a global real estate firm to create integrated wellness spaces in residential properties. This collaboration focuses on offering smart homes equipped with fitness tracking devices, sleep optimization technology, and spa-like amenities to promote overall well-being.
-
In October 2024, a major real estate firm launched a new wellness-focused apartment complex that includes in-house fitness programs, meditation spaces, and on-demand health services. The project aims to meet the increasing demand for properties that support both physical and mental health.
-
In September 2024, a wellness real estate developer announced plans to build a luxury retreat center in a coastal location, featuring eco-friendly designs, organic food gardens, and yoga studios. The retreat aims to provide guests with a rejuvenating experience while promoting sustainability and healthy living.
Research Analyst Overview
The wellness movement has gained significant traction in recent years, with an increasing number of individuals prioritizing their health and wellbeing. This trend has extended beyond personal choices and is now influencing the real estate market, giving rise to wellness communities that offer a unique living experience. Wellness real estate encompasses residential properties and communities that integrate elements designed to promote healthy lifestyles, reduce stress, and improve overall wellbeing. These communities are not just about luxury and amenities; they go beyond the conventional to address various aspects of health, from environmental impacts to social connections. The demand for wellness communities is driven by several factors. Sedentary lifestyles and poor diet are leading causes of chronic diseases such as respiratory diseases and cardiovascular conditions. In response, people are seeking environments that encourage active living and healthy eating. These communities often feature outdoor recreational spaces, walking trails, and communal gardens, making it easier for residents to maintain an active lifestyle.
Moreover, the connection between mental health and the built environment is increasingly being recognized. Wellness communities prioritize stress reduction through design principles such as natural light, calming colors, and soothing sounds. These elements contribute to a sense of peace and tranquility, helping residents manage stress and improve their mental wellbeing. The importance of community interactions and social encounters in promoting health and happiness is another key factor driving the growth of wellness communities. These communities foster a sense of belonging and connection among residents, providing opportunities for meaningful social interactions. Wellness real estate also addresses environmental concerns. Eco-friendly homes and green constructions are becoming increasingly popular, with a focus on reducing greenhouse gas emissions and promoting biodiversity. These communities prioritize the use of renewable energy, sustainable building materials, and water conservation techniques. The market is diverse, catering to various demographics, including affluent foreign tourists, senior corporates, and urban youths.
|
Market Scope |
|
|
Report Coverage |
Details |
|
Page number |
182 |
|
Base year |
2024 |
|
Historic period |
2019-2023 |
|
Forecast period |
2025-2029 |
|
Growth momentum & CAGR |
Accelerate at a CAGR of 20.2% |
|
Market Growth 2025-2029 |
USD 768.6 billion |
|
Market structure |
Fragmented |
|
YoY growth 2024-2025(%) |
18.9 |
|
Key countries |
US, China, Japan, Canada, Germany, India, UK, South Korea, Australia, and France |
|
Competitive landscape |
Leading Companies, Market Positioning of Companies, Competitive Strategies, and Industry Risks |
What are the Key Data Covered in this Wellness Real Estate Market Research and Growth Report?
- CAGR of the market during the forecast period
- Detailed information on factors that will drive the market growth and forecasting between 2025 and 2029
- Precise estimation of the size of the market and its contribution of the market in focus to the parent market
- Accurate predictions about upcoming market growth and trends and changes in consumer behaviour
- Growth of the market across North America, APAC, Europe, Middle East and Africa, and South America
- Thorough analysis of the market's competitive landscape and detailed information about companies
- Comprehensive analysis of factors that will challenge the growth of market companies
We can help! Our analysts can customize this market research report to meet your requirements.
 RIA -
RIA - 
