Wet Waste Management Market Analysis APAC, Europe, North America, South America, Middle East and Africa - China, US, India, Germany, UK - Size and Forecast 2024-2028

Wet Waste Management Market Analysis APAC, Europe, North America, South America, Middle East and Africa - China, US, India, Germany, UK - Size and Forecast 2024-2028

Published: Jul 2024 171 Pages SKU: IRTNTR76018

Market Overview at a Glance

$45.8 B
Market Opportunity
5.97%
CAGR
5.29
YoY growth 2023-2024(%)

Wet Waste Management Market Size 2024-2028

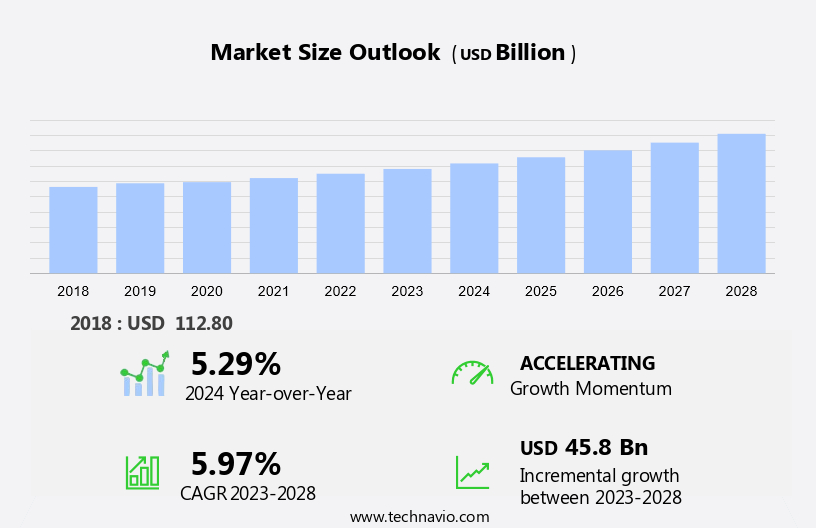
The wet waste management market size is forecast to increase by USD 45.8 billion at a CAGR of 5.97% between 2023 and 2028.

  • The market is experiencing significant growth due to several driving factors. Primarily, the increasing awareness for waste management and recycling is propelling market expansion. Additionally, the popularity of Integrated Waste Management Systems (IWMS) is gaining traction as an effective solution for managing wet waste. However, the market faces challenges such as high operating and maintenance costs, which can hinder market growth. Wet waste management refers to the collection, transportation, storage, sorting, processing, and disposal of biodegradable waste, including food scraps, meat, and bone forms, as well as agricultural waste and non-biodegradable waste such as shredded papers. To mitigate these challenges, market participants are investing in advanced technologies and exploring innovative business models to optimize costs and improve efficiency. Overall, the market is poised for steady growth as governments and businesses prioritize sustainable waste management practices.

What will be the Size of the Wet Waste Management Market During the Forecast Period?

Wet Waste Management Market Size

 Request Free Sample

  • Wet waste management has gained significant attention in recent years due to the increasing generation of biodegradable waste from various sources such as food scrap, meat, bone forms, and agricultural waste. The presence of water in wet waste makes its management more complex compared to dry waste. The lockdown imposed due to the global pandemic has led to an increase in residential waste generation, particularly wet waste, due to the rise in home cooking and increased consumption of packaged food. Public committees and municipalities are taking initiatives to manage wet waste through various methods such as composting and waste recycling.
  • Composting converts organic waste into nutrient-rich soil, reducing the need for chemical fertilizers. The waste recycling industry is witnessing significant growth due to the increasing focus on sustainable waste management practices. Municipalities and factories are investing in waste management infrastructure such as balers, compactors, shredders, and collection vehicles to efficiently manage wet waste. Disposal and landfill are the traditional methods for managing non-biodegradable waste, but there is a growing trend towards recycling and reusing such waste. Reports that The market is expected to grow at a CAGR of over 5% during the forecast period. The market is driven by the increasing awareness of the environmental impact of waste and the need for sustainable waste management practices. The market is also influenced by the stringent regulations imposed by governments to reduce the amount of waste sent to landfills.

How is this Wet Waste Management Industry segmented and which is the largest segment?

The industry research report provides comprehensive data (region-wise segment analysis), with forecasts and estimates in "USD billion" for the period 2024-2028, as well as historical data from 2018-2022 for the following segments.
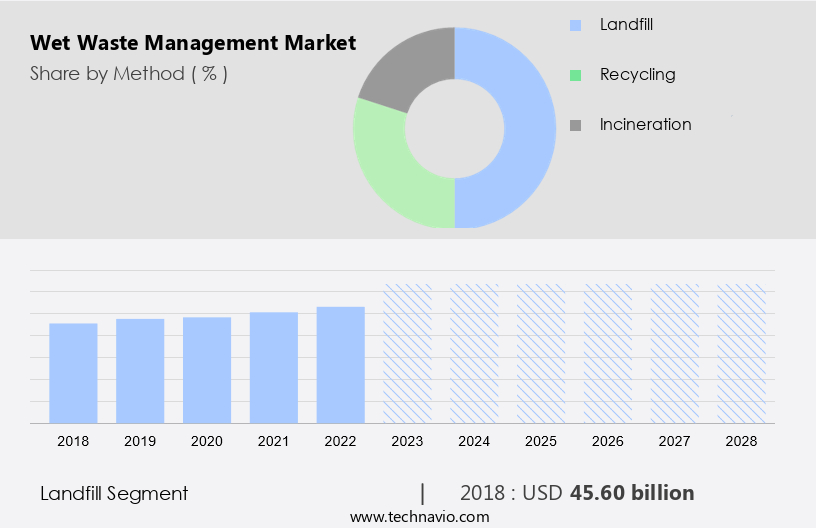
  • Method
    • Landfill
    • Recycling
    • Incineration
  • Service
    • Processing
    • Collection and transportation
    • Disposal and landfill
    • Sorting
    • Storage
  • Geography
    • APAC
      • China
      • India
    • Europe
      • Germany
      • UK
    • North America
      • US
    • South America
    • Middle East and Africa

By Method Insights

  • The landfill segment is estimated to witness significant growth during the forecast period. It encompasses the collection, transportation, storage, sorting, processing, and disposal of biodegradable and non-biodegradable waste. Biodegradable waste, including food scraps, meat, and bone fragments, is typically managed through composting or anaerobic digestion to produce environmentally friendly fuels and fertilizers. In contrast, non-biodegradable waste, such as shredded papers and electronic products, is often recycled using various recycling methods. During the lockdown, there has been a significant increase in household, municipal, commercial, industrial, healthcare, and agricultural waste generation. Public committees and municipalities have taken measures to ensure efficient collection and transportation of wet waste. Waste management companies have implemented sorting and processing techniques to minimize the amount of waste sent to landfills.
  • Landfills are used for disposal and serve as the final destination for wet waste. These sites are engineered pits with layers of solid waste that are filled, compacted, and covered for final disposal. Wet waste, including food waste and animal manure, is buried in landfills and breaks down at a slow rate. However, the remains can produce nauseous odors and attract rodents and seagulls, leading to environmental issues. To prevent these problems, a layer of soil is added daily to cover the garbage. Alternative methods include composting, which is an environmentally sustainable solution for managing food waste in residential areas and factories. Waste to energy technologies, such as anaerobic digestion and pyrolysis, convert wet waste into valuable resources, including biogas, electricity, and fertilizers. These methods reduce the amount of waste sent to landfills and promote environmental sustainability.

Wet Waste Management Market Size

Get a glance at the market report of share of various segments Request Free Sample

  • The landfill segment was valued at USD 45.60 billion in 2018 and showed a gradual increase during the forecast period. Furthermore, waste-to-energy technologies, such as anaerobic digestion and pyrolysis, convert wet waste into valuable resources, including biogas, smart waste management,  electricity, and fertilizers. Thus, effective wet waste management is crucial for reducing the environmental impact of waste generation and promoting sustainable practices. The waste management industry continues to innovate and explore new technologies and methods for managing wet waste, including composting, waste to energy, and recycling. By implementing these solutions, we can minimize the amount of waste sent to landfills and promote a more sustainable future.

Regional Analysis

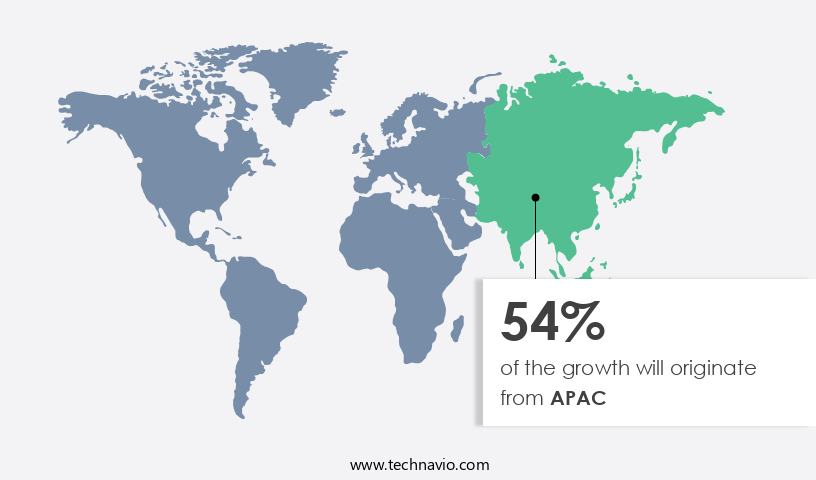
  • APAC is estimated to contribute 54% to the growth of the global market during the forecast period. Technavio's analysts have elaborately explained the regional trends and drivers that shape the market during the forecast period. The market is witnessing significant growth due to increasing government regulations and efforts towards reducing carbon dioxide emissions. Key equipment used in this market include Shredders, Crushers, and Digesters for the initial processing of wet waste.

Wet Waste Management Market Share by Geography

For more insights on the market size of various regions, Request Free Sample

  • Further down the line, Separators, Scrubbers, and Precipitators are employed for the separation and treatment of wastewater. Government initiatives, such as the Swatch Bharat Initiative, are driving the adoption of the solutions. The flagship program aims to eliminate the use of Disposal Landfills and promote organic recycling instead. Monetary incentives for private players and technology launches are also contributing to the market's expansion. Asia-Pacific is the leading region for the liquid waste management market, driven by rapid urbanization and increasing population. 
  • However, the lack of participants In the market poses a challenge. This is due to the high initial investment required for setting up treatment plants and landfill sites. Moreover, the use of biodegradable fuels in Combustors and Gas Storage Equipment is gaining popularity as an alternative to traditional fossil fuels. Advertising and social networking platforms are being utilized to create awareness about the importance. Government regulations and technology advancements are expected to continue driving the market's growth In the coming years. CalRecycle, a leading regulatory body, is working towards implementing stringent regulations to ensure effective wet waste management.

Market Dynamics

Our researchers analyzed the data with 2023 as the base year, along with the key drivers, trends, and challenges. A holistic analysis of drivers will help companies refine their marketing strategies to gain a competitive advantage.

What are the key market drivers leading to the rise In the adoption of Wet Waste Management Industry?

  • The growing awareness for wet waste management and recycling is the key driver of the market. The market is experiencing significant growth due to increasing public awareness and initiatives towards environmentally friendly practices. Biodegradable waste, including food scraps and agricultural waste, as well as non-biodegradable waste such as plastic, bones, and shredded papers, are key components of wet waste. Waste management in residential areas, factories, and commercial establishments generates a substantial amount of wet waste. Municipalities and public committees are implementing collection and transportation systems, along with storage facilities and sorting processes, to manage this waste effectively. Processing methods, such as composting and waste-to-energy, are being adopted to convert wet waste into environmentally friendly fuels and products.
  • Recycling methods, including those for electronic products, are also gaining popularity In the waste recycling industry. Governmental bodies and NGOs are promoting awareness campaigns to educate the public about the importance of wet waste management and the advantages of composting, recycling, and disposal methods other than landfills. Balers and compactors are essential tools used In the efficient handling and transportation of wet waste. Overall, the market is expected to continue growing due to the increasing focus on environmental sustainability and the development of advanced waste management technologies.

What are the market trends shaping the Wet Waste Management Industry?

  • An increasing popularity of IWMS is the upcoming market trend. It is a critical aspect of sustainable waste disposal, focusing on the efficient handling of biodegradable waste, which includes food scraps, agricultural waste, and meat and bone forms. The Integrated Waste Management System (IWMS) is a comprehensive approach to managing wet waste, encompassing collection, transportation, storage, sorting, processing, and disposal. IWMS promotes environmental benefits, economic optimization, and social acceptability by transforming wet waste from a liability into a resource. The organic component of the waste undergoes anaerobic processing, such as composting and biogas production, to generate environmentally friendly fuels. In contrast, non-biodegradable waste, including shredded papers, electronic products, and plastic, is directed toward recycling methods or disposal through landfills or incineration. Wet waste, trash bags including food waste and animal manure, is buried in landfills and break down at a slow rate.
  • Public committees and municipalities play a crucial role in implementing IWMS in residential areas, factories, and commercial and industrial sectors. Waste management companies and the waste recycling industry are integral to the success of IWMS, providing essential services like collection, baling, compacting, and disposal. By prioritizing wet waste management, we can minimize environmental impact, promote environmental sustainability, and ensure a cleaner, healthier community.

What challenges does the Wet Waste Management Industry face during its growth?

  • The high operating and maintenance costs is a key challenge affecting the industry growth. It encompasses the collection, transportation, storage, sorting, processing, and disposal of biodegradable and non-biodegradable waste, including food scraps, meat and bone forms, agricultural waste, medical waste, shredded papers, and other household, municipal, commercial, industrial, healthcare, and electronic waste. During the lockdown, public committees and municipalities have intensified their efforts to manage this waste in an environmentally sustainable manner. Composting is a popular method for treating biodegradable waste, while non-biodegradable waste is often sent to landfills or recycled using various recycling methods. In some countries, such as Japan, food waste is treated through incineration due to limited landfill space. The flagship program aims to eliminate the use of Disposal Landfills and promote organic recycling, household composite instead.
  • However, incineration plants require substantial capital investments and high operating and maintenance costs, which can hinder their widespread adoption. These costs depend on the plant size, design, local infrastructure, waste disposal facilities, and energy utilization capabilities. Moreover, incineration plants necessitate skilled personnel for operation and maintenance, making them a significant investment for waste management companies. Alternative methods include waste-to-energy technologies, which convert waste into environmentally friendly fuels. These methods include anaerobic digestion, gasification, and pyrolysis. Additionally, balers and compactors are used to reduce the volume of waste before transportation and disposal. The waste recycling industry continues to innovate, with new technologies and methods being developed to promote environmental sustainability in residential areas, factories, and other waste generation sites.

Exclusive Customer Landscape

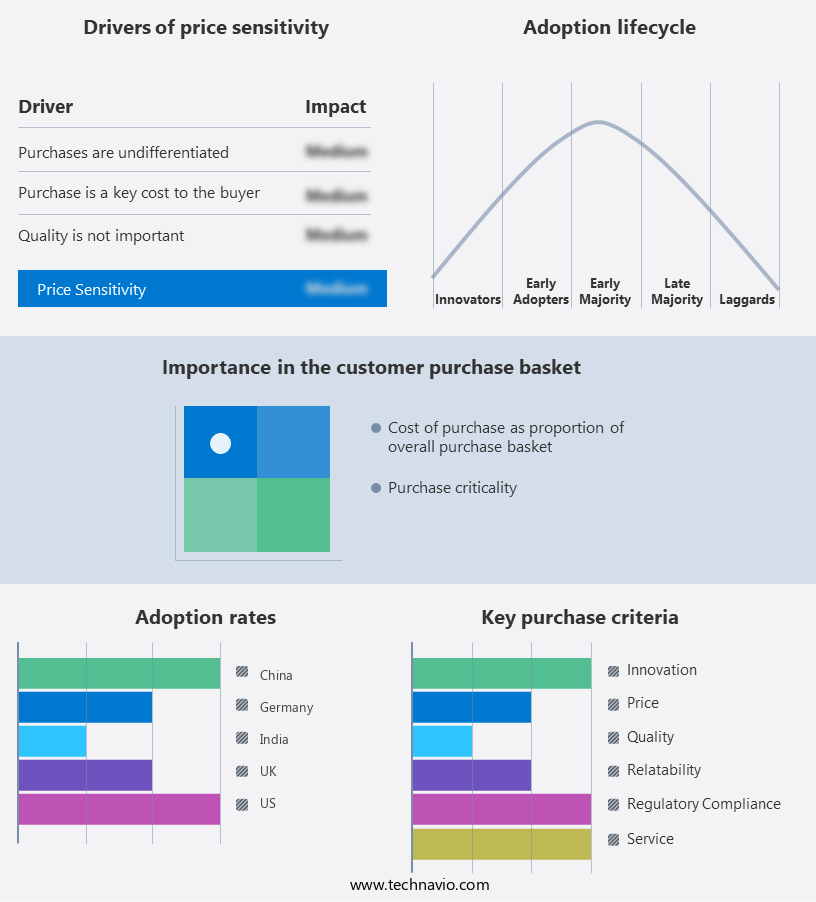
The market forecasting report includes the adoption lifecycle of the market, market growth and forecasting, covering from the innovator's stage to the laggard's stage. It focuses on adoption rates in different regions based on penetration. Furthermore, the market report also includes key purchase criteria and drivers of price sensitivity to help companies evaluate and develop their market growth analysis strategies.

Wet Waste Management Market Share by Geography

 Customer Landscape

Key Companies & Market Insights

Companies are implementing various strategies, such as strategic alliances, market forecast, partnerships, mergers and acquisitions, geographical expansion, and product/service launches, to enhance their presence In the industry. The industry research and growth report includes detailed analyses of the competitive landscape of the market and information about key companies, including:

  • Bertin Technologies SAS
  • Biffa Plc
  • Clean Harbors Inc.
  • Covanta Holding Corp.
  • Daiseki Co. Ltd.
  • Earthrecycler
  • Evac Oy
  • FCC SA
  • GEPIL
  • Hasiru Dala Innovations Pvt. Ltd.
  • Hitachi Zosen Corp.
  •  ProEarth Ecosystems Pvt. Ltd.
  • Republic Services Inc.
  • RETHMANN SE and Co. KG
  • SAAHAS WASTE MANAGEMENT Pvt. Ltd.
  • Stericycle Inc.
  • SUEZ SA
  • Valicor Inc.
  • Veolia Environnement SA
  • Waste Management Inc.

Qualitative and quantitative analysis of companies has been conducted to help clients understand the wider business environment as well as the strengths and weaknesses of key industry players. Data is qualitatively analyzed to categorize companies as pure play, category-focused, industry-focused, and diversified; it is quantitatively analyzed to categorize companies as dominant, leading, strong, tentative, and weak.

Research Analyst Overview

The market is growing due to increasing environmental awareness and the need for environmental sustainability. The COVID-19 lockdown has led to an increase in household waste generation, putting pressure on municipalities and public committees to implement effective solutions. Composting is a popular method for managing biodegradable waste, while waste-to-energy technologies convert wet waste into environmentally friendly fuels. Municipal solid waste management and factories are investing in waste management infrastructure such as balers, compactors, shredders, and collection vehicles to efficiently manage wet waste. Disposal and landfill gas are the traditional methods for managing non-biodegradable waste, but there is a growing trend towards recycling and reusing such waste. Waste management companies are investing in advanced recycling methods for electronic products and other materials.

The waste recycling industry is also exploring the use of balers and compactors to optimize the collection and transportation of wet waste. Municipalities, commercial entities, and industrial facilities generate significant amounts of wet waste, making it essential to establish efficient and sustainable management systems for household waste, municipal waste, commercial waste, industrial waste, and healthcare waste. Waste disposal and landfill are no longer considered viable long-term solutions due to their negative environmental impact. Instead, industry experts are advocating for the use of environmentally friendly products and technologies to ensure the sustainable management of wet waste. The market is expected to grow significantly In the coming years, driven by the increasing demand for environmentally sustainable solutions and the need to reduce the environmental impact of waste disposal. The use of waste to energy technologies and the production of environmentally friendly fuels are also expected to gain popularity as the world moves towards a more sustainable future.

Market Scope

Report Coverage

Details

Page number

171

Base year

2023

Historic period

2018-2022

Forecast period

2024-2028

Growth momentum & CAGR

Accelerate at a CAGR of 5.97%

Market growth 2024-2028

USD 45.8 billion

Market structure

Fragmented

YoY growth 2023-2024(%)

5.29

Key countries

China, US, India, Germany, and UK

Competitive landscape

Leading Companies, Market Positioning of Companies, Competitive Strategies, and Industry Risks

Request Free Sample

What are the Key Data Covered in this Market Research and Growth Report?

  • CAGR of the industry during the forecast period
  • Detailed information on factors that will drive the growth and forecasting between 2024 and 2028
  • Precise estimation of the size of the market and its contribution of the industry in focus to the parent market
  • Accurate predictions about upcoming growth and trends and changes in consumer behaviour
  • Growth of the market across APAC, Europe, North America, South America, and Middle East and Africa
  • Thorough analysis of the market's competitive landscape and detailed information about companies
  • Comprehensive analysis of factors that will challenge the market growth of industry companies

We can help! Our analysts can customize this market research report to meet your requirements.

Get in touch

1 Executive Summary

  • 1.1 Market overview
    • Executive Summary - Chart on Market Overview
    • Executive Summary - Data Table on Market Overview
    • Executive Summary - Chart on Global Market Characteristics
    • Executive Summary - Chart on Market by Geography
    • Executive Summary - Chart on Market Segmentation by Method
    • Executive Summary - Chart on Market Segmentation by Service
    • Executive Summary - Chart on Incremental Growth
    • Executive Summary - Data Table on Incremental Growth
    • Executive Summary - Chart on Company Market Positioning

2 Market Landscape

  • 2.1 Market ecosystem
    • Parent Market
    • Data Table on - Parent Market
  • 2.2 Market characteristics
    • Market characteristics analysis
  • 2.3 Value chain analysis
    • Value Chain Analysis

3 Market Sizing

  • 3.1 Market definition
    • Offerings of companies included in the market definition
  • 3.2 Market segment analysis
    • Market segments
  • 3.3 Market size 2023
    • 3.4 Market outlook: Forecast for 2023-2028
      • Chart on Global - Market size and forecast 2023-2028 ($ billion)
      • Data Table on Global - Market size and forecast 2023-2028 ($ billion)
      • Chart on Global Market: Year-over-year growth 2023-2028 (%)
      • Data Table on Global Market: Year-over-year growth 2023-2028 (%)

    4 Historic Market Size

    • 4.1 Global Wet Waste Management Market 2018 - 2022
      • Historic Market Size - Data Table on Global Wet Waste Management Market 2018 - 2022 ($ billion)
    • 4.2 Method segment analysis 2018 - 2022
      • Historic Market Size - Method Segment 2018 - 2022 ($ billion)
    • 4.3 Service segment analysis 2018 - 2022
      • Historic Market Size - Service Segment 2018 - 2022 ($ billion)
    • 4.4 Geography segment analysis 2018 - 2022
      • Historic Market Size - Geography Segment 2018 - 2022 ($ billion)
    • 4.5 Country segment analysis 2018 - 2022
      • Historic Market Size - Country Segment 2018 - 2022 ($ billion)

    5 Five Forces Analysis

    • 5.1 Five forces summary
      • Five forces analysis - Comparison between 2023 and 2028
    • 5.2 Bargaining power of buyers
      • Bargaining power of buyers - Impact of key factors 2023 and 2028
    • 5.3 Bargaining power of suppliers
      • Bargaining power of suppliers - Impact of key factors in 2023 and 2028
    • 5.4 Threat of new entrants
      • Threat of new entrants - Impact of key factors in 2023 and 2028
    • 5.5 Threat of substitutes
      • Threat of substitutes - Impact of key factors in 2023 and 2028
    • 5.6 Threat of rivalry
      • Threat of rivalry - Impact of key factors in 2023 and 2028
    • 5.7 Market condition
      • Chart on Market condition - Five forces 2023 and 2028

    6 Market Segmentation by Method

    • 6.1 Market segments
      • Chart on Method - Market share 2023-2028 (%)
      • Data Table on Method - Market share 2023-2028 (%)
    • 6.2 Comparison by Method
      • Chart on Comparison by Method
      • Data Table on Comparison by Method
    • 6.3 Landfill - Market size and forecast 2023-2028
      • Chart on Landfill - Market size and forecast 2023-2028 ($ billion)
      • Data Table on Landfill - Market size and forecast 2023-2028 ($ billion)
      • Chart on Landfill - Year-over-year growth 2023-2028 (%)
      • Data Table on Landfill - Year-over-year growth 2023-2028 (%)
    • 6.4 Recycling - Market size and forecast 2023-2028
      • Chart on Recycling - Market size and forecast 2023-2028 ($ billion)
      • Data Table on Recycling - Market size and forecast 2023-2028 ($ billion)
      • Chart on Recycling - Year-over-year growth 2023-2028 (%)
      • Data Table on Recycling - Year-over-year growth 2023-2028 (%)
    • 6.5 Incineration - Market size and forecast 2023-2028
      • Chart on Incineration - Market size and forecast 2023-2028 ($ billion)
      • Data Table on Incineration - Market size and forecast 2023-2028 ($ billion)
      • Chart on Incineration - Year-over-year growth 2023-2028 (%)
      • Data Table on Incineration - Year-over-year growth 2023-2028 (%)
    • 6.6 Market opportunity by Method
      • Market opportunity by Method ($ billion)
      • Data Table on Market opportunity by Method ($ billion)

    7 Market Segmentation by Service

    • 7.1 Market segments
      • Chart on Service - Market share 2023-2028 (%)
      • Data Table on Service - Market share 2023-2028 (%)
    • 7.2 Comparison by Service
      • Chart on Comparison by Service
      • Data Table on Comparison by Service
    • 7.3 Processing - Market size and forecast 2023-2028
      • Chart on Processing - Market size and forecast 2023-2028 ($ billion)
      • Data Table on Processing - Market size and forecast 2023-2028 ($ billion)
      • Chart on Processing - Year-over-year growth 2023-2028 (%)
      • Data Table on Processing - Year-over-year growth 2023-2028 (%)
    • 7.4 Collection and transportation - Market size and forecast 2023-2028
      • Chart on Collection and transportation - Market size and forecast 2023-2028 ($ billion)
      • Data Table on Collection and transportation - Market size and forecast 2023-2028 ($ billion)
      • Chart on Collection and transportation - Year-over-year growth 2023-2028 (%)
      • Data Table on Collection and transportation - Year-over-year growth 2023-2028 (%)
    • 7.5 Disposal and landfill - Market size and forecast 2023-2028
      • Chart on Disposal and landfill - Market size and forecast 2023-2028 ($ billion)
      • Data Table on Disposal and landfill - Market size and forecast 2023-2028 ($ billion)
      • Chart on Disposal and landfill - Year-over-year growth 2023-2028 (%)
      • Data Table on Disposal and landfill - Year-over-year growth 2023-2028 (%)
    • 7.6 Sorting - Market size and forecast 2023-2028
      • Chart on Sorting - Market size and forecast 2023-2028 ($ billion)
      • Data Table on Sorting - Market size and forecast 2023-2028 ($ billion)
      • Chart on Sorting - Year-over-year growth 2023-2028 (%)
      • Data Table on Sorting - Year-over-year growth 2023-2028 (%)
    • 7.7 Storage - Market size and forecast 2023-2028
      • Chart on Storage - Market size and forecast 2023-2028 ($ billion)
      • Data Table on Storage - Market size and forecast 2023-2028 ($ billion)
      • Chart on Storage - Year-over-year growth 2023-2028 (%)
      • Data Table on Storage - Year-over-year growth 2023-2028 (%)
    • 7.8 Market opportunity by Service
      • Market opportunity by Service ($ billion)
      • Data Table on Market opportunity by Service ($ billion)

    8 Customer Landscape

    • 8.1 Customer landscape overview
      • Analysis of price sensitivity, lifecycle, customer purchase basket, adoption rates, and purchase criteria

    9 Geographic Landscape

    • 9.1 Geographic segmentation
      • Chart on Market share by geography 2023-2028 (%)
      • Data Table on Market share by geography 2023-2028 (%)
    • 9.2 Geographic comparison
      • Chart on Geographic comparison
      • Data Table on Geographic comparison
    • 9.3 APAC - Market size and forecast 2023-2028
      • Chart on APAC - Market size and forecast 2023-2028 ($ billion)
      • Data Table on APAC - Market size and forecast 2023-2028 ($ billion)
      • Chart on APAC - Year-over-year growth 2023-2028 (%)
      • Data Table on APAC - Year-over-year growth 2023-2028 (%)
    • 9.4 Europe - Market size and forecast 2023-2028
      • Chart on Europe - Market size and forecast 2023-2028 ($ billion)
      • Data Table on Europe - Market size and forecast 2023-2028 ($ billion)
      • Chart on Europe - Year-over-year growth 2023-2028 (%)
      • Data Table on Europe - Year-over-year growth 2023-2028 (%)
    • 9.5 North America - Market size and forecast 2023-2028
      • Chart on North America - Market size and forecast 2023-2028 ($ billion)
      • Data Table on North America - Market size and forecast 2023-2028 ($ billion)
      • Chart on North America - Year-over-year growth 2023-2028 (%)
      • Data Table on North America - Year-over-year growth 2023-2028 (%)
    • 9.6 South America - Market size and forecast 2023-2028
      • Chart on South America - Market size and forecast 2023-2028 ($ billion)
      • Data Table on South America - Market size and forecast 2023-2028 ($ billion)
      • Chart on South America - Year-over-year growth 2023-2028 (%)
      • Data Table on South America - Year-over-year growth 2023-2028 (%)
    • 9.7 Middle East and Africa - Market size and forecast 2023-2028
      • Chart on Middle East and Africa - Market size and forecast 2023-2028 ($ billion)
      • Data Table on Middle East and Africa - Market size and forecast 2023-2028 ($ billion)
      • Chart on Middle East and Africa - Year-over-year growth 2023-2028 (%)
      • Data Table on Middle East and Africa - Year-over-year growth 2023-2028 (%)
    • 9.8 China - Market size and forecast 2023-2028
      • Chart on China - Market size and forecast 2023-2028 ($ billion)
      • Data Table on China - Market size and forecast 2023-2028 ($ billion)
      • Chart on China - Year-over-year growth 2023-2028 (%)
      • Data Table on China - Year-over-year growth 2023-2028 (%)
    • 9.9 US - Market size and forecast 2023-2028
      • Chart on US - Market size and forecast 2023-2028 ($ billion)
      • Data Table on US - Market size and forecast 2023-2028 ($ billion)
      • Chart on US - Year-over-year growth 2023-2028 (%)
      • Data Table on US - Year-over-year growth 2023-2028 (%)
    • 9.10 India - Market size and forecast 2023-2028
      • Chart on India - Market size and forecast 2023-2028 ($ billion)
      • Data Table on India - Market size and forecast 2023-2028 ($ billion)
      • Chart on India - Year-over-year growth 2023-2028 (%)
      • Data Table on India - Year-over-year growth 2023-2028 (%)
    • 9.11 Germany - Market size and forecast 2023-2028
      • Chart on Germany - Market size and forecast 2023-2028 ($ billion)
      • Data Table on Germany - Market size and forecast 2023-2028 ($ billion)
      • Chart on Germany - Year-over-year growth 2023-2028 (%)
      • Data Table on Germany - Year-over-year growth 2023-2028 (%)
    • 9.12 UK - Market size and forecast 2023-2028
      • Chart on UK - Market size and forecast 2023-2028 ($ billion)
      • Data Table on UK - Market size and forecast 2023-2028 ($ billion)
      • Chart on UK - Year-over-year growth 2023-2028 (%)
      • Data Table on UK - Year-over-year growth 2023-2028 (%)
    • 9.13 Market opportunity by geography
      • Market opportunity by geography ($ billion)
      • Data Tables on Market opportunity by geography ($ billion)

    10 Drivers, Challenges, and Opportunity/Restraints

    • 10.1 Market drivers
      • 10.2 Market challenges
        • 10.3 Impact of drivers and challenges
          • Impact of drivers and challenges in 2023 and 2028
        • 10.4 Market opportunities/restraints

          11 Competitive Landscape

          • 11.1 Overview
            • 11.2 Competitive Landscape
              • Overview on criticality of inputs and factors of differentiation
            • 11.3 Landscape disruption
              • Overview on factors of disruption
            • 11.4 Industry risks
              • Impact of key risks on business

            12 Competitive Analysis

            • 12.1 Companies profiled
              • Companies covered
            • 12.2 Market positioning of companies
              • Matrix on companies position and classification
            • 12.3 Bertin Technologies SAS
              • Bertin Technologies SAS - Overview
              • Bertin Technologies SAS - Product / Service
              • Bertin Technologies SAS - Key news
              • Bertin Technologies SAS - Key offerings
            • 12.4 Biffa Plc
              • Biffa Plc - Overview
              • Biffa Plc - Product / Service
              • Biffa Plc - Key news
              • Biffa Plc - Key offerings
            • 12.5 Clean Harbors Inc.
              • Clean Harbors Inc. - Overview
              • Clean Harbors Inc. - Business segments
              • Clean Harbors Inc. - Key news
              • Clean Harbors Inc. - Key offerings
              • Clean Harbors Inc. - Segment focus
            • 12.6 Covanta Holding Corp.
              • Covanta Holding Corp. - Overview
              • Covanta Holding Corp. - Product / Service
              • Covanta Holding Corp. - Key offerings
            • 12.7 Daiseki Co. Ltd.
              • Daiseki Co. Ltd. - Overview
              • Daiseki Co. Ltd. - Product / Service
              • Daiseki Co. Ltd. - Key offerings
            • 12.8 FCC SA
              • FCC SA - Overview
              • FCC SA - Business segments
              • FCC SA - Key news
              • FCC SA - Key offerings
              • FCC SA - Segment focus
            • 12.9 GEPIL
              • GEPIL - Overview
              • GEPIL - Product / Service
              • GEPIL - Key offerings
            • 12.10 Hitachi Zosen Corp.
              • Hitachi Zosen Corp. - Overview
              • Hitachi Zosen Corp. - Business segments
              • Hitachi Zosen Corp. - Key news
              • Hitachi Zosen Corp. - Key offerings
              • Hitachi Zosen Corp. - Segment focus
            • 12.11 Republic Services Inc.
              • Republic Services Inc. - Overview
              • Republic Services Inc. - Business segments
              • Republic Services Inc. - Key news
              • Republic Services Inc. - Key offerings
              • Republic Services Inc. - Segment focus
            • 12.12 RETHMANN SE and Co. KG
              • RETHMANN SE and Co. KG - Overview
              • RETHMANN SE and Co. KG - Product / Service
              • RETHMANN SE and Co. KG - Key offerings
            • 12.13 Stericycle Inc.
              • Stericycle Inc. - Overview
              • Stericycle Inc. - Business segments
              • Stericycle Inc. - Key offerings
              • Stericycle Inc. - Segment focus
            • 12.14 SUEZ SA
              • SUEZ SA - Overview
              • SUEZ SA - Product / Service
              • SUEZ SA - Key news
              • SUEZ SA - Key offerings
            • 12.15 Valicor Inc.
              • Valicor Inc. - Overview
              • Valicor Inc. - Product / Service
              • Valicor Inc. - Key offerings
            • 12.16 Veolia Environnement SA
              • Veolia Environnement SA - Overview
              • Veolia Environnement SA - Business segments
              • Veolia Environnement SA - Key news
              • Veolia Environnement SA - Key offerings
              • Veolia Environnement SA - Segment focus
            • 12.17 Waste Management Inc.
              • Waste Management Inc. - Overview
              • Waste Management Inc. - Business segments
              • Waste Management Inc. - Key news
              • Waste Management Inc. - Key offerings
              • Waste Management Inc. - Segment focus

            13 Appendix

            • 13.1 Scope of the report
              • 13.2 Inclusions and exclusions checklist
                • Inclusions checklist
                • Exclusions checklist
              • 13.3 Currency conversion rates for US$
                • Currency conversion rates for US$
              • 13.4 Research methodology
                • Research methodology
              • 13.5 Data procurement
                • Information sources
              • 13.6 Data validation
                • Data validation
              • 13.7 Validation techniques employed for market sizing
                • Validation techniques employed for market sizing
              • 13.8 Data synthesis
                • Data synthesis
              • 13.9 360 degree market analysis
                • 360 degree market analysis
              • 13.10 List of abbreviations
                • List of abbreviations

              Research Methodology

              Technavio presents a detailed picture of the market by way of study, synthesis, and summation of data from multiple sources. The analysts have presented the various facets of the market with a particular focus on identifying the key industry influencers. The data thus presented is comprehensive, reliable, and the result of extensive research, both primary and secondary.

              INFORMATION SOURCES

              Primary sources

              • Manufacturers and suppliers
              • Channel partners
              • Industry experts
              • Strategic decision makers

              Secondary sources

              • Industry journals and periodicals
              • Government data
              • Financial reports of key industry players
              • Historical data
              • Press releases

              DATA ANALYSIS

              Data Synthesis

              • Collation of data
              • Estimation of key figures
              • Analysis of derived insights

              Data Validation

              • Triangulation with data models
              • Reference against proprietary databases
              • Corroboration with industry experts

              REPORT WRITING

              Qualitative

              • Market drivers
              • Market challenges
              • Market trends
              • Five forces analysis

              Quantitative

              • Market size and forecast
              • Market segmentation
              • Geographical insights
              • Competitive landscape

              Interested in this report?

              Get your sample now to see our research methodology and insights!

              Download Now

              Frequently Asked Questions

              Wet Waste Management market growth will increase by $ 45.8 bn during 2024-2028 .

              The Wet Waste Management market is expected to grow at a CAGR of 5.97% during 2024-2028 .

              Wet Waste Management market is segmented by Method( Landfill, Recycling, Incineration) Service( Processing, Collection and transportation, Disposal and landfill, Sorting, Storage)

              Bertin Technologies SAS, Biffa Plc, Clean Harbors Inc., Covanta Holding Corp., Daiseki Co. Ltd., Earthrecycler, Evac Oy, FCC SA, GEPIL, Hasiru Dala Innovations Pvt. Ltd., Hitachi Zosen Corp.,  ProEarth Ecosystems Pvt. Ltd., Republic Services Inc., RETHMANN SE and Co. KG, SAAHAS WASTE MANAGEMENT Pvt. Ltd., Stericycle Inc., SUEZ SA, Valicor Inc., Veolia Environnement SA, Waste Management Inc. are a few of the key vendors in the Wet Waste Management market.

              APAC will register the highest growth rate of 54% among the other regions. Therefore, the Wet Waste Management market in APAC is expected to garner significant business opportunities for the vendors during the forecast period.

              China, US, India, Germany, UK

              • Growing awareness for wet waste management and recyclingAwareness about wet waste management in the public is growing day by day through various programs is the driving factor this market.
              • advertisements is the driving factor this market.
              • and social networking sites is the driving factor this market.
              • which are expected to enhance the overall wet waste management market during the forecast period.  The development of waste-to-energy will further drive the global wet waste management market during the forecast period. Recycling is one of the crucial aspects of waste management. Institutions such as non-governmental organizations (NGOs) is the driving factor this market.
              • civic municipalities is the driving factor this market.
              • and governments are leveraging various channels of communication is the driving factor this market.
              • such as social media is the driving factor this market.
              • schools is the driving factor this market.
              • community drives is the driving factor this market.
              • and others is the driving factor this market.
              • in order to create awareness about recycling and wet waste management of the advantages of wet waste management and wet waste recycling methodologies. Factors such as a rise in the sharing economy is the driving factor this market.
              • the need for soil quality management is the driving factor this market.
              • the need for cost-effective manure production on-site is the driving factor this market.
              • and growing interest in household gardening are supported by the manure extracted from proper wet waste management. These encourage people to utilize garden spaces for healthy food-growing activities like growing organic vegetables. It also increases the number of household floriculture hobbyists and leads to a surge in the adoption of small farms. These contribute to the adoption of wet waste recycling as a potential means of sourcing organic compost. Therefore is the driving factor this market.
              • the factors like growing awareness of wet waste management and recycling encourage the growth of the global wet waste management market during the forecast period. is the driving factor this market.

              The Wet Waste Management market vendors should focus on grabbing business opportunities from the Landfill segment as it accounted for the largest market share in the base year.