Workspace Delivery Network Market Analysis North America, Europe, APAC, South America, Middle East and Africa - US, China, Germany, Canada, UK, France, Japan, Italy, India, The Netherlands - Size and Forecast 2025-2029

Workspace Delivery Network Market Analysis North America, Europe, APAC, South America, Middle East and Africa - US, China, Germany, Canada, UK, France, Japan, Italy, India, The Netherlands - Size and Forecast 2025-2029

Published: Mar 2025 219 Pages SKU: IRTNTR43638

Market Overview at a Glance

$45.57 B
Market Opportunity
34.3%
CAGR
33.1
YoY growth 2024-2025(%)

Workspace Delivery Network Market Size 2025-2029

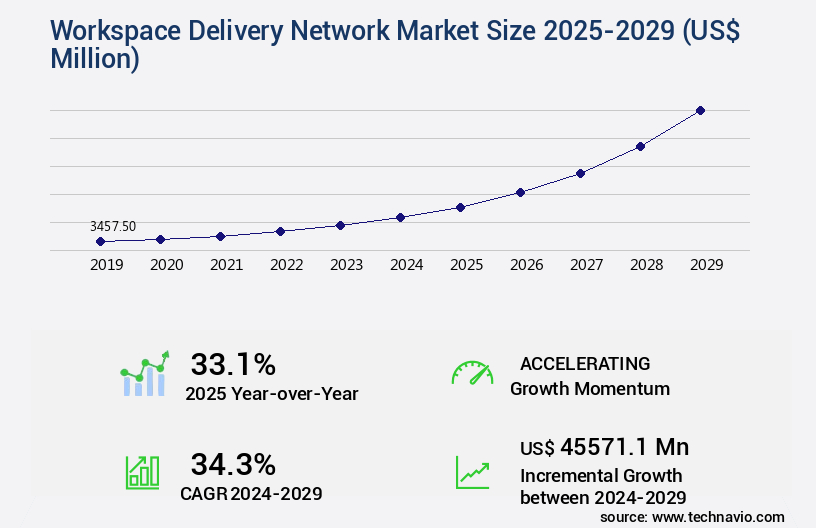
The workspace delivery network market size is valued to increase USD 45.57 billion, at a CAGR of 34.3% from 2024 to 2029. Increasing demand for cloud-based solutions will drive the workspace delivery network market.

Major Market Trends & Insights

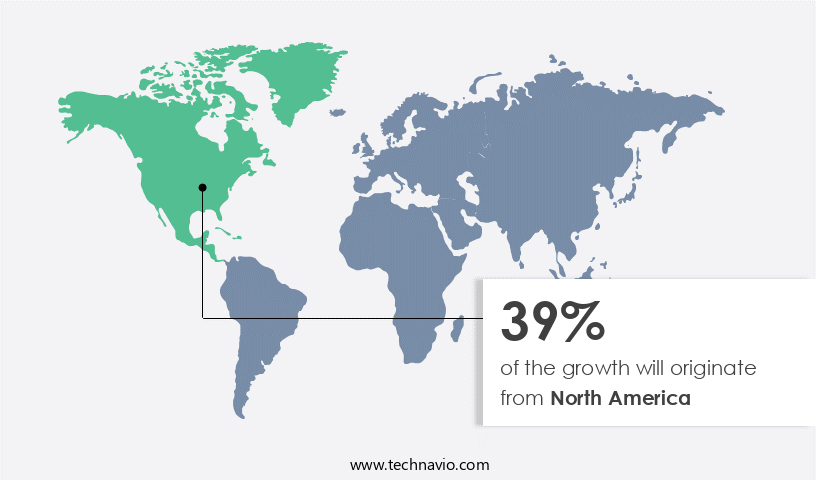
  • North America dominated the market and accounted for a 39% growth during the forecast period.
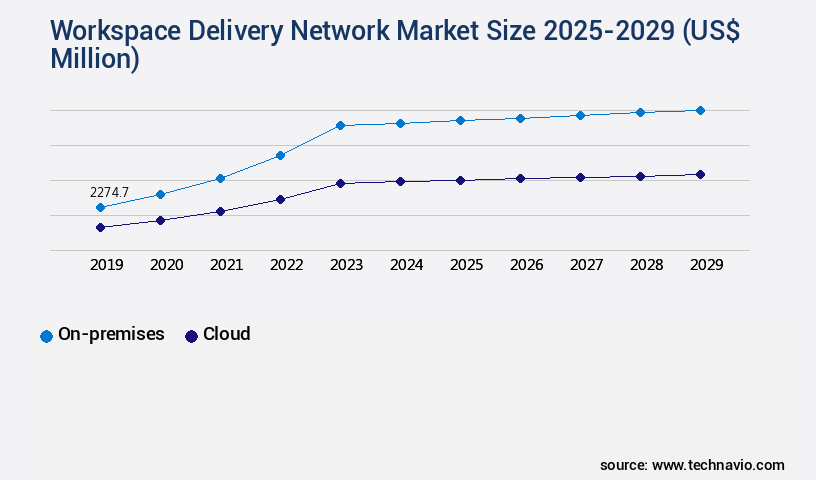
  • By Deployment - On-premises segment was valued at USD 2.27 billion in 2023
  • By Type - SD-WAN segment accounted for the largest market revenue share in 2023

Market Size & Forecast

  • Market Opportunities: USD 1.00 million
  • Market Future Opportunities: USD 45571.10 million
  • CAGR from 2024 to 2029 : 34.3%

Market Summary

  • In the dynamic digital landscape, the Workspace Delivery Network (WDN) market has emerged as a critical solution for businesses seeking to optimize their application delivery and enhance user experience. According to recent estimates, the global WDN market is projected to reach a value of USD 12.5 billion by 2025, underscoring its growing importance. The primary driver behind this growth is the increasing demand for cloud-based solutions, as businesses look to streamline their IT infrastructure and improve application accessibility. Additionally, the popularity of Software-Defined Wide Area Networking (SD-WAN) as a service is fueling the adoption of WDN, as it offers more efficient and cost-effective alternatives to traditional network delivery appliances.
  • Despite these opportunities, the WDN market faces challenges. High costs associated with network delivery appliances and the complexity of implementing and managing these solutions can hinder adoption. However, advancements in technology and increasing competition among companies are expected to mitigate these challenges, enabling the market to continue its upward trajectory. In conclusion, the WDN market is poised for significant growth, driven by the shift to cloud-based solutions and the adoption of SD-WAN. While challenges remain, the market's potential to enhance application delivery and improve user experience makes it an essential consideration for businesses seeking to stay competitive in today's digital economy.

What will be the Size of the Workspace Delivery Network Market during the forecast period?

Workspace Delivery Network Market Size

Get Key Insights on Market Forecast (PDF) Request Free Sample

How is the Workspace Delivery Network Market Segmented?

The workspace delivery network industry research report provides comprehensive data (region-wise segment analysis), with forecasts and estimates in "USD million" for the period 2025-2029, as well as historical data from 2019-2023 for the following segments.

  • Deployment
    • On-premises
    • Cloud
  • Type
    • SD-WAN
    • Traditional WAN
  • Application
    • IT and telecommunication
    • Government institutions
    • Research and consulting services
    • Others
  • Geography
    • North America
      • US
      • Canada
    • Europe
      • France
      • Germany
      • Italy
      • The Netherlands
      • UK
    • APAC
      • China
      • India
      • Japan
    • Rest of World (ROW)

By Deployment Insights

The on-premises segment is estimated to witness significant growth during the forecast period.

The market is characterized by its continuous evolution, with ongoing activities and emerging patterns shaping its landscape. Traditional on-premises solutions, which involve purchasing and installing software on an organization's servers, account for a significant market share. However, this segment is projected to decline due to the high cost of implementation and limited scalability. Conversely, cloud-based solutions, offering scalable infrastructure, secure remote access via site-to-site VPN and remote access protocols, and high availability design, are gaining traction. Network performance monitoring, application delivery, and data center optimization are key functionalities driving market growth. Hybrid cloud deployments, edge computing solutions, and software-defined networking are emerging trends, with elastic compute resources, content caching, and data loss prevention enhancing user experience.

Workspace Delivery Network Market Size

Request Free Sample

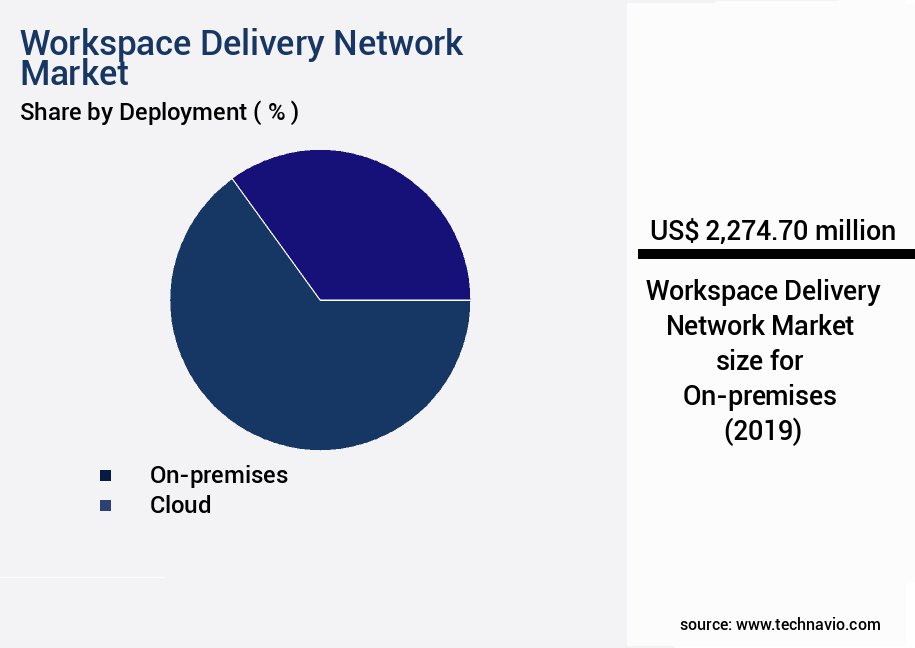
The On-premises segment was valued at USD 2.27 billion in 2019 and showed a gradual increase during the forecast period.

Network security protocols, network traffic analysis, and network virtualization ensure quality of service, while centralized management and server load balancing optimize IT infrastructure. This growth is attributed to the increasing demand for application performance management, network topology design, and disaster recovery planning. Despite the advantages of cloud-based solutions, on-premises solutions remain popular due to their enhanced security and control over critical data.

Workspace Delivery Network Market Size

Request Free Sample

Regional Analysis

North America is estimated to contribute 39% to the growth of the global market during the forecast period. Technavio's analysts have elaborately explained the regional trends and drivers that shape the market during the forecast period.

Workspace Delivery Network Market Share by Geography

See How Workspace Delivery Network Market Demand is Rising in North America Request Free Sample

The market in North America is experiencing significant growth due to the robust presence of industries such as IT, BFSI, and retail in the US and Canada. This region's consumer and enterprise data traffic are primary drivers for the expansion of data centers, fueled by the increasing demand for Internet of Things (IoT) devices, escalating investments in Artificial Intelligence (AI), and the implementation of autonomous technologies across various enterprises.

Moreover, the proliferation of autonomous vehicles and high-bandwidth applications are contributing to the exponential growth of IP traffic, thereby propelling the growth of the market in North America during the forecast period. The market's expansion is a testament to the region's commitment to digital transformation and innovation.

Market Dynamics

Our researchers analyzed the data with 2024 as the base year, along with the key drivers, trends, and challenges. A holistic analysis of drivers will help companies refine their marketing strategies to gain a competitive advantage.

The market is experiencing significant growth as businesses continue to prioritize improving remote application performance for their dispersed workforces. This requires optimizing network bandwidth for Virtual Desktop Infrastructure (VDI) and ensuring secure access through Service Edge Deployment. A robust disaster recovery plan is essential to maintain business continuity, especially when managing network traffic in hybrid cloud environments. Enhancing user experience for remote workers is crucial, and centralized management of remote endpoints enables IT teams to effectively implement a zero trust security model. Measuring application performance metrics and implementing data loss prevention in remote access solutions are critical network security best practices for remote work. Configuring VPNs for optimal performance and improving application availability and reliability are key considerations for businesses. In addition, real-time network performance monitoring and optimizing cloud-based application delivery are essential for cost optimization strategies for cloud resources. Capacity planning for remote user growth and compliance regulations for remote data access are also important factors in the market. Multi-factor authentication and secure remote access for sensitive data are necessary to maintain security and protect against potential threats. Implementing these solutions effectively requires a deep understanding of network security best practices and the ability to adapt to the evolving landscape of remote work.

Workspace Delivery Network Market Size

What are the key market drivers leading to the rise in the adoption of Workspace Delivery Network Industry?

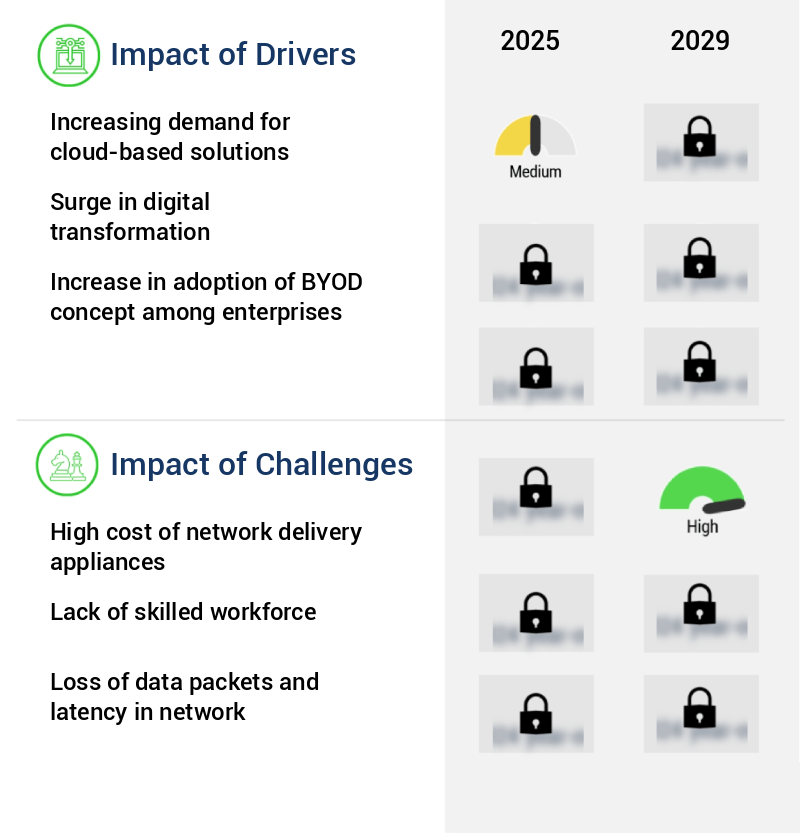
  • The surge in demand for cloud-based solutions serves as the primary catalyst for market growth. 
  • The market is experiencing significant evolution, driven by the increasing adoption of cloud computing and the growing demand for cost-effective, flexible IT solutions. Enterprises are turning to cloud services to reduce capital expenditures, with flexible payment options like pay-as-you-go and monthly subscriptions enabling substantial savings. Additionally, the heightened focus on data privacy and security has fueled the demand for economical solutions, making cloud computing an attractive option.
  • IT usage within enterprises is on the rise, leading to a surge in demand for cloud services. This shift is not limited to any specific sector but is a global trend, with numerous industries reaping the benefits of cloud computing's agility, security, and cost savings.

What are the market trends shaping the Workspace Delivery Network Industry?

  • The growing popularity of SD-WAN as a service represents the latest market trend in network technology. SD-WAN's increasing adoption signifies a significant shift in networking preferences.
  • Enterprises are increasingly investing in optimizing their Wide Area Network (WAN) architecture and applications, leading to a significant rise in demand for managed services for Software-Defined Wide Area Networks (SD-WAN). Managed SD-WAN, also known as SD-WAN as a service, has emerged as a lucrative revenue stream for service providers. These companies partner with SD-WAN technology companies to offer comprehensive SD-WAN solutions to enterprises. Managed SD-WAN services offer several advantages to end-users and enterprises. They include the management of routing protocols and an Service Level Agreement (SLA) that ensures network quality and reduces in-house costs such as manpower.
  • Some leading service providers offering managed SD-WAN services are AT&T, known for its SD-WAN solution designed to enhance network performance, efficiency, and security. By adopting managed SD-WAN services, enterprises can focus on their core business functions while benefiting from reliable and cost-effective network solutions.

What challenges does the Workspace Delivery Network Industry face during its growth?

  • The escalating costs of network delivery appliances pose a significant challenge to the industry's growth trajectory. 
  • The Workspace Delivery Network (WDN) market is undergoing significant evolution due to the increasing demand for efficient and cost-effective network solutions. Traditional methods, such as WAN optimization appliances, have high capital and ongoing maintenance costs. For instance, the cost of deploying a WAN optimization application and annual software maintenance can be substantial. Moreover, the expense of skilled personnel for managing and maintaining these appliances is a further financial burden. These costs pose a challenge for many organizations, making WDN solutions an attractive alternative.
  • For example, ARYAKA NETWORKS offers WDN alliances with costs exceeding USD 50,000 for a branch office and over USD 100,000 for a head office or data center. 

Exclusive Technavio Analysis on Customer Landscape

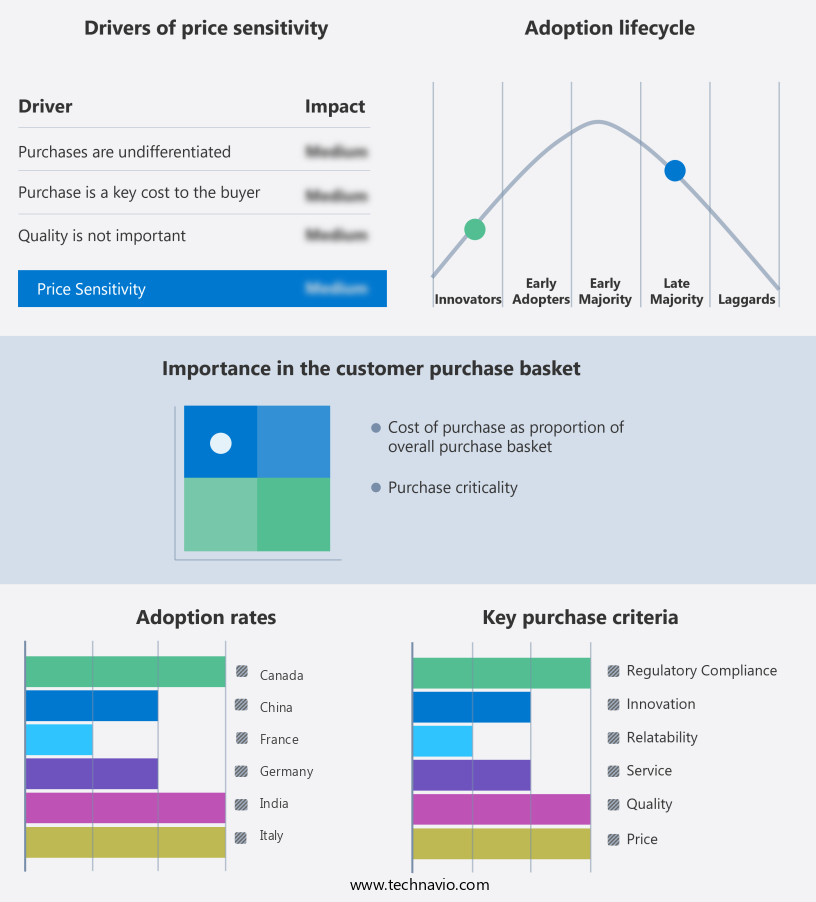
The workspace delivery network market forecasting report includes the adoption lifecycle of the market, covering from the innovator's stage to the laggard's stage. It focuses on adoption rates in different regions based on penetration. Furthermore, the workspace delivery network market report also includes key purchase criteria and drivers of price sensitivity to help companies evaluate and develop their market growth analysis strategies.

Workspace Delivery Network Market Share by Geography

 Customer Landscape of Workspace Delivery Network Industry

Competitive Landscape

Companies are implementing various strategies, such as strategic alliances, workspace delivery network market forecast, partnerships, mergers and acquisitions, geographical expansion, and product/service launches, to enhance their presence in the industry.

A10 Networks Inc. - A workspace delivery network, such as A10 Networks' cloud access proxy, empowers organizations to optimize SaaS application performance and ensure security. 

The industry research and growth report includes detailed analyses of the competitive landscape of the market and information about key companies, including:

  • A10 Networks Inc.
  • Arista Networks Inc.
  • Aryaka Networks Inc.
  • Bigleaf Networks Inc.
  • Cato Networks Ltd.
  • Check Point Software Technologies Ltd.
  • Cisco Systems Inc.
  • Cloud Software Group Inc.
  • F5 Inc.
  • FatPipe Networks Inc.
  • Fortinet Inc.
  • Hewlett Packard Enterprise Co.
  • Huawei Technologies Co. Ltd.
  • Juniper Networks Inc.
  • Oracle Corp.
  • Palo Alto Networks Inc.
  • Riverbed Technology Inc.
  • Versa Networks Inc.
  • VMware Inc.
  • Zscaler Inc.

Qualitative and quantitative analysis of companies has been conducted to help clients understand the wider business environment as well as the strengths and weaknesses of key industry players. Data is qualitatively analyzed to categorize companies as pure play, category-focused, industry-focused, and diversified; it is quantitatively analyzed to categorize companies as dominant, leading, strong, tentative, and weak.

Recent Development and News in Workspace Delivery Network Market

  • In January 2024, Cloudflare, a leading internet infrastructure company, announced the launch of its Workers' KV (Key-Value) store, an addition to their Workers platform, which now includes a Workspace Delivery Network (WDN) feature. This new service allows developers to cache and serve static assets directly from Cloudflare's edge network, improving website performance and reducing latency (Cloudflare Press Release, 2024).
  • In March 2024, Akamai Technologies, a global leader in content delivery network services, partnered with Microsoft Azure to expand Akamai's WDN offerings. This collaboration enabled Azure customers to access Akamai's edge network through Azure's portal, streamlining the content delivery process and enhancing performance (Akamai Press Release, 2024).
  • In May 2024, Fastly, a competitive player in the WDN market, secured a USD 100 million funding round led by Sequoia Capital and Meritech Capital Partners. This investment was aimed at accelerating the company's product development and expanding its global footprint (Fastly Press Release, 2024).
  • In April 2025, Amazon Web Services (AWS) introduced its new WDN, Amazon CloudFront, which supported Amazon S3 Object Retrieval for Serverless Functions. This feature enabled developers to serve dynamic content directly from Amazon S3 buckets, enhancing the performance and functionality of their applications (AWS Press Release, 2025).

Dive into Technavio's robust research methodology, blending expert interviews, extensive data synthesis, and validated models for unparalleled Workspace Delivery Network Market insights. See full methodology.

Market Scope

Report Coverage

Details

Page number

219

Base year

2024

Historic period

2019-2023

Forecast period

2025-2029

Growth momentum & CAGR

Accelerate at a CAGR of 34.3%

Market growth 2025-2029

USD 45571.1 million

Market structure

Fragmented

YoY growth 2024-2025(%)

33.1

Key countries

US, China, Germany, Canada, UK, France, Japan, Italy, India, and The Netherlands

Competitive landscape

Leading Companies, Market Positioning of Companies, Competitive Strategies, and Industry Risks

Request Free Sample

Research Analyst Overview

  • The market continues to evolve, driven by the increasing demand for remote work and the need for scalable infrastructure to support it. User experience metrics, such as network latency and application performance, are critical factors in ensuring productivity and satisfaction for remote workers. Site-to-site VPNs and secure remote access protocols provide the necessary security for accessing sensitive data and applications. Network traffic analysis and network performance monitoring are essential tools for optimizing network resources and identifying potential bottlenecks. Hybrid cloud deployment and edge computing solutions enable organizations to balance the need for centralized management and elastic compute resources with the need for low-latency, local processing.
  • Quality of service and application delivery are key considerations for ensuring high availability design and server load balancing. Network security protocols and data loss prevention are crucial components of disaster recovery planning, which is becoming increasingly important as more organizations adopt cloud-based delivery and virtual desktop infrastructure. Network topology design and IT infrastructure management are ongoing challenges, requiring continuous optimization and adaptation to changing business needs. According to recent industry reports, the market is expected to grow by over 15% annually in the coming years, driven by the increasing adoption of remote work and the need for more efficient and secure IT infrastructure solutions.
  • For instance, a leading financial services company reported a 30% increase in remote workstation access and a 25% reduction in network bandwidth utilization after implementing a new workspace delivery network solution.

What are the Key Data Covered in this Workspace Delivery Network Market Research and Growth Report?

  • What is the expected growth of the Workspace Delivery Network Market between 2025 and 2029?

    • USD 45.57 billion, at a CAGR of 34.3%

  • What segmentation does the market report cover?

    • The report is segmented by Deployment (On-premises and Cloud), Type (SD-WAN and Traditional WAN), Application (IT and telecommunication, Government institutions, Research and consulting services, and Others), and Geography (North America, Europe, APAC, South America, and Middle East and Africa)

  • Which regions are analyzed in the report?

    • North America, Europe, APAC, South America, and Middle East and Africa

  • What are the key growth drivers and market challenges?

    • Increasing demand for cloud-based solutions, High cost of network delivery appliances

  • Who are the major players in the Workspace Delivery Network Market?

    • A10 Networks Inc., Arista Networks Inc., Aryaka Networks Inc., Bigleaf Networks Inc., Cato Networks Ltd., Check Point Software Technologies Ltd., Cisco Systems Inc., Cloud Software Group Inc., F5 Inc., FatPipe Networks Inc., Fortinet Inc., Hewlett Packard Enterprise Co., Huawei Technologies Co. Ltd., Juniper Networks Inc., Oracle Corp., Palo Alto Networks Inc., Riverbed Technology Inc., Versa Networks Inc., VMware Inc., and Zscaler Inc.

Market Research Insights

  • The market is a dynamic and ever-evolving landscape that enables organizations to deliver applications and services to their employees in a secure and efficient manner. Two key aspects of this market are the increasing demand for remote work and the continuous advancement of technology. According to recent studies, over 60% of the global workforce will be working remotely by 2025. This trend is driving the growth of workspace delivery networks, which allow businesses to provide their employees with secure access to critical applications and data from anywhere. Furthermore, the market is expected to grow at a compound annual growth rate of over 15% through 2027.
  • This growth is fueled by the increasing adoption of cloud services, the need for improved security and performance, and the rise of the remote workforce. For instance, a leading financial services company reported a 30% increase in application performance and a 25% reduction in network latency after implementing a workspace delivery network solution. This outcome highlights the significant impact of these solutions on the user experience and productivity. In summary, the market is a critical component of modern business infrastructure, enabling organizations to securely and efficiently deliver applications and services to their remote workforce.
  • With the continued growth of remote work and the advancement of technology, this market is poised for significant expansion in the coming years.

We can help! Our analysts can customize this workspace delivery network market research report to meet your requirements.

Get in touch

1 Executive Summary

  • 1.1 Market overview
    • Executive Summary - Chart on Market Overview
    • Executive Summary - Data Table on Market Overview
    • Executive Summary - Chart on Global Market Characteristics
    • Executive Summary - Chart on Market by Geography
    • Executive Summary - Chart on Market Segmentation by Deployment
    • Executive Summary - Chart on Market Segmentation by Type
    • Executive Summary - Chart on Market Segmentation by Application
    • Executive Summary - Chart on Incremental Growth
    • Executive Summary - Data Table on Incremental Growth
    • Executive Summary - Chart on Company Market Positioning

2 Technavio Analysis

  • 2.1 Analysis of price sensitivity, lifecycle, customer purchase basket, adoption rates, and purchase criteria
    • Analysis of price sensitivity, lifecycle, customer purchase basket, adoption rates, and purchase criteria
  • 2.2 Criticality of inputs and Factors of differentiation
    • Overview on criticality of inputs and factors of differentiation
  • 2.3 Factors of disruption
    • Overview on factors of disruption
  • 2.4 Impact of drivers and challenges
    • Impact of drivers and challenges in 2024 and 2029

3 Market Landscape

  • 3.1 Market ecosystem
    • Parent Market
    • Data Table on - Parent Market
  • 3.2 Market characteristics
    • Market characteristics analysis
  • 3.3 Value chain analysis
    • Value chain analysis

4 Market Sizing

  • 4.1 Market definition
    • Offerings of companies included in the market definition
  • 4.2 Market segment analysis
    • Market segments
  • 4.3 Market size 2024
    • 4.4 Market outlook: Forecast for 2024-2029
      • Chart on Global - Market size and forecast 2024-2029 ($ million)
      • Data Table on Global - Market size and forecast 2024-2029 ($ million)
      • Chart on Global Market: Year-over-year growth 2024-2029 (%)
      • Data Table on Global Market: Year-over-year growth 2024-2029 (%)

    5 Historic Market Size

    • 5.1 Global Workspace Delivery Network Market 2019 - 2023
      • Historic Market Size - Data Table on Global Workspace Delivery Network Market 2019 - 2023 ($ million)
    • 5.2 Deployment segment analysis 2019 - 2023
      • Historic Market Size - Deployment Segment 2019 - 2023 ($ million)
    • 5.3 Type segment analysis 2019 - 2023
      • Historic Market Size - Type Segment 2019 - 2023 ($ million)
    • 5.4 Application segment analysis 2019 - 2023
      • Historic Market Size - Application Segment 2019 - 2023 ($ million)
    • 5.5 Geography segment analysis 2019 - 2023
      • Historic Market Size - Geography Segment 2019 - 2023 ($ million)
    • 5.6 Country segment analysis 2019 - 2023
      • Historic Market Size - Country Segment 2019 - 2023 ($ million)

    6 Qualitative Analysis

    • 6.1 AI Impact on Global Workspace Delivery Network Market

      7 Five Forces Analysis

      • 7.1 Five forces summary
        • Five forces analysis - Comparison between 2024 and 2029
      • 7.2 Bargaining power of buyers
        • Bargaining power of buyers - Impact of key factors 2024 and 2029
      • 7.3 Bargaining power of suppliers
        • Bargaining power of suppliers - Impact of key factors in 2024 and 2029
      • 7.4 Threat of new entrants
        • Threat of new entrants - Impact of key factors in 2024 and 2029
      • 7.5 Threat of substitutes
        • Threat of substitutes - Impact of key factors in 2024 and 2029
      • 7.6 Threat of rivalry
        • Threat of rivalry - Impact of key factors in 2024 and 2029
      • 7.7 Market condition
        • Chart on Market condition - Five forces 2024 and 2029

      8 Market Segmentation by Deployment

      • 8.1 Market segments
        • Chart on Deployment - Market share 2024-2029 (%)
        • Data Table on Deployment - Market share 2024-2029 (%)
      • 8.2 Comparison by Deployment
        • Chart on Comparison by Deployment
        • Data Table on Comparison by Deployment
      • 8.3 On-premises - Market size and forecast 2024-2029
        • Chart on On-premises - Market size and forecast 2024-2029 ($ million)
        • Data Table on On-premises - Market size and forecast 2024-2029 ($ million)
        • Chart on On-premises - Year-over-year growth 2024-2029 (%)
        • Data Table on On-premises - Year-over-year growth 2024-2029 (%)
      • 8.4 Cloud - Market size and forecast 2024-2029
        • Chart on Cloud - Market size and forecast 2024-2029 ($ million)
        • Data Table on Cloud - Market size and forecast 2024-2029 ($ million)
        • Chart on Cloud - Year-over-year growth 2024-2029 (%)
        • Data Table on Cloud - Year-over-year growth 2024-2029 (%)
      • 8.5 Market opportunity by Deployment
        • Market opportunity by Deployment ($ million)
        • Data Table on Market opportunity by Deployment ($ million)

      9 Market Segmentation by Type

      • 9.1 Market segments
        • Chart on Type - Market share 2024-2029 (%)
        • Data Table on Type - Market share 2024-2029 (%)
      • 9.2 Comparison by Type
        • Chart on Comparison by Type
        • Data Table on Comparison by Type
      • 9.3 SD-WAN - Market size and forecast 2024-2029
        • Chart on SD-WAN - Market size and forecast 2024-2029 ($ million)
        • Data Table on SD-WAN - Market size and forecast 2024-2029 ($ million)
        • Chart on SD-WAN - Year-over-year growth 2024-2029 (%)
        • Data Table on SD-WAN - Year-over-year growth 2024-2029 (%)
      • 9.4 Traditional WAN - Market size and forecast 2024-2029
        • Chart on Traditional WAN - Market size and forecast 2024-2029 ($ million)
        • Data Table on Traditional WAN - Market size and forecast 2024-2029 ($ million)
        • Chart on Traditional WAN - Year-over-year growth 2024-2029 (%)
        • Data Table on Traditional WAN - Year-over-year growth 2024-2029 (%)
      • 9.5 Market opportunity by Type
        • Market opportunity by Type ($ million)
        • Data Table on Market opportunity by Type ($ million)

      10 Market Segmentation by Application

      • 10.1 Market segments
        • Chart on Application - Market share 2024-2029 (%)
        • Data Table on Application - Market share 2024-2029 (%)
      • 10.2 Comparison by Application
        • Chart on Comparison by Application
        • Data Table on Comparison by Application
      • 10.3 IT and telecommunication - Market size and forecast 2024-2029
        • Chart on IT and telecommunication - Market size and forecast 2024-2029 ($ million)
        • Data Table on IT and telecommunication - Market size and forecast 2024-2029 ($ million)
        • Chart on IT and telecommunication - Year-over-year growth 2024-2029 (%)
        • Data Table on IT and telecommunication - Year-over-year growth 2024-2029 (%)
      • 10.4 Government institutions - Market size and forecast 2024-2029
        • Chart on Government institutions - Market size and forecast 2024-2029 ($ million)
        • Data Table on Government institutions - Market size and forecast 2024-2029 ($ million)
        • Chart on Government institutions - Year-over-year growth 2024-2029 (%)
        • Data Table on Government institutions - Year-over-year growth 2024-2029 (%)
      • 10.5 Research and consulting services - Market size and forecast 2024-2029
        • Chart on Research and consulting services - Market size and forecast 2024-2029 ($ million)
        • Data Table on Research and consulting services - Market size and forecast 2024-2029 ($ million)
        • Chart on Research and consulting services - Year-over-year growth 2024-2029 (%)
        • Data Table on Research and consulting services - Year-over-year growth 2024-2029 (%)
      • 10.6 Others - Market size and forecast 2024-2029
        • Chart on Others - Market size and forecast 2024-2029 ($ million)
        • Data Table on Others - Market size and forecast 2024-2029 ($ million)
        • Chart on Others - Year-over-year growth 2024-2029 (%)
        • Data Table on Others - Year-over-year growth 2024-2029 (%)
      • 10.7 Market opportunity by Application
        • Market opportunity by Application ($ million)
        • Data Table on Market opportunity by Application ($ million)

      11 Customer Landscape

      • 11.1 Customer landscape overview
        • Analysis of price sensitivity, lifecycle, customer purchase basket, adoption rates, and purchase criteria

      12 Geographic Landscape

      • 12.1 Geographic segmentation
        • Chart on Market share by geography 2024-2029 (%)
        • Data Table on Market share by geography 2024-2029 (%)
      • 12.2 Geographic comparison
        • Chart on Geographic comparison
        • Data Table on Geographic comparison
      • 12.3 North America - Market size and forecast 2024-2029
        • Chart on North America - Market size and forecast 2024-2029 ($ million)
        • Data Table on North America - Market size and forecast 2024-2029 ($ million)
        • Chart on North America - Year-over-year growth 2024-2029 (%)
        • Data Table on North America - Year-over-year growth 2024-2029 (%)
      • 12.4 Europe - Market size and forecast 2024-2029
        • Chart on Europe - Market size and forecast 2024-2029 ($ million)
        • Data Table on Europe - Market size and forecast 2024-2029 ($ million)
        • Chart on Europe - Year-over-year growth 2024-2029 (%)
        • Data Table on Europe - Year-over-year growth 2024-2029 (%)
      • 12.5 APAC - Market size and forecast 2024-2029
        • Chart on APAC - Market size and forecast 2024-2029 ($ million)
        • Data Table on APAC - Market size and forecast 2024-2029 ($ million)
        • Chart on APAC - Year-over-year growth 2024-2029 (%)
        • Data Table on APAC - Year-over-year growth 2024-2029 (%)
      • 12.6 South America - Market size and forecast 2024-2029
        • Chart on South America - Market size and forecast 2024-2029 ($ million)
        • Data Table on South America - Market size and forecast 2024-2029 ($ million)
        • Chart on South America - Year-over-year growth 2024-2029 (%)
        • Data Table on South America - Year-over-year growth 2024-2029 (%)
      • 12.7 Middle East and Africa - Market size and forecast 2024-2029
        • Chart on Middle East and Africa - Market size and forecast 2024-2029 ($ million)
        • Data Table on Middle East and Africa - Market size and forecast 2024-2029 ($ million)
        • Chart on Middle East and Africa - Year-over-year growth 2024-2029 (%)
        • Data Table on Middle East and Africa - Year-over-year growth 2024-2029 (%)
      • 12.8 US - Market size and forecast 2024-2029
        • Chart on US - Market size and forecast 2024-2029 ($ million)
        • Data Table on US - Market size and forecast 2024-2029 ($ million)
        • Chart on US - Year-over-year growth 2024-2029 (%)
        • Data Table on US - Year-over-year growth 2024-2029 (%)
      • 12.9 China - Market size and forecast 2024-2029
        • Chart on China - Market size and forecast 2024-2029 ($ million)
        • Data Table on China - Market size and forecast 2024-2029 ($ million)
        • Chart on China - Year-over-year growth 2024-2029 (%)
        • Data Table on China - Year-over-year growth 2024-2029 (%)
      • 12.10 Germany - Market size and forecast 2024-2029
        • Chart on Germany - Market size and forecast 2024-2029 ($ million)
        • Data Table on Germany - Market size and forecast 2024-2029 ($ million)
        • Chart on Germany - Year-over-year growth 2024-2029 (%)
        • Data Table on Germany - Year-over-year growth 2024-2029 (%)
      • 12.11 UK - Market size and forecast 2024-2029
        • Chart on UK - Market size and forecast 2024-2029 ($ million)
        • Data Table on UK - Market size and forecast 2024-2029 ($ million)
        • Chart on UK - Year-over-year growth 2024-2029 (%)
        • Data Table on UK - Year-over-year growth 2024-2029 (%)
      • 12.12 Canada - Market size and forecast 2024-2029
        • Chart on Canada - Market size and forecast 2024-2029 ($ million)
        • Data Table on Canada - Market size and forecast 2024-2029 ($ million)
        • Chart on Canada - Year-over-year growth 2024-2029 (%)
        • Data Table on Canada - Year-over-year growth 2024-2029 (%)
      • 12.13 Japan - Market size and forecast 2024-2029
        • Chart on Japan - Market size and forecast 2024-2029 ($ million)
        • Data Table on Japan - Market size and forecast 2024-2029 ($ million)
        • Chart on Japan - Year-over-year growth 2024-2029 (%)
        • Data Table on Japan - Year-over-year growth 2024-2029 (%)
      • 12.14 India - Market size and forecast 2024-2029
        • Chart on India - Market size and forecast 2024-2029 ($ million)
        • Data Table on India - Market size and forecast 2024-2029 ($ million)
        • Chart on India - Year-over-year growth 2024-2029 (%)
        • Data Table on India - Year-over-year growth 2024-2029 (%)
      • 12.15 France - Market size and forecast 2024-2029
        • Chart on France - Market size and forecast 2024-2029 ($ million)
        • Data Table on France - Market size and forecast 2024-2029 ($ million)
        • Chart on France - Year-over-year growth 2024-2029 (%)
        • Data Table on France - Year-over-year growth 2024-2029 (%)
      • 12.16 Italy - Market size and forecast 2024-2029
        • Chart on Italy - Market size and forecast 2024-2029 ($ million)
        • Data Table on Italy - Market size and forecast 2024-2029 ($ million)
        • Chart on Italy - Year-over-year growth 2024-2029 (%)
        • Data Table on Italy - Year-over-year growth 2024-2029 (%)
      • 12.17 The Netherlands - Market size and forecast 2024-2029
        • Chart on The Netherlands - Market size and forecast 2024-2029 ($ million)
        • Data Table on The Netherlands - Market size and forecast 2024-2029 ($ million)
        • Chart on The Netherlands - Year-over-year growth 2024-2029 (%)
        • Data Table on The Netherlands - Year-over-year growth 2024-2029 (%)
      • 12.18 Market opportunity by geography
        • Market opportunity by geography ($ million)
        • Data Tables on Market opportunity by geography ($ million)

      13 Drivers, Challenges, and Opportunity/Restraints

      • 13.1 Market drivers
        • 13.2 Market challenges
          • 13.3 Impact of drivers and challenges
            • Impact of drivers and challenges in 2024 and 2029
          • 13.4 Market opportunities/restraints

            14 Competitive Landscape

            • 14.1 Overview
              • 14.2 Competitive Landscape
                • Overview on criticality of inputs and factors of differentiation
              • 14.3 Landscape disruption
                • Overview on factors of disruption
              • 14.4 Industry risks
                • Impact of key risks on business

              15 Competitive Analysis

              • 15.1 Companies profiled
                • Companies covered
              • 15.2 Company ranking index
                • Company ranking index
              • 15.3 Market positioning of companies
                • Matrix on companies position and classification
              • 15.4 A10 Networks Inc.
                • A10 Networks Inc. - Overview
                • A10 Networks Inc. - Product / Service
                • A10 Networks Inc. - Key offerings
                • SWOT
              • 15.5 Arista Networks Inc.
                • Arista Networks Inc. - Overview
                • Arista Networks Inc. - Product / Service
                • Arista Networks Inc. - Key offerings
                • SWOT
              • 15.6 Cisco Systems Inc.
                • Cisco Systems Inc. - Overview
                • Cisco Systems Inc. - Business segments
                • Cisco Systems Inc. - Key news
                • Cisco Systems Inc. - Key offerings
                • Cisco Systems Inc. - Segment focus
                • SWOT
              • 15.7 Cloud Software Group Inc.
                • Cloud Software Group Inc. - Overview
                • Cloud Software Group Inc. - Product / Service
                • Cloud Software Group Inc. - Key news
                • Cloud Software Group Inc. - Key offerings
                • SWOT
              • 15.8 F5 Inc.
                • F5 Inc. - Overview
                • F5 Inc. - Product / Service
                • F5 Inc. - Key news
                • F5 Inc. - Key offerings
                • SWOT
              • 15.9 FatPipe Networks Inc.
                • FatPipe Networks Inc. - Overview
                • FatPipe Networks Inc. - Product / Service
                • FatPipe Networks Inc. - Key offerings
                • SWOT
              • 15.10 Fortinet Inc.
                • Fortinet Inc. - Overview
                • Fortinet Inc. - Product / Service
                • Fortinet Inc. - Key news
                • Fortinet Inc. - Key offerings
                • SWOT
              • 15.11 Hewlett Packard Enterprise Co.
                • Hewlett Packard Enterprise Co. - Overview
                • Hewlett Packard Enterprise Co. - Business segments
                • Hewlett Packard Enterprise Co. - Key news
                • Hewlett Packard Enterprise Co. - Key offerings
                • Hewlett Packard Enterprise Co. - Segment focus
                • SWOT
              • 15.12 Huawei Technologies Co. Ltd.
                • Huawei Technologies Co. Ltd. - Overview
                • Huawei Technologies Co. Ltd. - Product / Service
                • Huawei Technologies Co. Ltd. - Key news
                • Huawei Technologies Co. Ltd. - Key offerings
                • SWOT
              • 15.13 Juniper Networks Inc.
                • Juniper Networks Inc. - Overview
                • Juniper Networks Inc. - Product / Service
                • Juniper Networks Inc. - Key news
                • Juniper Networks Inc. - Key offerings
                • SWOT
              • 15.14 Oracle Corp.
                • Oracle Corp. - Overview
                • Oracle Corp. - Business segments
                • Oracle Corp. - Key news
                • Oracle Corp. - Key offerings
                • Oracle Corp. - Segment focus
                • SWOT
              • 15.15 Palo Alto Networks Inc.
                • Palo Alto Networks Inc. - Overview
                • Palo Alto Networks Inc. - Product / Service
                • Palo Alto Networks Inc. - Key news
                • Palo Alto Networks Inc. - Key offerings
                • SWOT
              • 15.16 Riverbed Technology Inc.
                • Riverbed Technology Inc. - Overview
                • Riverbed Technology Inc. - Product / Service
                • Riverbed Technology Inc. - Key offerings
                • SWOT
              • 15.17 Versa Networks Inc.
                • Versa Networks Inc. - Overview
                • Versa Networks Inc. - Product / Service
                • Versa Networks Inc. - Key offerings
                • SWOT
              • 15.18 VMware Inc.
                • VMware Inc. - Overview
                • VMware Inc. - Product / Service
                • VMware Inc. - Key offerings
                • SWOT

              16 Appendix

              • 16.1 Scope of the report
                • 16.2 Inclusions and exclusions checklist
                  • Inclusions checklist
                  • Exclusions checklist
                • 16.3 Currency conversion rates for US$
                  • Currency conversion rates for US$
                • 16.4 Research methodology
                  • Research methodology
                • 16.5 Data procurement
                  • Information sources
                • 16.6 Data validation
                  • Data validation
                • 16.7 Validation techniques employed for market sizing
                  • Validation techniques employed for market sizing
                • 16.8 Data synthesis
                  • Data synthesis
                • 16.9 360 degree market analysis
                  • 360 degree market analysis
                • 16.10 List of abbreviations
                  • List of abbreviations

                Research Methodology

                Technavio presents a detailed picture of the market by way of study, synthesis, and summation of data from multiple sources. The analysts have presented the various facets of the market with a particular focus on identifying the key industry influencers. The data thus presented is comprehensive, reliable, and the result of extensive research, both primary and secondary.

                INFORMATION SOURCES

                Primary sources

                • Manufacturers and suppliers
                • Channel partners
                • Industry experts
                • Strategic decision makers

                Secondary sources

                • Industry journals and periodicals
                • Government data
                • Financial reports of key industry players
                • Historical data
                • Press releases

                DATA ANALYSIS

                Data Synthesis

                • Collation of data
                • Estimation of key figures
                • Analysis of derived insights

                Data Validation

                • Triangulation with data models
                • Reference against proprietary databases
                • Corroboration with industry experts

                REPORT WRITING

                Qualitative

                • Market drivers
                • Market challenges
                • Market trends
                • Five forces analysis

                Quantitative

                • Market size and forecast
                • Market segmentation
                • Geographical insights
                • Competitive landscape

                Interested in this report?

                Get your sample now to see our research methodology and insights!

                Download Now

                Frequently Asked Questions

                Workspace Delivery Network market growth will increase by $ 45571.1 mn during 2025-2029 .

                The Workspace Delivery Network market is expected to grow at a CAGR of 34.3% during 2025-2029 .

                Workspace Delivery Network market is segmented by Deployment( On-premises, Cloud, Polypropylene flexible foams, Others) Type( SD-WAN, Traditional WAN, North America, MEA, South America) Application( IT and telecommunication, Government institutions, Research and consulting services, Others, Middle East and Africa)

                A10 Networks Inc., Arista Networks Inc., Aryaka Networks Inc., Bigleaf Networks Inc., Cato Networks Ltd., Check Point Software Technologies Ltd., Cisco Systems Inc., Cloud Software Group Inc., F5 Inc., FatPipe Networks Inc., Fortinet Inc., Hewlett Packard Enterprise Co., Huawei Technologies Co. Ltd., Juniper Networks Inc., Oracle Corp., Palo Alto Networks Inc., Riverbed Technology Inc., Versa Networks Inc., VMware Inc., Zscaler Inc. are a few of the key vendors in the Workspace Delivery Network market.

                North America will register the highest growth rate of 39% among the other regions. Therefore, the Workspace Delivery Network market in North America is expected to garner significant business opportunities for the vendors during the forecast period.

                US, China, Germany, Canada, UK, France, Japan, Italy, India, The Netherlands

                • Increasing demand for cloud-based solutionsThe adoption of cloud computing is increasing globally is the driving factor this market.
                • owing to the flexibility and cost benefits associated with cloud services. Cloud-based solutions help enterprises reduce CAPEX is the driving factor this market.
                • as they can subscribe to cloud services through flexible payment options is the driving factor this market.
                • such as on a pay-as-you-go or a fixed monthly fee basis. In addition is the driving factor this market.
                • with the growing interest in information privacy and safety is the driving factor this market.
                • the pressure to manage data has increased the demand for economical solutions such as cloud computing. Cloud computing offers various advantages is the driving factor this market.
                • such as business agility is the driving factor this market.
                • privacy and security is the driving factor this market.
                • and low costs. The use of IT across enterprises has increased the demand for cloud computing. Owing to numerous benefits is the driving factor this market.
                • enterprises have started adopting cloud-based services is the driving factor this market.
                • which will drive the workspace delivery network market. The integration of WAN optimization and SD-WAN solutions helps enterprises save costs incurred in buying is the driving factor this market.
                • upgrading is the driving factor this market.
                • and managing the underlying hardware and software needed. The demand for cloud-based services has increased is the driving factor this market.
                • owing to which various companies in the market is the driving factor this market.
                • such as Sophos is the driving factor this market.
                • MacAfee is the driving factor this market.
                • and Symantec is the driving factor this market.
                • are offering workspace delivery networks. Such acquisitions help companies develop or enhance their product offerings is the driving factor this market.
                • which is the driving factor this market.
                • in turn is the driving factor this market.
                • can help them gain new customers and cater to their existing customers in a better way. Moreover is the driving factor this market.
                • companies are launching or updating cloud-based products with endpoint security is the driving factor this market.
                • which can help them gain more customers. Thus is the driving factor this market.
                • the increase in the adoption of cloud-based services will drive the growth of the global workspace delivery network market during the forecast period. is the driving factor this market.

                The Workspace Delivery Network market vendors should focus on grabbing business opportunities from the On-premises segment as it accounted for the largest market share in the base year.