
AI And Machine Learning In Business Market Analysis, Size, and Forecast 2026-2030: North America (US, Canada, and Mexico), APAC (China, Japan, and India), Europe (Germany, UK, and France), South America (Brazil, Argentina, and Chile), Middle East and Africa (Saudi Arabia, UAE, and South Africa), and Rest of World (ROW)

AI And Machine Learning In Business Market Analysis, Size, and Forecast 2026-2030:
North America (US, Canada, and Mexico), APAC (China, Japan, and India), Europe (Germany, UK, and France), South America (Brazil, Argentina, and Chile), Middle East and Africa (Saudi Arabia, UAE, and South Africa), and Rest of World (ROW)

Published: Oct 2026 328 Pages SKU: IRTNTR80836

Market Overview at a Glance

$394.31 B
Market Opportunity
30%
CAGR 2025 - 2030
36.1%
APAC Growth
$79.74 B
Solutions segment 2024

Ai And Machine Learning In Business Market Size 2026-2030

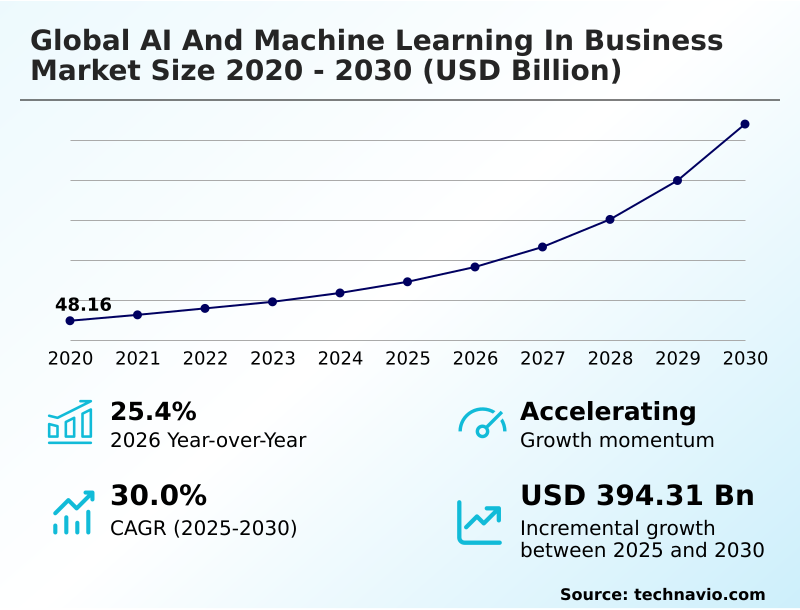
The ai and machine learning in business market size is valued to increase by USD 394.31 billion, at a CAGR of 30% from 2025 to 2030. Corporate demand for operational workflow automation will drive the ai and machine learning in business market.

Major Market Trends & Insights

  • APAC dominated the market and accounted for a 36.1% growth during the forecast period.
  • By Component - Solutions segment was valued at USD 79.74 billion in 2024
  • By Sector - Large enterprises segment accounted for the largest market revenue share in 2024

Market Size & Forecast

  • Market Opportunities: USD 491.69 billion
  • Market Future Opportunities: USD 394.31 billion
  • CAGR from 2025 to 2030 : 30%

Market Summary

  • The AI And Machine Learning In Business Market is undergoing a rapid structural transformation driven by the critical need to automate complex cognitive tasks and optimize data-driven decision-making. Enterprise organizations across diverse sectors are aggressively transitioning from traditional rule-based software to adaptive cognitive systems that learn continuously from proprietary operational data.
  • For instance, in supply chain operations, companies are utilizing predictive algorithms to balance inventory levels across regional distribution networks, identifying demand fluctuations before stockouts occur. Businesses implementing these advanced analytical workflows report a 25% reduction in excess inventory carrying costs compared to those relying on manual spreadsheet forecasting.
  • Corporate demand for operational workflow automation serves as a primary catalyst, as firms seek to mitigate skilled labor shortages by automating high-volume administrative tasks. Conversely, severe data governance bottlenecks and legacy system fragmentation pose significant implementation barriers, frequently causing inaccurate model inferences when algorithms process unverified transactional records.
  • Overcoming these integration hurdles requires substantial investments in data orchestration software, cementing intelligence platforms as foundational requirements for long-term commercial competitiveness.

What will be the Size of the Ai And Machine Learning In Business Market during the forecast period?
Get Key Insights on Market Forecast (PDF) Get Free Sample

How is the Ai And Machine Learning In Business Market Segmented?

The ai and machine learning in business industry research report provides comprehensive data (region-wise segment analysis), with forecasts and estimates in "USD million" for the period 2026-2030, as well as historical data from 2020-2024 for the following segments.

  • Component
    • Solutions
    • Services
  • Sector
    • Large enterprises
    • SMEs
  • Application
    • Data analytics
    • Predictive analytics
    • Cyber security
    • Supply chain and inventory management
    • Others
  • End-user
    • IT and telecom
    • BFSI
    • Retail and manufacturing
    • Healthcare
    • Others
  • Geography
    • North America
      • US
      • Canada
      • Mexico
    • APAC
      • China
      • Japan
      • India
      • South Korea
      • Australia
      • Indonesia
    • Europe
      • Germany
      • UK
      • France
      • Italy
      • Spain
      • The Netherlands
    • South America
      • Brazil
      • Argentina
      • Chile
    • Middle East and Africa
      • Saudi Arabia
      • UAE
      • South Africa
      • Israel
      • Turkey

By Component Insights

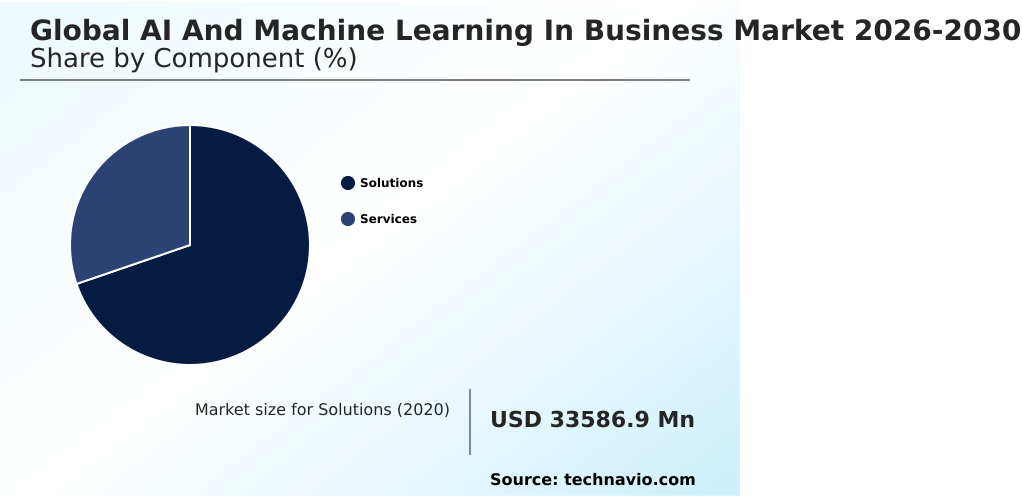
The solutions segment is estimated to witness significant growth during the forecast period.

The solutions component encompasses sophisticated software platforms designed to execute large scale model inferencing across diverse enterprise architectures.

Commercial deployments of anomaly detection systems and reinforcement learning models allow organizations to shift from reactive monitoring to proactive operational optimization, improving error detection by 15%.

Modern corporate buyers demand turnkey platforms featuring robust model performance drift monitoring and secure on premises server clusters to comply with stringent cross border data privacy mandates.

The continuous commercial convergence of dynamic pricing algorithms and computer vision quality control transforms static databases into highly adaptive environments.

This functional segmentation highlights how businesses achieve a 20% efficiency gain by prioritizing pre-built analytical frameworks over manual data processing configurations.
Get Free Sample

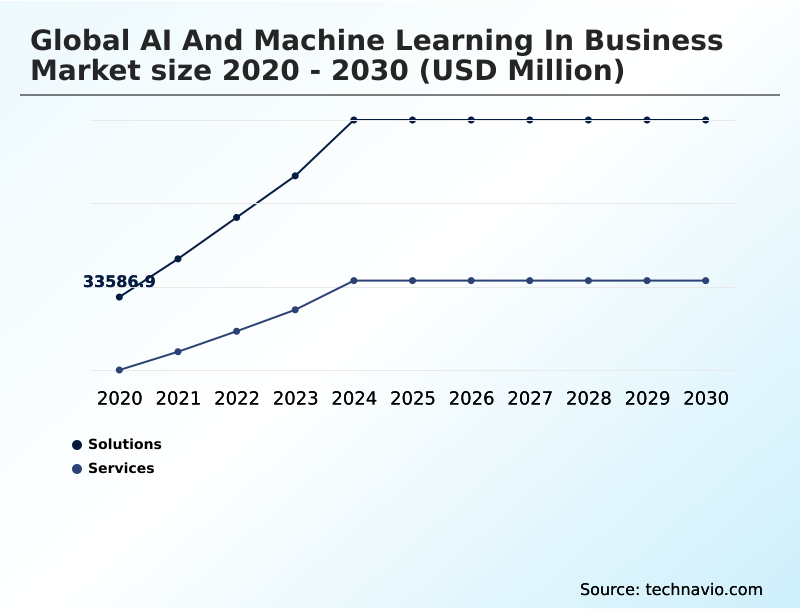
The Solutions segment was valued at USD 79.74 billion in 2024 and showed a gradual increase during the forecast period.
Get Free Sample

Regional Analysis

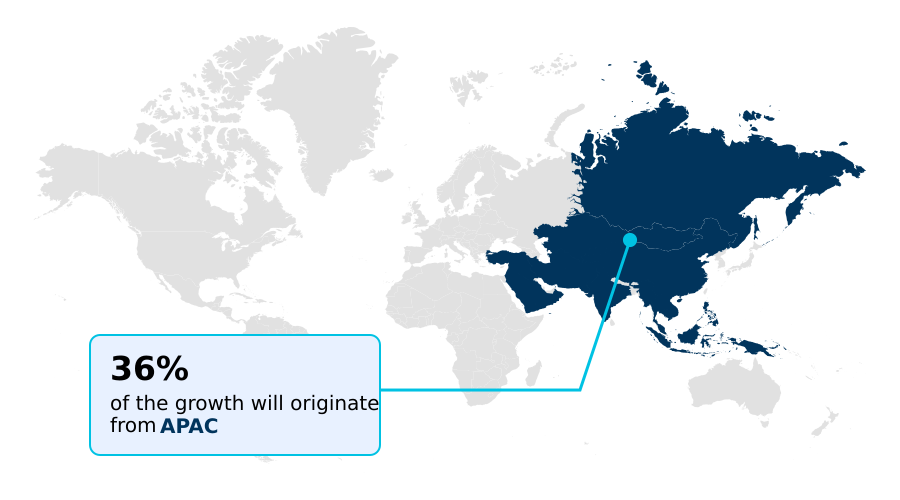
APAC is estimated to contribute 36.1% to the growth of the global market during the forecast period.Technavio’s analysts have elaborately explained the regional trends and drivers that shape the market during the forecast period.
See How Ai And Machine Learning In Business Market Demand is Rising in APAC Get Free Sample

Regional disparities in enterprise automation are largely dictated by regulatory frameworks and the availability of high throughput model inference capabilities.

North American enterprises exhibit a 35% faster adoption rate of federated learning architectures and semantic layer tools compared to European markets, heavily prioritizing cloud token expenditure optimization.

Conversely, European organizations enforce rigorous zero copy security access and algorithmic bias mitigation protocols, heavily investing in secure legacy system data pipeline modernization to ensure compliance.

Asian markets lead in deploying automated metadata indexing for smart city traffic management and precision personalized medicine, achieving a 22% higher penetration in urban digitalization projects. These diverse regional strategies force multinational businesses to adapt their deployment models continuously.

Market Dynamics

Our researchers analyzed the data with 2025 as the base year, along with the key drivers, trends, and challenges. A holistic analysis of drivers will help companies refine their marketing strategies to gain a competitive advantage.

  • The rapid evolution of corporate digital infrastructure compels modern enterprises to fundamentally rethink their operational strategies and data governance frameworks. A critical focus involves deploying autonomous enterprise ai agents capable of executing complex, multi-step business objectives without continuous human oversight, thereby streamlining procurement and inventory management.
  • By optimizing predictive supply chain telemetry, logistics organizations achieve a 20% improvement in demand forecasting accuracy compared to legacy spreadsheet models, ensuring resilient operations amid geopolitical disruptions. Financial institutions face immense pressure in mitigating algorithmic bias in banking, necessitating rigorous validation protocols to ensure automated credit scoring remains fair and compliant with emerging anti-discrimination regulations.
  • Simultaneously, automating compliance with algorithmic explainability allows corporate risk committees to generate audit-ready verification reports instantly, heavily reducing administrative overhead associated with regulatory audits. Furthermore, the strategic shift toward reducing latency with edge compute enables manufacturing facilities to conduct real-time visual quality inspections directly on the factory floor, significantly minimizing the network bottlenecks associated with centralized cloud processing.
  • As these intelligent systems transition from experimental pilot projects to mission-critical production environments, organizations must prioritize scalable and secure data architecture. Integrating these advanced capabilities allows business leaders to transform raw operational data into actionable competitive intelligence, establishing a robust foundation for continuous margin expansion and sustained market leadership.
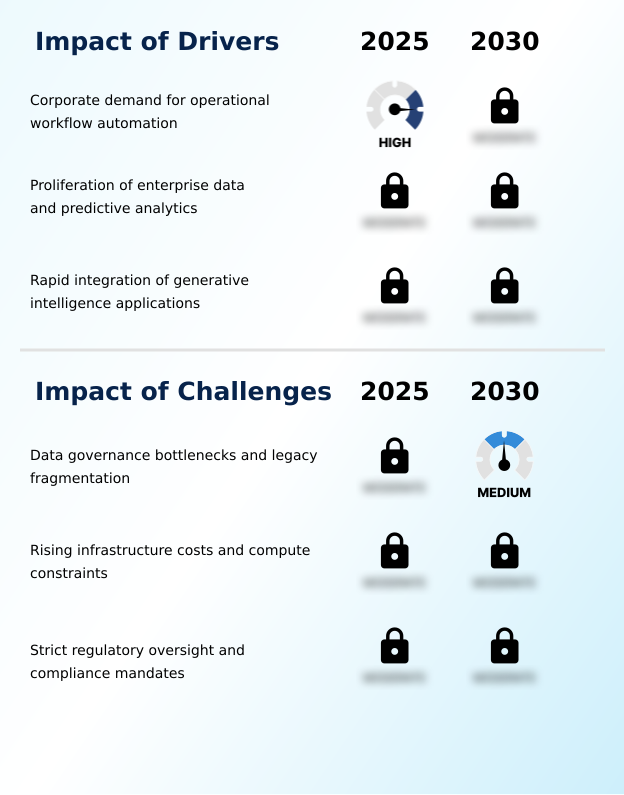
What are the key market drivers leading to the rise in the adoption of Ai And Machine Learning In Business Industry?

  • Corporate demand for operational workflow automation serves as the primary driver propelling market expansion.

  • The continuous expansion of cloud native machine learning infrastructure serves as a primary catalyst accelerating operational efficiency across global commercial sectors.
  • Organizations leveraging transformer based foundation models and enterprise data vector databases report a 30% reduction in data retrieval times, significantly optimizing strategic decision-making.
  • The urgent need for robust data sovereignty compliance and algorithmic explainability frameworks drives the adoption of strict algorithmic model governance protocols.
  • Furthermore, automated machine learning pipelines enable enterprises to deploy zero day vulnerability detection and automated credit risk scoring with unprecedented speed and accuracy. This modernization allows manufacturing facilities to implement predictive equipment maintenance, decreasing unexpected machinery downtime by 18%.

What are the market trends shaping the Ai And Machine Learning In Business Industry?

  • The transition to autonomous AI agents and multi-agent orchestration represents a defining market trend.

  • The transition toward agentic workflow integration fundamentally redefines how autonomous ai agents execute complex tasks across enterprise resource planning integration frameworks. Companies adopting multi-agent orchestration have improved process execution speeds by 25%, drastically reducing manual intervention bottlenecks. These generative intelligence applications and predictive analytics models autonomously optimize supply chain telemetry, driving predictive adjustments in real time.
  • The rapid migration toward edge compute platforms and hybrid cloud deployments enables decentralized data processing, lowering operational latency and network overload. Consequently, businesses deploying these advanced solutions achieve a 15% reduction in overall processing costs. This architectural pivot empowers organizations to deploy continuous customer relationship management automation without compromising security.

What challenges does the Ai And Machine Learning In Business Industry face during its growth?

  • Data governance bottlenecks and legacy fragmentation remain critical challenges hindering widespread industry growth.

  • Integrating complex natural language processing engines and intelligent process automation into entrenched legacy architectures presents severe structural bottlenecks for modern enterprises. The massive computational load required by advanced conversational digital copilots and unstructured data extraction tools exhausts existing neural processing hardware units, leading to a 20% increase in baseline infrastructure expenditures.
  • Financial institutions struggle to deploy autonomous threat orchestration and real time behavioral biometrics due to fragmented data pipelines that hinder seamless conversational virtual financial advisors. Furthermore, healthcare and retail sectors face implementation delays of up to 40% when attempting to scale clinical diagnostic imaging algorithms and omnichannel retail fulfillment networks across isolated on-premises servers.

Exclusive Technavio Analysis on Customer Landscape

The ai and machine learning in business market forecasting report includes the adoption lifecycle of the market, covering from the innovator’s stage to the laggard’s stage. It focuses on adoption rates in different regions based on penetration. Furthermore, the ai and machine learning in business market report also includes key purchase criteria and drivers of price sensitivity to help companies evaluate and develop their market growth analysis strategies.
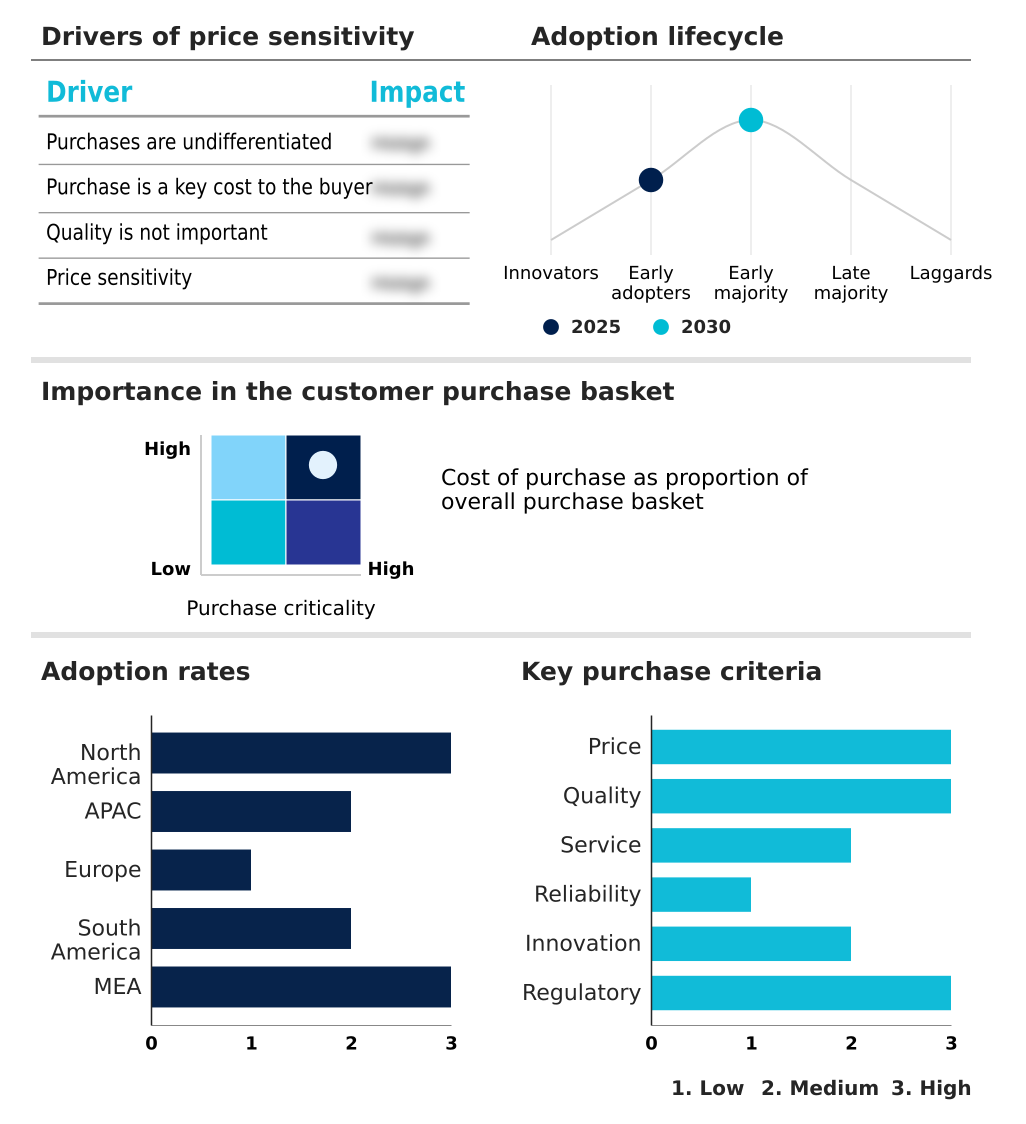
Customer Landscape of Ai And Machine Learning In Business Industry

Competitive Landscape

Companies are implementing various strategies, such as strategic alliances, ai and machine learning in business market forecast, partnerships, mergers and acquisitions, geographical expansion, and product/service launches, to enhance their presence in the industry.

Adobe Inc. - Provides advanced marketing analytics and personalization platforms tailored for digital media optimization and customer experience management.

The industry research and growth report includes detailed analyses of the competitive landscape of the market and information about key companies, including:

  • Adobe Inc.
  • Altair Engineering Inc.
  • Alteryx Inc.
  • Amazon.com Inc.
  • C3.ai Inc.
  • Databricks Inc.
  • Dataiku Inc.
  • Google LLC
  • IBM Corp.
  • Microsoft Corp.
  • NVIDIA Corp.
  • Oracle Corp.
  • Palantir Technologies Inc.
  • Pegasystems Inc.
  • Salesforce Inc.
  • SAP SE
  • SAS Institute Inc.
  • ServiceNow Inc.
  • Snowflake Inc.
  • Workday Inc.

Qualitative and quantitative analysis of companies has been conducted to help clients understand the wider business environment as well as the strengths and weaknesses of key industry players. Data is qualitatively analyzed to categorize companies as pure play, category-focused, industry-focused, and diversified; it is quantitatively analyzed to categorize companies as dominant, leading, strong, tentative, and weak.

Recent Development and News in Ai and machine learning in business market

  • In the Application Software industry, the widespread integration of autonomous enterprise resource planning modules enhanced cross-functional data accessibility, directly impacting AI And Machine Learning In Business demand by accelerating the deployment of predictive analytics models.
  • The enforcement of strict data sovereignty mandates for cloud-hosted applications forced providers to implement zero copy security access frameworks, driving enterprise adoption of localized edge compute platforms.
  • The transition toward composable software architectures enabled seamless customer relationship management automation, increasing the necessity for multi-agent orchestration tools within corporate ecosystems by over 30%.
  • The development of standardized algorithmic explainability frameworks for human capital management applications reduced compliance risks, accelerating the procurement of intelligent process automation tools across heavily regulated sectors.

Dive into Technavio’s robust research methodology, blending expert interviews, extensive data synthesis, and validated models for unparalleled Ai And Machine Learning In Business Market insights. See full methodology.

Market Scope
Page number 328
Base year 2025
Historic period 2020-2024
Forecast period 2026-2030
Growth momentum & CAGR Accelerate at a CAGR of 30%
Market growth 2026-2030 USD 394309.3 million
Market structure Fragmented
YoY growth 2025-2026(%) 25.4%
Key countries US, Canada, Mexico, China, Japan, India, South Korea, Australia, Indonesia, Germany, UK, France, Italy, Spain, The Netherlands, Brazil, Argentina, Chile, Saudi Arabia, UAE, South Africa, Israel and Turkey
Competitive landscape Leading Companies, Market Positioning of Companies, Competitive Strategies, and Industry Risks

Request Free Sample

Research Analyst Overview

  • The AI And Machine Learning In Business Market demonstrates accelerated maturity as corporate boards increasingly prioritize agentic workflow integration to drive operational resilience and margin expansion. Executive leadership teams are shifting strategic investments toward autonomous ai agents that interface directly with core financial and human capital management systems.
  • This transition directly impacts corporate budgeting and product strategy, as organizations mandate robust algorithmic model governance to ensure compliance with strict cross-border privacy regulations. Enterprises deploying comprehensive automated machine learning pipelines have achieved a 30% reduction in processing time for complex legal contract reviews compared to traditional manual oversight.
  • The necessity to optimize predictive analytics models requires seamless access to enterprise data vector databases, eliminating data silos that historically stalled digital transformation initiatives. By leveraging transformer based foundation models, commercial entities convert vast unstructured datasets into actionable intelligence, enhancing strategic pricing and dynamic resource allocation.
  • The continuous evolution of cloud native machine learning infrastructure enables scalable deployment, firmly establishing cognitive automation as a mandatory pillar for long-term corporate competitiveness and operational agility.

What are the Key Data Covered in this Ai And Machine Learning In Business Market Research and Growth Report?

  • What is the expected growth of the Ai And Machine Learning In Business Market between 2026 and 2030?

    • USD 394.31 billion, at a CAGR of 30%

  • What segmentation does the market report cover?

    • The report is segmented by Component (Solutions, and Services), Sector (Large enterprises, and SMEs), Application (Data analytics, Predictive analytics, Cyber security, Supply chain and inventory management, and Others), End-user (IT and telecom, BFSI, Retail and manufacturing, Healthcare, and Others) and Geography (North America, APAC, Europe, South America, Middle East and Africa)

  • Which regions are analyzed in the report?

    • North America, APAC, Europe, South America and Middle East and Africa

  • What are the key growth drivers and market challenges?

    • Corporate demand for operational workflow automation, Data governance bottlenecks and legacy fragmentation

  • Who are the major players in the Ai And Machine Learning In Business Market?

    • Adobe Inc., Altair Engineering Inc., Alteryx Inc., Amazon.com Inc., C3.ai Inc., Databricks Inc., Dataiku Inc., Google LLC, IBM Corp., Microsoft Corp., NVIDIA Corp., Oracle Corp., Palantir Technologies Inc., Pegasystems Inc., Salesforce Inc., SAP SE, SAS Institute Inc., ServiceNow Inc., Snowflake Inc. and Workday Inc.

Market Research Insights

  • The AI And Machine Learning In Business Market exhibits robust expansion as corporations aggressively modernize core administrative and operational workflows. Organizations prioritizing enterprise resource planning integration achieve a 30% reduction in manual data entry errors, significantly enhancing back-office efficiency.
  • The rapid deployment of customer relationship management automation enables commercial teams to accelerate lead response times by up to 40%, optimizing overall client engagement. Furthermore, advanced supply chain telemetry allows global logistics providers to reduce transit delays by 15% through proactive route adjustments.
  • By leveraging secure edge compute platforms, multinational enterprises effectively process critical operational data locally, bypassing massive cloud bandwidth limitations. These transformative applications underscore the vital necessity of intelligent architectures in sustaining modern corporate competitiveness.

We can help! Our analysts can customize this ai and machine learning in business market research report to meet your requirements.

Get in touch

1. Executive Summary

1.1 Market overview

Executive Summary - Chart on Market Overview
Executive Summary - Data Table on Market Overview
Executive Summary - Chart on Global Market Characteristics
Executive Summary - Chart on Market by Geography
Executive Summary - Chart on Market Segmentation by Component
Executive Summary - Chart on Market Segmentation by Sector
Executive Summary - Chart on Market Segmentation by Application
Executive Summary - Chart on Market Segmentation by End-user
Executive Summary - Chart on Incremental Growth
Executive Summary - Data Table on Incremental Growth
Executive Summary - Chart on Company Market Positioning

2. Technavio Analysis

2.1 Analysis of price sensitivity, lifecycle, customer purchase basket, adoption rates, and purchase criteria

2.2 Criticality of inputs and Factors of differentiation

Chart on Overview on criticality of inputs and factors of differentiation

2.3 Factors of disruption

Chart on Overview on factors of disruption

2.4 Impact of drivers and challenges

Chart on Impact of drivers and challenges in 2025 and 2030

3. Market Landscape

3.1 Market ecosystem

Chart on Parent Market
Data Table on - Parent Market

3.2 Market characteristics

Chart on Market characteristics analysis

3.3 Value chain analysis

Chart on Value chain analysis

4. Market Sizing

4.1 Market definition

Data Table on Offerings of companies included in the market definition

4.2 Market segment analysis

Market segments

4.3 Market size 2025

4.4 Market outlook: Forecast for 2025-2030

Chart on Global - Market size and forecast 2025-2030 ($ million)
Data Table on Global - Market size and forecast 2025-2030 ($ million)
Chart on Global Market: Year-over-year growth 2025-2030 (%)
Data Table on Global Market: Year-over-year growth 2025-2030 (%)

5. Historic Market Size

5.1 Global AI And Machine Learning In Business Market 2020 - 2024

Historic Market Size - Data Table on Global AI And Machine Learning In Business Market 2020 - 2024 ($ million)

5.2 Component segment analysis 2020 - 2024

Historic Market Size - Component Segment 2020 - 2024 ($ million)

5.3 Sector segment analysis 2020 - 2024

Historic Market Size - Sector Segment 2020 - 2024 ($ million)

5.4 Application segment analysis 2020 - 2024

Historic Market Size - Application Segment 2020 - 2024 ($ million)

5.5 End-user segment analysis 2020 - 2024

Historic Market Size - End-user Segment 2020 - 2024 ($ million)

5.6 Geography segment analysis 2020 - 2024

Historic Market Size - Geography Segment 2020 - 2024 ($ million)

5.7 Country segment analysis 2020 - 2024

Historic Market Size - Country Segment 2020 - 2024 ($ million)

6. Qualitative Analysis

6.1 Impact of geopolitical conflicts on global AI and machine learning in business market

7. Five Forces Analysis

7.1 Five forces summary

Five forces analysis - Comparison between 2025 and 2030

7.2 Bargaining power of buyers

Bargaining power of buyers - Impact of key factors 2025 and 2030

7.3 Bargaining power of suppliers

Bargaining power of suppliers - Impact of key factors in 2025 and 2030

7.4 Threat of new entrants

Threat of new entrants - Impact of key factors in 2025 and 2030

7.5 Threat of substitutes

Threat of substitutes - Impact of key factors in 2025 and 2030

7.6 Threat of rivalry

Threat of rivalry - Impact of key factors in 2025 and 2030

7.7 Market condition

Chart on Market condition - Five forces 2025 and 2030

8. Market Segmentation by Component

8.1 Market segments

Chart on Component - Market share 2025-2030 (%)
Data Table on Component - Market share 2025-2030 (%)

8.2 Comparison by Component

Chart on Comparison by Component
Data Table on Comparison by Component

8.3 Solutions - Market size and forecast 2025-2030

Chart on Solutions - Market size and forecast 2025-2030 ($ million)
Data Table on Solutions - Market size and forecast 2025-2030 ($ million)
Chart on Solutions - Year-over-year growth 2025-2030 (%)
Data Table on Solutions - Year-over-year growth 2025-2030 (%)

8.4 Services - Market size and forecast 2025-2030

Chart on Services - Market size and forecast 2025-2030 ($ million)
Data Table on Services - Market size and forecast 2025-2030 ($ million)
Chart on Services - Year-over-year growth 2025-2030 (%)
Data Table on Services - Year-over-year growth 2025-2030 (%)

8.5 Market opportunity by Component

Market opportunity by Component ($ million)
Data Table on Market opportunity by Component ($ million)

9. Market Segmentation by Sector

9.1 Market segments

Chart on Sector - Market share 2025-2030 (%)
Data Table on Sector - Market share 2025-2030 (%)

9.2 Comparison by Sector

Chart on Comparison by Sector
Data Table on Comparison by Sector

9.3 Large enterprises - Market size and forecast 2025-2030

Chart on Large enterprises - Market size and forecast 2025-2030 ($ million)
Data Table on Large enterprises - Market size and forecast 2025-2030 ($ million)
Chart on Large enterprises - Year-over-year growth 2025-2030 (%)
Data Table on Large enterprises - Year-over-year growth 2025-2030 (%)

9.4 SMEs - Market size and forecast 2025-2030

Chart on SMEs - Market size and forecast 2025-2030 ($ million)
Data Table on SMEs - Market size and forecast 2025-2030 ($ million)
Chart on SMEs - Year-over-year growth 2025-2030 (%)
Data Table on SMEs - Year-over-year growth 2025-2030 (%)

9.5 Market opportunity by Sector

Market opportunity by Sector ($ million)
Data Table on Market opportunity by Sector ($ million)

10. Market Segmentation by Application

10.1 Market segments

Chart on Application - Market share 2025-2030 (%)
Data Table on Application - Market share 2025-2030 (%)

10.2 Comparison by Application

Chart on Comparison by Application
Data Table on Comparison by Application

10.3 Data analytics - Market size and forecast 2025-2030

Chart on Data analytics - Market size and forecast 2025-2030 ($ million)
Data Table on Data analytics - Market size and forecast 2025-2030 ($ million)
Chart on Data analytics - Year-over-year growth 2025-2030 (%)
Data Table on Data analytics - Year-over-year growth 2025-2030 (%)

10.4 Predictive analytics - Market size and forecast 2025-2030

Chart on Predictive analytics - Market size and forecast 2025-2030 ($ million)
Data Table on Predictive analytics - Market size and forecast 2025-2030 ($ million)
Chart on Predictive analytics - Year-over-year growth 2025-2030 (%)
Data Table on Predictive analytics - Year-over-year growth 2025-2030 (%)

10.5 Cyber security - Market size and forecast 2025-2030

Chart on Cyber security - Market size and forecast 2025-2030 ($ million)
Data Table on Cyber security - Market size and forecast 2025-2030 ($ million)
Chart on Cyber security - Year-over-year growth 2025-2030 (%)
Data Table on Cyber security - Year-over-year growth 2025-2030 (%)

10.6 Supply chain and inventory management - Market size and forecast 2025-2030

Chart on Supply chain and inventory management - Market size and forecast 2025-2030 ($ million)
Data Table on Supply chain and inventory management - Market size and forecast 2025-2030 ($ million)
Chart on Supply chain and inventory management - Year-over-year growth 2025-2030 (%)
Data Table on Supply chain and inventory management - Year-over-year growth 2025-2030 (%)

10.7 Others - Market size and forecast 2025-2030

Chart on Others - Market size and forecast 2025-2030 ($ million)
Data Table on Others - Market size and forecast 2025-2030 ($ million)
Chart on Others - Year-over-year growth 2025-2030 (%)
Data Table on Others - Year-over-year growth 2025-2030 (%)

10.8 Market opportunity by Application

Market opportunity by Application ($ million)
Data Table on Market opportunity by Application ($ million)

11. Market Segmentation by End-user

11.1 Market segments

Chart on End-user - Market share 2025-2030 (%)
Data Table on End-user - Market share 2025-2030 (%)

11.2 Comparison by End-user

Chart on Comparison by End-user
Data Table on Comparison by End-user

11.3 IT and telecom - Market size and forecast 2025-2030

Chart on IT and telecom - Market size and forecast 2025-2030 ($ million)
Data Table on IT and telecom - Market size and forecast 2025-2030 ($ million)
Chart on IT and telecom - Year-over-year growth 2025-2030 (%)
Data Table on IT and telecom - Year-over-year growth 2025-2030 (%)

11.4 BFSI - Market size and forecast 2025-2030

Chart on BFSI - Market size and forecast 2025-2030 ($ million)
Data Table on BFSI - Market size and forecast 2025-2030 ($ million)
Chart on BFSI - Year-over-year growth 2025-2030 (%)
Data Table on BFSI - Year-over-year growth 2025-2030 (%)

11.5 Retail and manufacturing - Market size and forecast 2025-2030

Chart on Retail and manufacturing - Market size and forecast 2025-2030 ($ million)
Data Table on Retail and manufacturing - Market size and forecast 2025-2030 ($ million)
Chart on Retail and manufacturing - Year-over-year growth 2025-2030 (%)
Data Table on Retail and manufacturing - Year-over-year growth 2025-2030 (%)

11.6 Healthcare - Market size and forecast 2025-2030

Chart on Healthcare - Market size and forecast 2025-2030 ($ million)
Data Table on Healthcare - Market size and forecast 2025-2030 ($ million)
Chart on Healthcare - Year-over-year growth 2025-2030 (%)
Data Table on Healthcare - Year-over-year growth 2025-2030 (%)

11.7 Others - Market size and forecast 2025-2030

Chart on Others - Market size and forecast 2025-2030 ($ million)
Data Table on Others - Market size and forecast 2025-2030 ($ million)
Chart on Others - Year-over-year growth 2025-2030 (%)
Data Table on Others - Year-over-year growth 2025-2030 (%)

11.8 Market opportunity by End-user

Market opportunity by End-user ($ million)
Data Table on Market opportunity by End-user ($ million)

12. Customer Landscape

12.1 Customer landscape overview

Analysis of price sensitivity, lifecycle, customer purchase basket, adoption rates, and purchase criteria

13. Geographic Landscape

13.1 Geographic segmentation

Chart on Market share by geography 2025-2030 (%)
Data Table on Market share by geography 2025-2030 (%)

13.2 Geographic comparison

Chart on Geographic comparison
Data Table on Geographic comparison

13.3 North America - Market size and forecast 2025-2030

Chart on North America - Market size and forecast 2025-2030 ($ million)
Data Table on North America - Market size and forecast 2025-2030 ($ million)
Chart on North America - Year-over-year growth 2025-2030 (%)
Data Table on North America - Year-over-year growth 2025-2030 (%)
Chart on Regional Comparison - North America
Data Table on Regional Comparison - North America

13.3.1 US - Market size and forecast 2025-2030

Chart on US - Market size and forecast 2025-2030 ($ million)
Data Table on US - Market size and forecast 2025-2030 ($ million)
Chart on US - Year-over-year growth 2025-2030 (%)
Data Table on US - Year-over-year growth 2025-2030 (%)

13.3.2 Canada - Market size and forecast 2025-2030

Chart on Canada - Market size and forecast 2025-2030 ($ million)
Data Table on Canada - Market size and forecast 2025-2030 ($ million)
Chart on Canada - Year-over-year growth 2025-2030 (%)
Data Table on Canada - Year-over-year growth 2025-2030 (%)

13.3.3 Mexico - Market size and forecast 2025-2030

Chart on Mexico - Market size and forecast 2025-2030 ($ million)
Data Table on Mexico - Market size and forecast 2025-2030 ($ million)
Chart on Mexico - Year-over-year growth 2025-2030 (%)
Data Table on Mexico - Year-over-year growth 2025-2030 (%)

13.4 APAC - Market size and forecast 2025-2030

Chart on APAC - Market size and forecast 2025-2030 ($ million)
Data Table on APAC - Market size and forecast 2025-2030 ($ million)
Chart on APAC - Year-over-year growth 2025-2030 (%)
Data Table on APAC - Year-over-year growth 2025-2030 (%)
Chart on Regional Comparison - APAC
Data Table on Regional Comparison - APAC

13.4.1 China - Market size and forecast 2025-2030

Chart on China - Market size and forecast 2025-2030 ($ million)
Data Table on China - Market size and forecast 2025-2030 ($ million)
Chart on China - Year-over-year growth 2025-2030 (%)
Data Table on China - Year-over-year growth 2025-2030 (%)

13.4.2 Japan - Market size and forecast 2025-2030

Chart on Japan - Market size and forecast 2025-2030 ($ million)
Data Table on Japan - Market size and forecast 2025-2030 ($ million)
Chart on Japan - Year-over-year growth 2025-2030 (%)
Data Table on Japan - Year-over-year growth 2025-2030 (%)

13.4.3 India - Market size and forecast 2025-2030

Chart on India - Market size and forecast 2025-2030 ($ million)
Data Table on India - Market size and forecast 2025-2030 ($ million)
Chart on India - Year-over-year growth 2025-2030 (%)
Data Table on India - Year-over-year growth 2025-2030 (%)

13.4.4 South Korea - Market size and forecast 2025-2030

Chart on South Korea - Market size and forecast 2025-2030 ($ million)
Data Table on South Korea - Market size and forecast 2025-2030 ($ million)
Chart on South Korea - Year-over-year growth 2025-2030 (%)
Data Table on South Korea - Year-over-year growth 2025-2030 (%)

13.4.5 Australia - Market size and forecast 2025-2030

Chart on Australia - Market size and forecast 2025-2030 ($ million)
Data Table on Australia - Market size and forecast 2025-2030 ($ million)
Chart on Australia - Year-over-year growth 2025-2030 (%)
Data Table on Australia - Year-over-year growth 2025-2030 (%)

13.4.6 Indonesia - Market size and forecast 2025-2030

Chart on Indonesia - Market size and forecast 2025-2030 ($ million)
Data Table on Indonesia - Market size and forecast 2025-2030 ($ million)
Chart on Indonesia - Year-over-year growth 2025-2030 (%)
Data Table on Indonesia - Year-over-year growth 2025-2030 (%)

13.5 Europe - Market size and forecast 2025-2030

Chart on Europe - Market size and forecast 2025-2030 ($ million)
Data Table on Europe - Market size and forecast 2025-2030 ($ million)
Chart on Europe - Year-over-year growth 2025-2030 (%)
Data Table on Europe - Year-over-year growth 2025-2030 (%)
Chart on Regional Comparison - Europe
Data Table on Regional Comparison - Europe

13.5.1 Germany - Market size and forecast 2025-2030

Chart on Germany - Market size and forecast 2025-2030 ($ million)
Data Table on Germany - Market size and forecast 2025-2030 ($ million)
Chart on Germany - Year-over-year growth 2025-2030 (%)
Data Table on Germany - Year-over-year growth 2025-2030 (%)

13.5.2 UK - Market size and forecast 2025-2030

Chart on UK - Market size and forecast 2025-2030 ($ million)
Data Table on UK - Market size and forecast 2025-2030 ($ million)
Chart on UK - Year-over-year growth 2025-2030 (%)
Data Table on UK - Year-over-year growth 2025-2030 (%)

13.5.3 France - Market size and forecast 2025-2030

Chart on France - Market size and forecast 2025-2030 ($ million)
Data Table on France - Market size and forecast 2025-2030 ($ million)
Chart on France - Year-over-year growth 2025-2030 (%)
Data Table on France - Year-over-year growth 2025-2030 (%)

13.5.4 Italy - Market size and forecast 2025-2030

Chart on Italy - Market size and forecast 2025-2030 ($ million)
Data Table on Italy - Market size and forecast 2025-2030 ($ million)
Chart on Italy - Year-over-year growth 2025-2030 (%)
Data Table on Italy - Year-over-year growth 2025-2030 (%)

13.5.5 Spain - Market size and forecast 2025-2030

Chart on Spain - Market size and forecast 2025-2030 ($ million)
Data Table on Spain - Market size and forecast 2025-2030 ($ million)
Chart on Spain - Year-over-year growth 2025-2030 (%)
Data Table on Spain - Year-over-year growth 2025-2030 (%)

13.5.6 The Netherlands - Market size and forecast 2025-2030

Chart on The Netherlands - Market size and forecast 2025-2030 ($ million)
Data Table on The Netherlands - Market size and forecast 2025-2030 ($ million)
Chart on The Netherlands - Year-over-year growth 2025-2030 (%)
Data Table on The Netherlands - Year-over-year growth 2025-2030 (%)

13.6 South America - Market size and forecast 2025-2030

Chart on South America - Market size and forecast 2025-2030 ($ million)
Data Table on South America - Market size and forecast 2025-2030 ($ million)
Chart on South America - Year-over-year growth 2025-2030 (%)
Data Table on South America - Year-over-year growth 2025-2030 (%)
Chart on Regional Comparison - South America
Data Table on Regional Comparison - South America

13.6.1 Brazil - Market size and forecast 2025-2030

Chart on Brazil - Market size and forecast 2025-2030 ($ million)
Data Table on Brazil - Market size and forecast 2025-2030 ($ million)
Chart on Brazil - Year-over-year growth 2025-2030 (%)
Data Table on Brazil - Year-over-year growth 2025-2030 (%)

13.6.2 Argentina - Market size and forecast 2025-2030

Chart on Argentina - Market size and forecast 2025-2030 ($ million)
Data Table on Argentina - Market size and forecast 2025-2030 ($ million)
Chart on Argentina - Year-over-year growth 2025-2030 (%)
Data Table on Argentina - Year-over-year growth 2025-2030 (%)

13.6.3 Chile - Market size and forecast 2025-2030

Chart on Chile - Market size and forecast 2025-2030 ($ million)
Data Table on Chile - Market size and forecast 2025-2030 ($ million)
Chart on Chile - Year-over-year growth 2025-2030 (%)
Data Table on Chile - Year-over-year growth 2025-2030 (%)

13.7 Middle East and Africa - Market size and forecast 2025-2030

Chart on Middle East and Africa - Market size and forecast 2025-2030 ($ million)
Data Table on Middle East and Africa - Market size and forecast 2025-2030 ($ million)
Chart on Middle East and Africa - Year-over-year growth 2025-2030 (%)
Data Table on Middle East and Africa - Year-over-year growth 2025-2030 (%)
Chart on Regional Comparison - Middle East and Africa
Data Table on Regional Comparison - Middle East and Africa

13.7.1 Saudi Arabia - Market size and forecast 2025-2030

Chart on Saudi Arabia - Market size and forecast 2025-2030 ($ million)
Data Table on Saudi Arabia - Market size and forecast 2025-2030 ($ million)
Chart on Saudi Arabia - Year-over-year growth 2025-2030 (%)
Data Table on Saudi Arabia - Year-over-year growth 2025-2030 (%)

13.7.2 UAE - Market size and forecast 2025-2030

Chart on UAE - Market size and forecast 2025-2030 ($ million)
Data Table on UAE - Market size and forecast 2025-2030 ($ million)
Chart on UAE - Year-over-year growth 2025-2030 (%)
Data Table on UAE - Year-over-year growth 2025-2030 (%)

13.7.3 South Africa - Market size and forecast 2025-2030

Chart on South Africa - Market size and forecast 2025-2030 ($ million)
Data Table on South Africa - Market size and forecast 2025-2030 ($ million)
Chart on South Africa - Year-over-year growth 2025-2030 (%)
Data Table on South Africa - Year-over-year growth 2025-2030 (%)

13.7.4 Israel - Market size and forecast 2025-2030

Chart on Israel - Market size and forecast 2025-2030 ($ million)
Data Table on Israel - Market size and forecast 2025-2030 ($ million)
Chart on Israel - Year-over-year growth 2025-2030 (%)
Data Table on Israel - Year-over-year growth 2025-2030 (%)

13.7.5 Turkey - Market size and forecast 2025-2030

Chart on Turkey - Market size and forecast 2025-2030 ($ million)
Data Table on Turkey - Market size and forecast 2025-2030 ($ million)
Chart on Turkey - Year-over-year growth 2025-2030 (%)
Data Table on Turkey - Year-over-year growth 2025-2030 (%)

13.8 Market opportunity by geography

Market opportunity by geography ($ million)
Data Tables on Market opportunity by geography ($ million)

14. Drivers, Challenges, and Opportunity

14.1 Market drivers

Corporate demand for operational workflow automation
Proliferation of enterprise data and predictive analytics
Rapid integration of generative intelligence applications

14.2 Market challenges

Data governance bottlenecks and legacy fragmentation
Rising infrastructure costs and compute constraints
Strict regulatory oversight and compliance mandates

14.3 Impact of drivers and challenges

Impact of drivers and challenges in 2025 and 2030

14.4 Market opportunities

Transition to autonomous AI agents and multi-agent orchestration
Expansion of hybrid on-premises and edge deployments
Integration of governance and responsible operations platforms

15. Competitive Landscape

15.1 Overview

15.2

Overview on criticality of inputs and factors of differentiation

15.3 Landscape disruption

Overview on factors of disruption

15.4 Industry risks

Impact of key risks on business

16. Competitive Analysis

16.1 Companies profiled

Companies covered

16.2 Company ranking index

16.3 Market positioning of companies

Matrix on companies position and classification

16.4 Adobe Inc.

Adobe Inc. - Overview
Adobe Inc. - Business segments
Adobe Inc. - Key news
Adobe Inc. - Key offerings
Adobe Inc. - Segment focus
SWOT

16.5 Altair Engineering Inc.

Altair Engineering Inc. - Overview
Altair Engineering Inc. - Product / Service
Altair Engineering Inc. - Key offerings
SWOT

16.6 Amazon.com Inc.

Amazon.com Inc. - Overview
Amazon.com Inc. - Business segments
Amazon.com Inc. - Key news
Amazon.com Inc. - Key offerings
Amazon.com Inc. - Segment focus
SWOT

16.7 Google LLC

Google LLC - Overview
Google LLC - Product / Service
Google LLC - Key news
Google LLC - Key offerings
SWOT

16.8 IBM Corp.

IBM Corp. - Overview
IBM Corp. - Business segments
IBM Corp. - Key news
IBM Corp. - Key offerings
IBM Corp. - Segment focus
SWOT

16.9 Microsoft Corp.

Microsoft Corp. - Overview
Microsoft Corp. - Business segments
Microsoft Corp. - Key news
Microsoft Corp. - Key offerings
Microsoft Corp. - Segment focus
SWOT

16.10 NVIDIA Corp.

NVIDIA Corp. - Overview
NVIDIA Corp. - Business segments
NVIDIA Corp. - Key news
NVIDIA Corp. - Key offerings
NVIDIA Corp. - Segment focus
SWOT

16.11 Oracle Corp.

Oracle Corp. - Overview
Oracle Corp. - Business segments
Oracle Corp. - Key news
Oracle Corp. - Key offerings
Oracle Corp. - Segment focus
SWOT

16.12 Palantir Technologies Inc.

Palantir Technologies Inc. - Overview
Palantir Technologies Inc. - Business segments
Palantir Technologies Inc. - Key offerings
Palantir Technologies Inc. - Segment focus
SWOT

16.13 Pegasystems Inc.

Pegasystems Inc. - Overview
Pegasystems Inc. - Business segments
Pegasystems Inc. - Key offerings
Pegasystems Inc. - Segment focus
SWOT

16.14 Salesforce Inc.

Salesforce Inc. - Overview
Salesforce Inc. - Business segments
Salesforce Inc. - Key news
Salesforce Inc. - Key offerings
Salesforce Inc. - Segment focus
SWOT

16.15 SAP SE

SAP SE - Overview
SAP SE - Business segments
SAP SE - Key news
SAP SE - Key offerings
SAP SE - Segment focus
SWOT

16.16 ServiceNow Inc.

ServiceNow Inc. - Overview
ServiceNow Inc. - Product / Service
ServiceNow Inc. - Key news
ServiceNow Inc. - Key offerings
SWOT

16.17 Snowflake Inc.

Snowflake Inc. - Overview
Snowflake Inc. - Business segments
Snowflake Inc. - Key news
Snowflake Inc. - Key offerings
Snowflake Inc. - Segment focus
SWOT

16.18 Workday Inc.

Workday Inc. - Overview
Workday Inc. - Product / Service
Workday Inc. - Key news
Workday Inc. - Key offerings
SWOT

17. Appendix

17.1 Scope of the report

Market definition
Objectives
Notes and caveats

17.2 Inclusions and exclusions checklist

Inclusions checklist
Exclusions checklist

17.3 Currency conversion rates for US$

17.4 Research methodology

17.5 Data procurement

Information sources

17.6 Data validation

17.7 Validation techniques employed for market sizing

17.8 Data synthesis

17.9 360 degree market analysis

17.10 List of abbreviations

Research Methodology

Technavio presents a detailed picture of the market by way of study, synthesis, and summation of data from multiple sources. The analysts have presented the various facets of the market with a particular focus on identifying the key industry influencers. The data thus presented is comprehensive, reliable, and the result of extensive research, both primary and secondary.

INFORMATION SOURCES

Primary sources

  • Manufacturers and suppliers
  • Channel partners
  • Industry experts
  • Strategic decision makers

Secondary sources

  • Industry journals and periodicals
  • Government data
  • Financial reports of key industry players
  • Historical data
  • Press releases

DATA ANALYSIS

Data Synthesis

  • Collation of data
  • Estimation of key figures
  • Analysis of derived insights

Data Validation

  • Triangulation with data models
  • Reference against proprietary databases
  • Corroboration with industry experts

REPORT WRITING

Qualitative

  • Market drivers
  • Market challenges
  • Market trends
  • Five forces analysis

Quantitative

  • Market size and forecast
  • Market segmentation
  • Geographical insights
  • Competitive landscape

Interested in this report?

Get your sample now to see our research methodology and insights!

Download Now

Frequently Asked Questions

Ai And Machine Learning In Business market growth will increase by USD 394309.3 million during 2026-2030.

The Ai And Machine Learning In Business market is expected to grow at a CAGR of 30% during 2026-2030.

Ai And Machine Learning In Business market is segmented by Component (Solutions, Services) Sector (Large enterprises, SMEs) Application (Data analytics, Predictive analytics, Cyber security, Supply chain and inventory management, Others) End-user (IT and telecom, BFSI, Retail and manufacturing, Healthcare, Others)

Adobe Inc., Altair Engineering Inc., Alteryx Inc., Amazon.com Inc., C3.ai Inc., Databricks Inc., Dataiku Inc., Google LLC, IBM Corp., Microsoft Corp., NVIDIA Corp., Oracle Corp., Palantir Technologies Inc., Pegasystems Inc., Salesforce Inc., SAP SE, SAS Institute Inc., ServiceNow Inc., Snowflake Inc., Workday Inc. are a few of the key vendors in the Ai And Machine Learning In Business market.

APAC will register the highest growth rate of 36.1% among the other regions. Therefore, the Ai And Machine Learning In Business market in APAC is expected to garner significant business opportunities for the vendors during the forecast period.

US, Canada, Mexico, China, Japan, India, South Korea, Australia, Indonesia, Germany, UK, France, Italy, Spain, The Netherlands, Brazil, Argentina, Chile, Saudi Arabia, UAE, South Africa, Israel, Turkey

  • Corporate demand for operational workflow automation is the driving factor this market.

The Ai And Machine Learning In Business market vendors should focus on grabbing business opportunities from the Component segment as it accounted for the largest market share in the base year.
RIA - Research AI Assistant
Ask RIA