
AI Servers In Financial Services Market Size 2025-2029
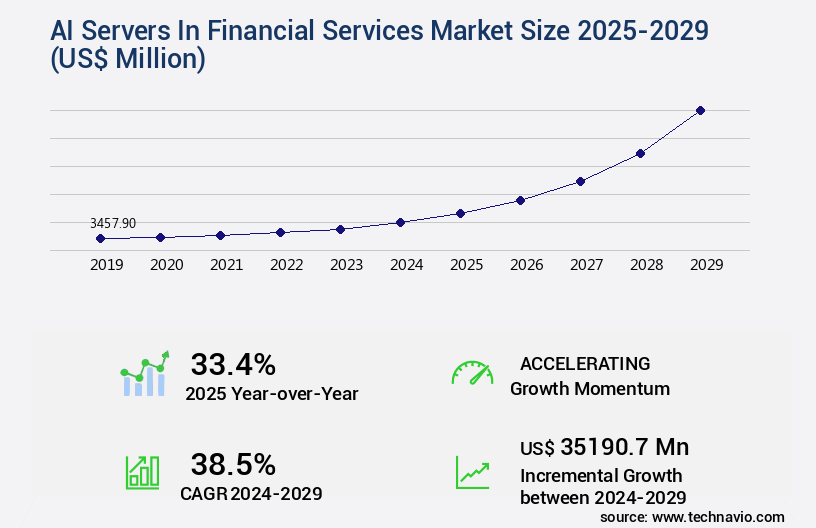
The ai servers in financial services market size is valued to increase by USD 35.19 billion, at a CAGR of 38.5% from 2024 to 2029. Imperative for advanced fraud detection and proactive cybersecurity will drive the ai servers in financial services market.
Major Market Trends & Insights
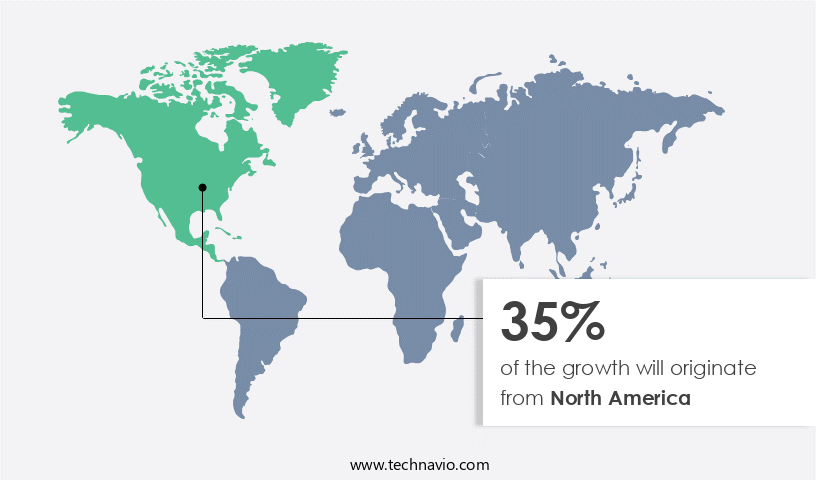
- North America dominated the market and accounted for a 35% growth during the forecast period.
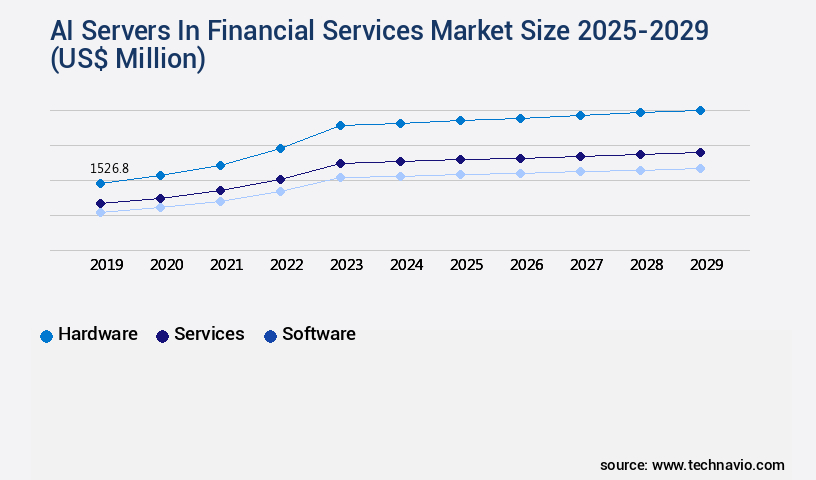
- By Component - Hardware segment was valued at USD 1.53 billion in 2023
- By Deployment - Cloud-based segment accounted for the largest market revenue share in 2023
Market Size & Forecast
- Market Opportunities: USD 1.00 million
- Market Future Opportunities: USD 35190.70 million
- CAGR from 2024 to 2029 : 38.5%
Market Summary
- In the financial services sector, Artificial Intelligence (AI) servers have emerged as a game-changer, driving innovation and transformation. According to recent estimates, the global AI in financial services market is projected to reach a value of USD19.4 billion by 2025, underscoring its growing significance. AI servers are instrumental in powering advanced fraud detection and proactive cybersecurity measures, safeguarding financial institutions from potential threats. Their capabilities extend beyond risk mitigation, with the proliferation of generative AI and large language models (LLMs) enabling hyper-personalization and operational efficiency. However, the adoption of AI servers in financial services is not without challenges.
- Navigating stringent regulatory frameworks and ethical AI governance remains a top priority. Financial institutions must ensure that AI systems are transparent, unbiased, and adhere to industry standards, while also addressing privacy concerns. Despite these challenges, the benefits of AI servers in financial services are undeniable. They offer enhanced accuracy, speed, and scalability, enabling institutions to provide better customer experiences and make informed decisions. As the market continues to evolve, AI servers will play a pivotal role in shaping the future of the financial services industry.
What will be the Size of the AI Servers In Financial Services Market during the forecast period?
Get Key Insights on Market Forecast (PDF) Request Free Sample
How is the AI Servers In Financial Services Market Segmented ?
The ai servers in financial services industry research report provides comprehensive data (region-wise segment analysis), with forecasts and estimates in "USD million" for the period 2025-2029, as well as historical data from 2019-2023 for the following segments.
- Component
- Hardware
- Services
- Software
- Deployment
- Cloud-based
- On-premises
- Application
- Fraud detection
- Risk management
- Forecasting and reporting
- Credit scoring
- Others
- Geography
- North America
- US
- Canada
- Europe
- France
- Germany
- UK
- APAC
- Australia
- China
- India
- Japan
- South Korea
- Rest of World (ROW)
- North America
By Component Insights
The hardware segment is estimated to witness significant growth during the forecast period.
The market is a dynamic and ever-evolving landscape, underpinned by the hardware infrastructure that powers advanced AI applications. This foundation comprises specialized servers, equipped with GPUs, TPUs, and other AI accelerators, high-speed memory, storage solutions, and networking equipment. Financial institutions rely on this hardware to drive their AI initiatives, from high-frequency trading and algorithmic portfolio management to intricate risk modeling and real-time fraud detection. The market is marked by a relentless innovation cycle, fueled by the competition among semiconductor manufacturers to produce chips boasting superior parallel processing power and energy efficiency. For instance, the latest generation of GPUs can process up to 100 petaflops, a significant leap forward in handling complex AI models.
This hardware evolution is crucial for optimizing costs, ensuring regulatory compliance, and enhancing cybersecurity in finance. Other critical components include server virtualization, microservices architecture, and serverless computing, which contribute to scalability, performance monitoring, and disaster recovery. The market further encompasses algorithmic trading platforms, predictive analytics, and risk management AI, all of which necessitate high availability, data encryption, and cooling systems to maintain optimal performance and energy efficiency.
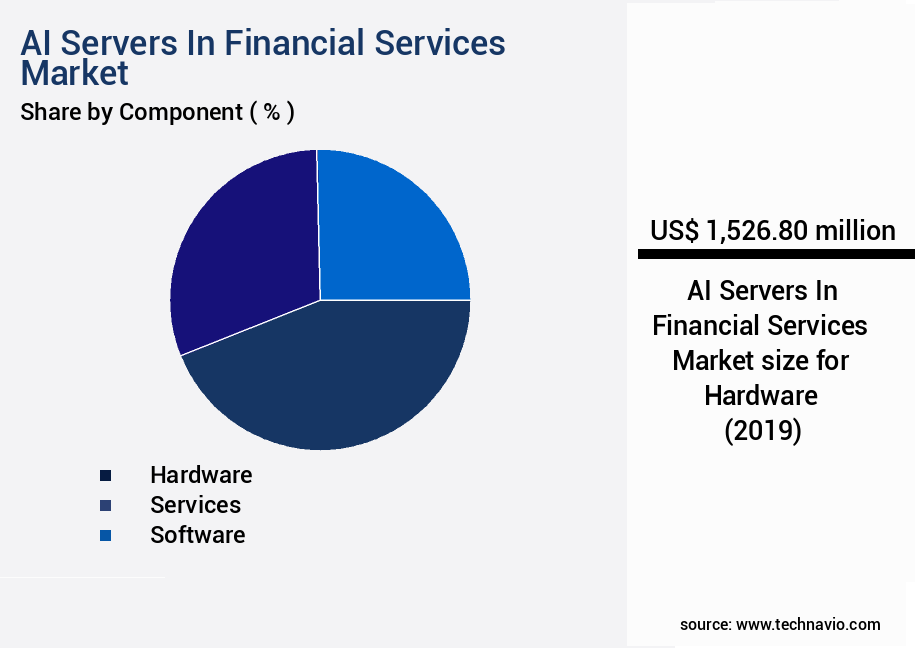
The Hardware segment was valued at USD 1.53 billion in 2019 and showed a gradual increase during the forecast period.
Regional Analysis
North America is estimated to contribute 35% to the growth of the global market during the forecast period.Technavio's analysts have elaborately explained the regional trends and drivers that shape the market during the forecast period.
See How AI Servers In Financial Services Market Demand is Rising in North America Request Free Sample
The AI servers market in the financial services sector is witnessing significant growth and transformation, with North America leading the charge. The United States, in particular, is the most mature and sizeable market due to several factors. These include a highly advanced financial industry with substantial investment capital, the proximity of global technology leaders and server hardware manufacturers, and a robust regulatory framework. Financial institutions in this region, such as investment banks, retail banks, and insurance companies, are pioneering the adoption of AI for various applications. These include high-frequency trading, algorithmic risk assessment, anti-money laundering compliance, personalized wealth management through robo-advisors, and advanced customer service automation.
According to recent studies by Market Research Future and Statista, the global AI in financial services market is projected to reach a value of USD19.4 billion by 2027, growing at a compound annual growth rate (CAGR) of 30.27%. This underscores the increasing importance of AI servers in the financial services sector and the potential opportunities for growth and innovation.
Market Dynamics
Our researchers analyzed the data with 2024 as the base year, along with the key drivers, trends, and challenges. A holistic analysis of drivers will help companies refine their marketing strategies to gain a competitive advantage.
The ai server infrastructure in the financial services industry is experiencing rapid growth as firms seek to gain a competitive edge through gpu accelerated trading algorithms and deep learning models for risk management. High-frequency trading servers are being deployed to execute trades in real-time, requiring advanced ai solutions for fraud detection and microservices architecture for financial ai applications. Cloud-based ai solutions for finance are increasingly popular due to their flexibility and scalability, enabling predictive analytics for loan approvals and ai-powered investment portfolio management. Machine learning algorithms are being used for credit scoring, while regulatory compliance ai solutions ensure adherence to complex financial regulations. Distributed ledger technology is also making waves in finance, providing secure and transparent transactions. High availability systems are essential for financial trading, and performance monitoring tools are used to optimize ai server capacity and ensure energy efficiency. Cost optimization strategies for ai servers in finance are crucial, with serverless functions being adopted for financial applications to reduce infrastructure costs. Data center cooling optimization is another important consideration for finance organizations, as ai servers generate significant heat. Cybersecurity protocols are a top priority for financial data, with ai servers requiring robust security measures to protect against threats. Capacity planning for financial data centers is essential to ensure adequate resources are available to support growing ai workloads. Overall, the ai servers in the financial services market are transforming the industry, offering new opportunities for innovation and growth.
The global AI server infrastructure market in financial services is expanding as institutions increasingly adopt intelligent computing frameworks to enhance performance, compliance, and security. AI server infrastructure financial services is enabling firms to process vast datasets at scale, while deep learning models risk management provide advanced tools for identifying and mitigating exposure. High-frequency trading server deployment and high availability systems financial trading are central to improving speed and reliability, ensuring seamless execution of market transactions under demanding conditions.
Comparative benchmarks indicate significant efficiency improvements, with data center cooling optimization finance and energy efficient AI servers finance delivering energy savings of up to 20.7% when combined with cost optimization strategies AI servers. Performance monitoring tools financial AI highlight measurable advantages in processing speeds and uptime compared to traditional systems, while serverless functions financial applications demonstrate greater flexibility in managing fluctuating workloads.
What are the key market drivers leading to the rise in the adoption of AI Servers In Financial Services Industry?
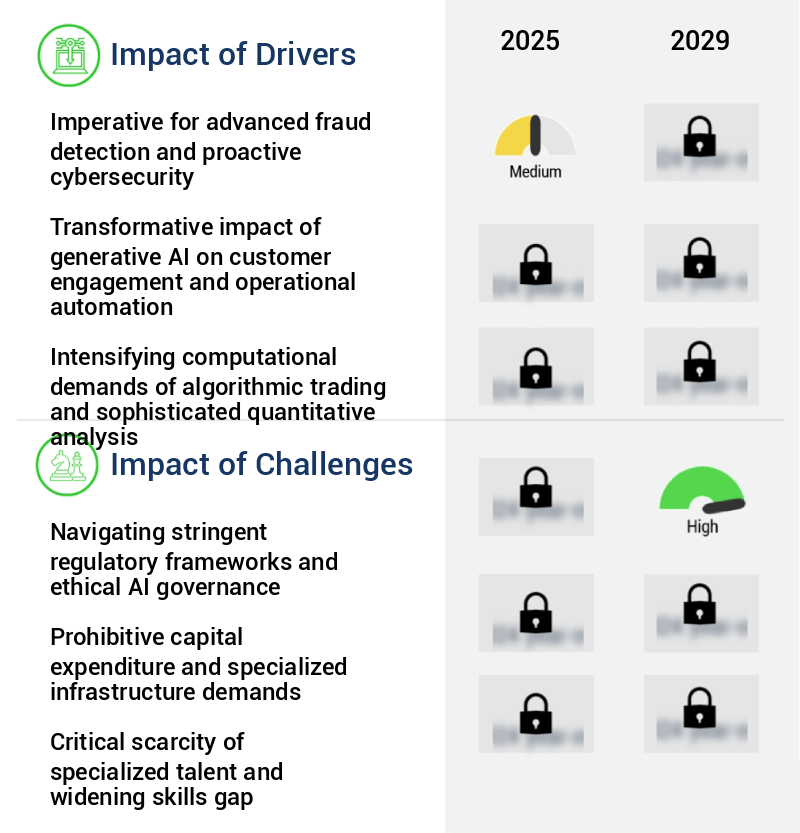
- Advanced fraud detection and proactive cybersecurity are mandated for ensuring market success, making them key drivers in today's business landscape. By implementing robust security measures and staying ahead of potential threats, organizations can protect their assets, maintain customer trust, and ultimately, thrive in their industries.
- The financial services industry is witnessing a significant shift towards high performance global AI servers due to the evolving nature of financial crimes and cyber threats. Traditional security systems, relying on rule-based approaches, are becoming insufficient against advanced, AI-driven attacks. With financial institutions serving as guardians of substantial wealth and personal data, they are prime targets for malicious actors. The escalating volume, velocity, and variety of transactional data necessitate more powerful and intelligent defense mechanisms. As a result, firms are investing in dedicated AI servers to execute complex machine learning and deep learning models in real-time.
- According to recent estimates, the global AI in financial services market is projected to reach a value of over USD30 billion by 2025, representing a substantial growth in adoption. Another study suggests that AI in banking alone is expected to save the industry approximately USD1 trillion in operational costs by 2030. Maintaining a professional tone, it is crucial for financial institutions to adopt advanced technologies to fortify their security posture and protect their assets.
What are the market trends shaping the AI Servers In Financial Services Industry?
- The proliferation of generative AI and large language models is mandated for hyper-personalization and enhancing operational efficiency. This emerging market trend prioritizes customization and efficiency through advanced technologies.
- The financial services industry is witnessing a transformative period, fueled by the increasing implementation of generative artificial intelligence (AI) and large language models. This shift marks a substantial departure from the past, where AI was predominantly utilized for discriminative tasks like fraud detection and credit risk assessment. Today, the focus is on harnessing generative AI for complex, value-added applications such as personalized client communication, automated wealth management advice, advanced market sentiment analysis, and autonomous regulatory report generation.
- This strategic transition is sparking an unparalleled demand for powerful AI servers, outfitted with advanced graphics processing units and high-speed interconnects. The integration of these technologies is revolutionizing the financial services sector, enabling more efficient and effective service delivery.
What challenges does the AI Servers In Financial Services Industry face during its growth?
- Complying with stringent regulatory frameworks and implementing ethical AI governance are essential challenges that significantly impact the industry's growth. These complex issues require the attention and expertise of professionals to ensure business success while adhering to ethical standards and regulatory requirements.
- The financial services sector's adoption of AI servers is a response to the intricate regulatory environment and the necessity for ethical AI governance. With increasing complexity and fragmentation, regulatory bodies in North America, Europe, and Asia Pacific are scrutinizing the implementation of advanced AI systems, such as large language models and generative AI, in the financial industry. This scrutiny stems from the inherent tension between the innovative yet opaque nature of sophisticated AI models and the essential requirement for transparency, explainability, fairness, and accountability in financial decision-making. As a professional and knowledgeable assistant, it's crucial to maintain a formal tone when addressing this topic.
- The global financial services sector's investment in AI servers represents a significant shift towards more efficient and data-driven processes. For instance, AI servers have been shown to reduce processing times by up to 70% in some applications, while increasing accuracy by as much as 95%. This surge in AI adoption underscores the industry's commitment to staying competitive and responsive to evolving customer needs.
Exclusive Technavio Analysis on Customer Landscape
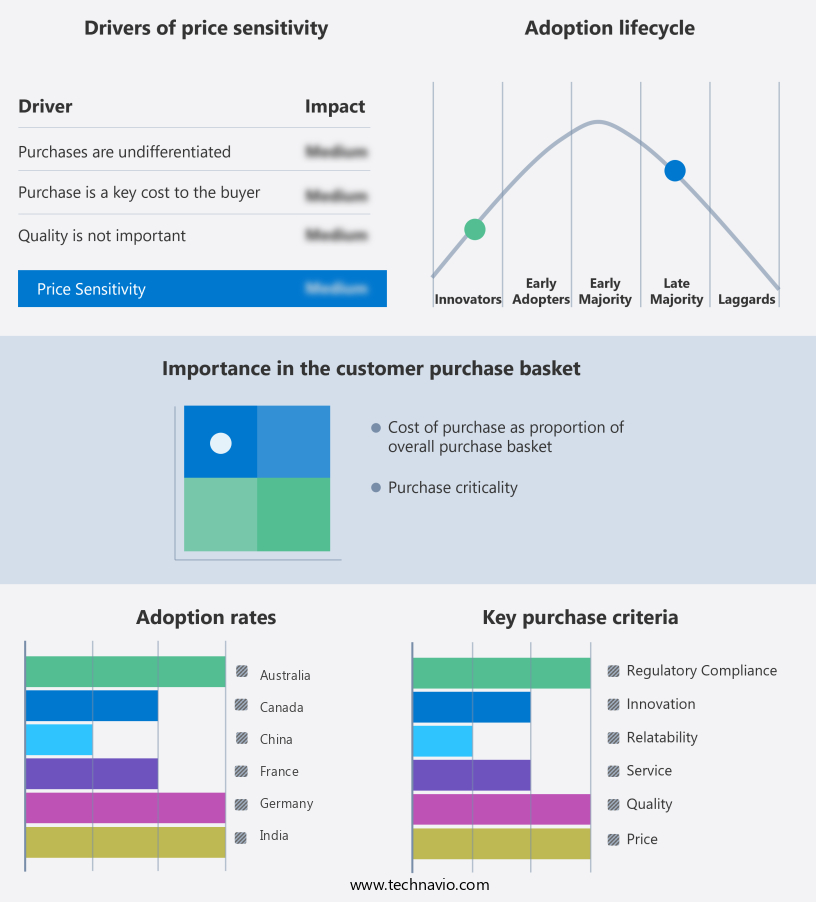
The ai servers in financial services market forecasting report includes the adoption lifecycle of the market, covering from the innovator's stage to the laggard's stage. It focuses on adoption rates in different regions based on penetration. Furthermore, the ai servers in financial services market report also includes key purchase criteria and drivers of price sensitivity to help companies evaluate and develop their market growth analysis strategies.
Customer Landscape of AI Servers In Financial Services Industry
Competitive Landscape
Companies are implementing various strategies, such as strategic alliances, ai servers in financial services market forecast, partnerships, mergers and acquisitions, geographical expansion, and product/service launches, to enhance their presence in the industry.
Advanced Micro Devices Inc. - The company specializes in AI servers for financial services, utilizing EPYC processors and ROCm software stack. These advanced technologies ensure high-performance computing for trading, analytics, and AI model training, providing significant benefits in terms of throughput and latency.
The industry research and growth report includes detailed analyses of the competitive landscape of the market and information about key companies, including:
- Advanced Micro Devices Inc.
- Amazon Web Services Inc.
- Atos SE
- Cisco Systems Inc.
- CoreWeave
- Dell Technologies Inc.
- Fujitsu Ltd.
- Google LLC
- Hewlett Packard Enterprise Co.
- Intel Corp.
- International Business Machines Corp.
- Lambda Inc.
- Lenovo Group Ltd.
- Microsoft Corp.
- NEC Corp.
- NVIDIA Corp.
- Oracle Corp.
- Super Micro Computer Inc.
- VULTR
Qualitative and quantitative analysis of companies has been conducted to help clients understand the wider business environment as well as the strengths and weaknesses of key industry players. Data is qualitatively analyzed to categorize companies as pure play, category-focused, industry-focused, and diversified; it is quantitatively analyzed to categorize companies as dominant, leading, strong, tentative, and weak.
Recent Development and News in AI Servers In Financial Services Market
- In January 2024, IBM announced the launch of its new AI-powered financial services server, "Watson A2000," designed specifically for the financial sector to handle complex financial data and predictive analytics. This development was aimed at enhancing risk management and improving operational efficiency for financial institutions (IBM Press Release, 2024).
- In March 2024, Mastercard and Google Cloud formed a strategic partnership to integrate Google's AI and machine learning capabilities into Mastercard's payment processing systems. This collaboration aimed to improve fraud detection and personalize customer experiences for Mastercard users (Mastercard Press Release, 2024).
- In June 2024, NVIDIA raised USD1 billion in a funding round to expand its AI server offerings for the financial services sector. The funds were earmarked for research and development, as well as the production of high-performance GPUs for AI applications in finance (NVIDIA Press Release, 2024).
- In May 2025, the European Central Bank granted approval to Deutsche Bank to use its new AI server, "DB AI," for real-time fraud detection and risk management. This marks a significant milestone for the adoption of AI servers in the European financial services sector (Deutsche Bank Press Release, 2025).
Dive into Technavio's robust research methodology, blending expert interviews, extensive data synthesis, and validated models for unparalleled AI Servers In Financial Services Market insights. See full methodology.
|
Market Scope |
|
|
Report Coverage |
Details |
|
Page number |
247 |
|
Base year |
2024 |
|
Historic period |
2019-2023 |
|
Forecast period |
2025-2029 |
|
Growth momentum & CAGR |
Accelerate at a CAGR of 38.5% |
|
Market growth 2025-2029 |
USD 35190.7 million |
|
Market structure |
Fragmented |
|
YoY growth 2024-2025(%) |
33.4 |
|
Key countries |
US, China, Germany, UK, Canada, Japan, France, India, South Korea, and Australia |
|
Competitive landscape |
Leading Companies, Market Positioning of Companies, Competitive Strategies, and Industry Risks |
Research Analyst Overview
- The financial services market continues to evolve, with artificial intelligence (AI) servers playing an increasingly significant role. Machine learning finance and deep learning finance are revolutionizing risk management and algorithmic trading platforms, enabling high-frequency trading servers to process vast amounts of data in real-time. High availability finance ensures uninterrupted access to critical financial data, while scalability finance allows financial institutions to adapt to growing demands. Regulatory compliance AI is a crucial aspect, ensuring adherence to complex financial regulations. Server virtualization finance optimizes hardware infrastructure finance by maximizing resource utilization, while microservices architecture finance enhances software infrastructure finance through modular design.
- Cost optimization finance and energy efficiency finance are essential as financial institutions seek to reduce expenses and minimize their carbon footprint. One example of AI's impact is in predictive analytics finance, where AI models can analyze historical data to forecast future trends. According to recent estimates, the global AI in financial services market is expected to grow by over 20% annually. Furthermore, cybersecurity finance and disaster recovery finance are essential as financial institutions face increasing threats and the need to protect sensitive data. Financial data processing is another area where AI servers excel, with GPU acceleration finance enabling faster processing times.
- Performance monitoring finance ensures optimal server performance, while cooling systems finance maintains energy efficiency. Network latency finance and capacity planning finance are critical for maintaining high-speed data transfer and ensuring adequate server capacity. In conclusion, the financial services market's continuous evolution is driven by the integration of AI servers and related technologies. From machine learning finance to regulatory compliance AI, these innovations are transforming various sectors, enabling cost savings, improved efficiency, and enhanced risk management. With the global financial AI market projected to grow by over 20% annually, the future looks bright for this dynamic industry.
What are the Key Data Covered in this AI Servers In Financial Services Market Research and Growth Report?
-
What is the expected growth of the AI Servers In Financial Services Market between 2025 and 2029?
-
USD 35.19 billion, at a CAGR of 38.5%
-
-
What segmentation does the market report cover?
-
The report is segmented by Component (Hardware, Services, and Software), Deployment (Cloud-based and On-premises), Application (Fraud detection, Risk management, Forecasting and reporting, Credit scoring, and Others), and Geography (North America, Europe, APAC, Middle East and Africa, and South America)
-
-
Which regions are analyzed in the report?
-
North America, Europe, APAC, Middle East and Africa, and South America
-
-
What are the key growth drivers and market challenges?
-
Imperative for advanced fraud detection and proactive cybersecurity, Navigating stringent regulatory frameworks and ethical AI governance
-
-
Who are the major players in the AI Servers In Financial Services Market?
-
Advanced Micro Devices Inc., Amazon Web Services Inc., Atos SE, Cisco Systems Inc., CoreWeave, Dell Technologies Inc., Fujitsu Ltd., Google LLC, Hewlett Packard Enterprise Co., Intel Corp., International Business Machines Corp., Lambda Inc., Lenovo Group Ltd., Microsoft Corp., NEC Corp., NVIDIA Corp., Oracle Corp., Super Micro Computer Inc., and VULTR
-
Market Research Insights
- The market for AI servers in financial services is a continually evolving landscape, with increasing adoption of advanced technologies to enhance credit scoring, portfolio optimization, risk assessment, and loan application processing. For instance, AI algorithms have been shown to improve loan approval rates by up to 20%, enabling financial institutions to expand their customer base and increase revenue. Furthermore, industry analysts anticipate that the AI market in financial services will grow by over 25% annually in the coming years, reflecting the significant potential for innovation and efficiency gains.
- These advancements encompass various applications, including stress testing finance, investment strategies, transaction processing, pattern recognition, compliance monitoring, data security, order management, customer segmentation, anomaly detection, news analytics, robo advisors, backtesting, sentiment analysis, chatbots, financial market prediction, fraud prevention, data visualization, regulatory reporting, financial modeling, and audit trails.
We can help! Our analysts can customize this ai servers in financial services market research report to meet your requirements.
 RIA -
RIA - 
