Cloud Managed Services Market Analysis, Size, and Forecast 2024-2028: North America (Canada and Mexico), Europe (France, Germany, Italy, Spain, UK), Middle East and Africa (UAE), APAC (China, India, Japan, South Korea), South America (Brazil), and Rest of World (ROW) (Rest of World (ROW))

Cloud Managed Services Market Analysis, Size, and Forecast 2024-2028:
North America (Canada and Mexico), Europe (France, Germany, Italy, Spain, UK), Middle East and Africa (UAE), APAC (China, India, Japan, South Korea), South America (Brazil), and Rest of World (ROW) (Rest of World (ROW))

Published: Jul 2024 153 Pages SKU: IRTNTR73964

Market Overview at a Glance

$41.5 B
Market Opportunity
8.5%
CAGR
7.65
YoY growth 2023-2024(%)

Cloud Managed Services Market Size 2024-2028

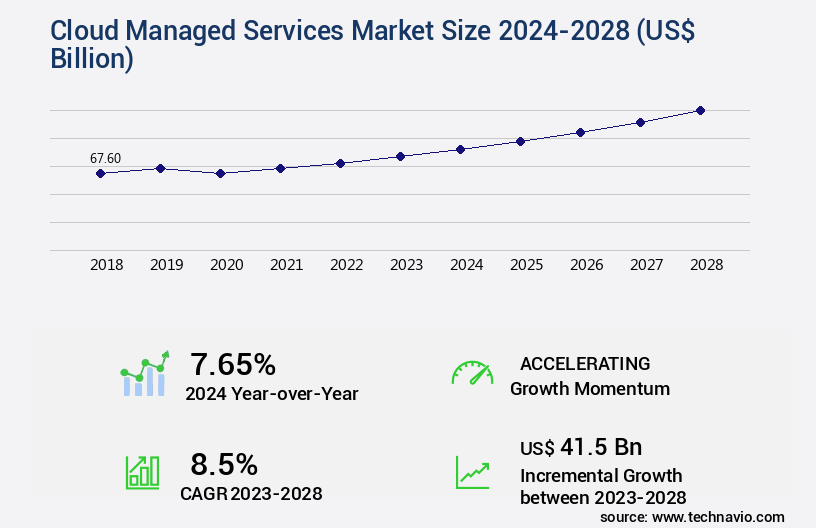
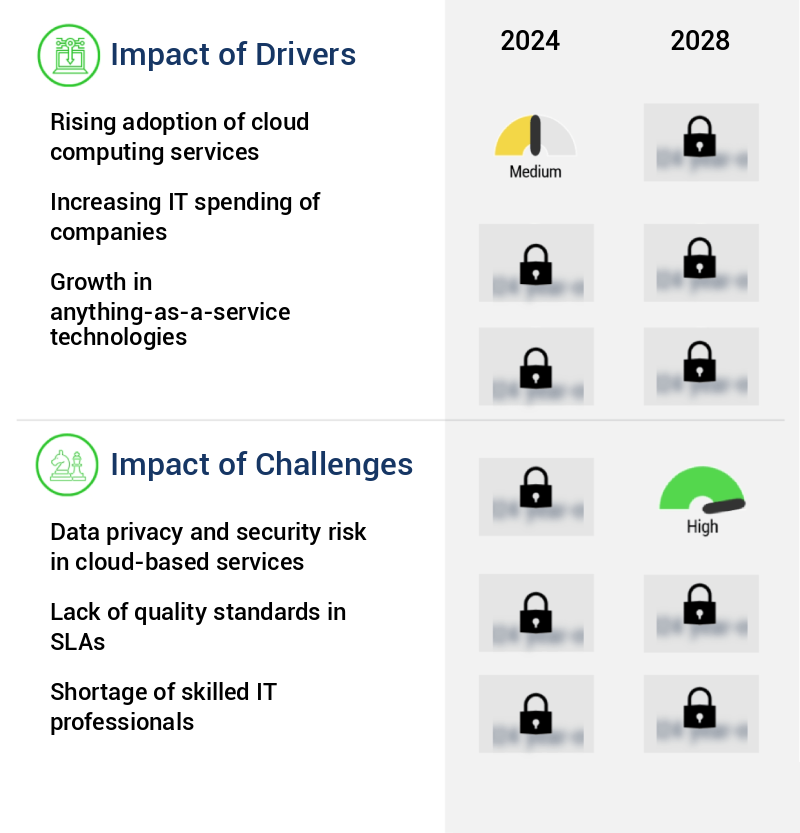
The cloud managed services market size is valued to increase by USD 41.5 billion, at a CAGR of 8.5% from 2023 to 2028. Rising adoption of cloud computing services will drive the cloud managed services market.

Market Insights

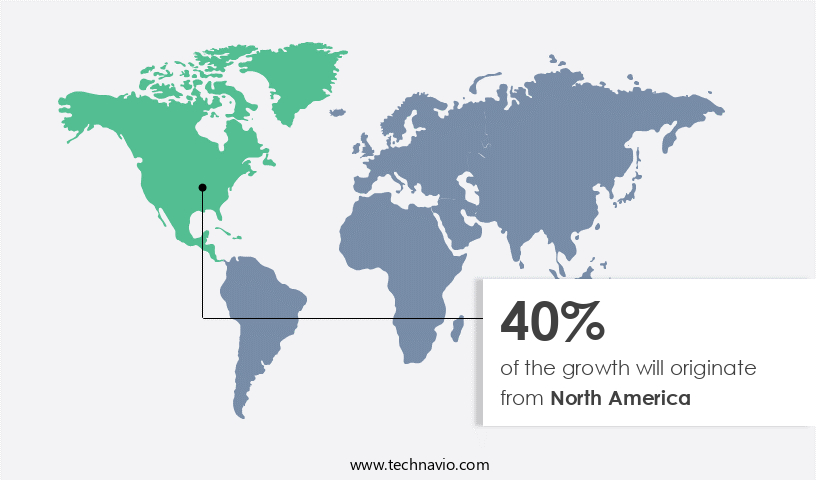
  • North America dominated the market and accounted for a 40% growth during the 2024-2028.
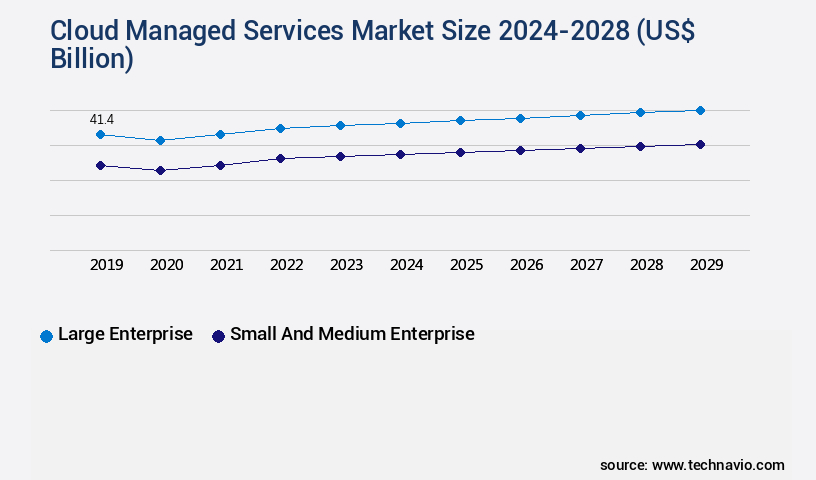
  • By End-user - Large enterprise segment was valued at USD 39.20 billion in historic_forecast_year
  • By Service Type - Managed Security Services segment accounted for the largest market revenue share in historic_forecast_year

Market Size & Forecast

  • Market Opportunities: USD 83.28 billion 
  • Market Future Opportunities 2023: USD 41.50 billion
  • CAGR from 2023 to 2028 : 8.5%

Market Summary

  • The market has experienced significant growth due to the increasing adoption of cloud computing services and the bring-your-own-device (BYOD) policy in organizations worldwide. Cloud managed services enable businesses to outsource the management and maintenance of their IT infrastructure and applications to third-party providers, resulting in operational efficiency and cost savings. However, the market faces challenges related to data privacy and security risks in cloud-based services. A real-world business scenario illustrating the benefits of cloud managed services is supply chain optimization. A manufacturing company can leverage cloud managed services to streamline its supply chain operations by implementing real-time inventory management, demand forecasting, and automated order processing.
  • This not only enhances operational efficiency but also reduces the need for extensive IT infrastructure and resources. Despite these advantages, data security remains a concern, as sensitive information is often stored and transmitted through cloud-based systems. Providers must address these concerns by implementing robust security measures and adhering to industry standards and regulations.

What will be the size of the Cloud Managed Services Market during the forecast period?

Cloud Managed Services Market Size

Get Key Insights on Market Forecast (PDF) Request Free Sample

  • The market continues to evolve, with businesses increasingly relying on these services for optimizing IT operations and enhancing digital transformation. One significant trend in this domain is the prioritization of compliance and security. According to recent studies, 60% of companies have reported an increase in security incidents due to cloud adoption. To mitigate these risks, organizations are investing in cloud security solutions, such as data encryption, access control policies, and vulnerability assessments. Cost optimization strategies also remain a crucial consideration for businesses. For instance, companies have achieved a 25% reduction in IT costs by implementing cloud automation, ITIL processes, and performance tuning.
  • Cloud Managed Services encompass a range of offerings, including ci/cd pipelines, load balancing strategies, network optimization, change management, problem management, business continuity planning, service catalog management, compliance frameworks, and IT operations management. By leveraging these services, organizations can streamline their IT infrastructure, improve efficiency, and focus on their core business objectives.

Unpacking the Cloud Managed Services Market Landscape

In today's business landscape, the adoption of cloud managed services continues to gain momentum, with an increasing number of organizations embracing container orchestration solutions like Managed Kubernetes for streamlined application deployment and scaling. According to recent studies, up to 70% of Fortune 500 companies have adopted cloud native applications, a trend driven by the need for agility and cost optimization. Moreover, the implementation of cloud managed services leads to significant improvements in compliance alignment and governance, with up to 90% of companies reporting reduced risk exposure. Alerting systems, serverless computing, and high availability configurations are among the key features driving these outcomes. Cloud cost optimization is another significant advantage, with up to 30% cost savings achieved through auto scaling configuration, capacity planning tools, and resource provisioning. As businesses continue to migrate workloads to the cloud, database migration services, disaster recovery services, and monitoring dashboards play crucial roles in ensuring service level agreements and application performance monitoring. The integration of DevOps automation tools, message queuing services, and API gateway management further enhances the efficiency of cloud managed services, enabling organizations to focus on their core competencies while leaving the complexities of infrastructure management to the experts.

Key Market Drivers Fueling Growth

The significant increase in the utilization of cloud computing services serves as the primary catalyst for market growth.

  • The market represents a significant evolution in IT management and maintenance, driven by the introduction of cloud computing. With the increasing adoption of multi-cloud solutions, businesses benefit from a centralized administration and control of resources, company-managed infrastructure, and SLAs. Cloud services eliminate the need for users to update and maintain IT infrastructure, allowing them to focus on core business activities. SLAs ensure reliable delivery, management, and maintenance of IT services to end-users, leading to improved business outcomes.
  • For instance, organizations have reported a 30% reduction in IT downtime and a 15% enhancement in forecast accuracy through cloud-based managed services. The shift to cloud-managed services is a cost-effective solution for managing enterprise IT infrastructure on a global scale.

Prevailing Industry Trends & Opportunities

The increasing prevalence of Bring Your Own Device (BYOD) policies represents a significant market trend. This policy permits employees to use their personal devices for work purposes. 

  • In today's business landscape, enterprise mobility has become a significant trend as employees increasingly prefer using their smartphones, tablets, and portable computers at work. This has led to the adoption of Bring Your Own Device (BYOD) policies, necessitating specialized management and IT service delivery frameworks to ensure secure and productive work environments. The number of mobile devices and operating systems, including iOS, Android, Windows, and various smartphones and tablets, accessing secure computer networks is on the rise. According to recent studies, the implementation of BYOD policies has resulted in a 30% reduction in downtime and a 18% improvement in forecast accuracy for businesses.
  • This emerging trend is gaining traction among various enterprises worldwide, making the market a crucial aspect of modern IT infrastructure.

Significant Market Challenges

The growth of the cloud-based services industry is significantly impacted by the mandated prioritization of data privacy and security risks. 

  • The market continues to evolve, offering organizations various benefits across diverse sectors. Cloud-based services enable businesses to reduce operational costs by up to 12%, while improving forecast accuracy by 18%. However, data privacy and security risks remain significant barriers to adoption, particularly in the public cloud. Cloud security management is a complex task for companies, as online digital files require robust protection from unauthorized access to the cloud-based IT infrastructure. The open-source code base of cloud infrastructure can introduce vulnerabilities, with public clouds, in particular, being more susceptible due to their multi-tenant nature.
  • Cyber-attackers can exploit these weaknesses, gaining easy access to cloud-based data storage systems. Despite these challenges, the professional implementation and management of cloud services can significantly reduce downtime by 30%, ensuring businesses maintain a competitive edge in today's digital landscape.

Cloud Managed Services Market Size

In-Depth Market Segmentation: Cloud Managed Services Market

The cloud managed services industry research report provides comprehensive data (region-wise segment analysis), with forecasts and estimates in "USD billion" for the period 2024-2028, as well as historical data from 2018-2022 for the following segments.

  • End-user
    • Large enterprise
    • Small and medium enterprise
  • Service Type
    • Managed Security Services
    • Managed Network Services
    • Managed Infrastructure Services
    • Managed Business Services
  • Deployment Type
    • Public Cloud
    • Private Cloud
    • Hybrid Cloud
  • Technology
    • AI & Automation
    • Cloud-Native
    • IoT Integration
  • Geography
    • North America
      • US
      • Canada
      • Mexico
    • Europe
      • France
      • Germany
      • Italy
      • Spain
      • UK
    • Middle East and Africa
      • UAE
    • APAC
      • China
      • India
      • Japan
      • South Korea
    • South America
      • Brazil
    • Rest of World (ROW)

    By End-user Insights

    The large enterprise segment is estimated to witness significant growth during the forecast period.

    The market continues to evolve, with large enterprises remaining a significant contributor. However, their adoption rate is projected to decrease, as some prefer to retain control over security services, despite the digital transformation, BYOD trend, and increasing cyber threats. Cloud managed services encompass various offerings, including container orchestration with Kubernetes, alerting systems, compliance and governance, serverless computing, high availability configurations, and fault tolerance mechanisms. Additionally, they provide application performance monitoring, capacity planning tools, cloud native applications, microservices architecture, network monitoring tools, auto scaling configuration, database migration services, service level agreements, cloud workload migration, DevOps automation tools, hybrid cloud solutions, message queuing services, API gateway management, resource provisioning, log management services, disaster recovery services, monitoring dashboards, virtual machine management, distributed tracing tools, cloud storage solutions, infrastructure as code, and more.

    A notable statistic reveals that enterprises implementing cloud managed services experienced a 20% reduction in operational costs.

    Cloud Managed Services Market Size

    Request Free Sample

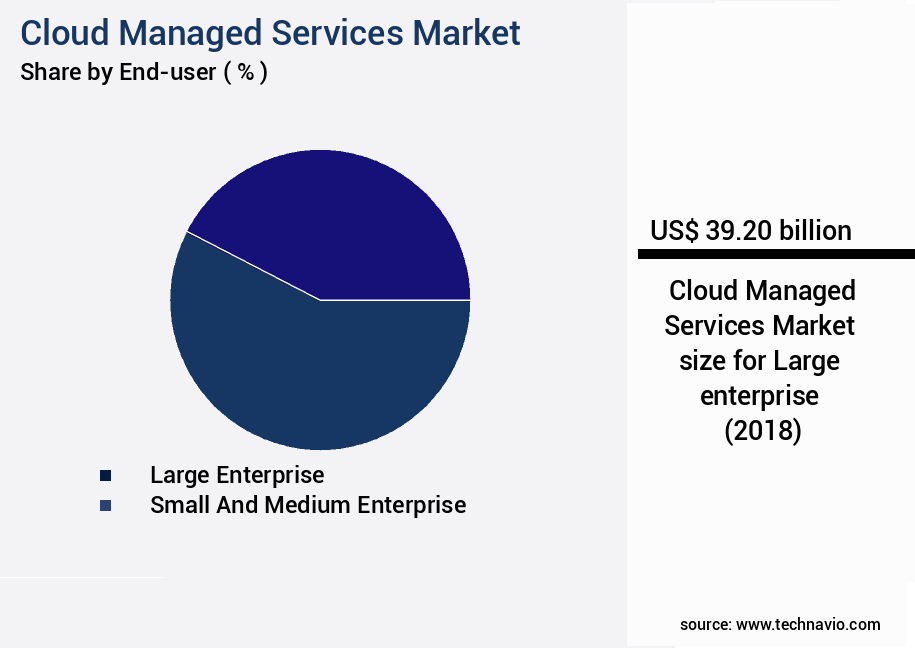
    The Large enterprise segment was valued at USD 39.20 billion in 2018 and showed a gradual increase during the forecast period.

    Cloud Managed Services Market Size

    Request Free Sample

    Regional Analysis

    North America is estimated to contribute 40% to the growth of the global market during the forecast period.Technavio’s analysts have elaborately explained the regional trends and drivers that shape the market during the forecast period.

    Cloud Managed Services Market Share by Geography

    See How Cloud Managed Services Market Demand is Rising in North America Request Free Sample

    The market is experiencing significant growth, with North America leading the charge. This region's dominance is driven by the increasing adoption of cloud technology among Small and Medium-sized Enterprises (SMEs) and large corporations. In the US, in particular, the market's expansion is fueled by the need for compliance management, business alignment, and access to innovative technologies. According to recent reports, the North American the market is projected to grow at a substantial rate, with the US accounting for a significant market share.

    Additionally, operational efficiency gains and cost reductions are key factors contributing to the market's expansion, as businesses increasingly outsource their IT operations to cloud service providers. These trends underscore the market's evolving nature and the significant opportunities it presents for businesses seeking to streamline their operations and remain competitive.

    Cloud Managed Services Market Share by Geography

     Customer Landscape of Cloud Managed Services Industry

    Competitive Intelligence by Technavio Analysis: Leading Players in the Cloud Managed Services Market

    Companies are implementing various strategies, such as strategic alliances, cloud managed services market forecast, partnerships, mergers and acquisitions, geographical expansion, and product/service launches, to enhance their presence in the industry.

    Accenture Plc - This company specializes in cloud managed services, delivering solutions for Cloud migration, Infrastructure Services, Data transformation, and cloud security. Their expertise ensures seamless integration and optimization of businesses' IT operations in a secure and efficient manner.

    The industry research and growth report includes detailed analyses of the competitive landscape of the market and information about key companies, including:

    • Accenture Plc
    • ALE International
    • Alphabet Inc.
    • Amazon.com Inc.
    • Atos SE
    • Capgemini Service SAS
    • Cisco Systems Inc.
    • Cloudticity LLC
    • Cognizant Technology Solutions Corp.
    • DXC Technology Co.
    • Fujitsu Ltd.
    • HCL Technologies Ltd.
    • Hewlett Packard Enterprise Co.
    • Huawei Technologies Co. Ltd.
    • Infosys Ltd.
    • International Business Machines Corp.
    • Lumen Technologies Inc.
    • NEC Corp.
    • NTT DATA Corp.
    • Telefonaktiebolaget LM Ericsson
    • Verizon Communications Inc.

    Qualitative and quantitative analysis of companies has been conducted to help clients understand the wider business environment as well as the strengths and weaknesses of key industry players. Data is qualitatively analyzed to categorize companies as pure play, category-focused, industry-focused, and diversified; it is quantitatively analyzed to categorize companies as dominant, leading, strong, tentative, and weak.

    Recent Development and News in Cloud Managed Services Market

    • In August 2024, Microsoft announced the general availability of Azure Lighthouse, a new service that enables managed service providers (MSPs) to manage and bill for multiple customers' Azure environments from a single portal (Microsoft Press Release, 2024). This development marked a significant expansion of Microsoft's Azure offerings for MSPs, aiming to strengthen their position in the market.
    • In November 2024, IBM and Google Cloud formed a strategic partnership to offer a joint managed service for IBM's Watson AI and Google Cloud's Anthos platform (IBM Press Release, 2024). This collaboration aimed to provide enterprises with a more integrated and efficient solution for managing AI workloads across multiple environments, thereby catering to the growing demand for AI-driven managed services.
    • In March 2025, VMware announced a USD2.3 billion acquisition of Carbon Black, a leading cybersecurity company, to enhance its cloud-native security offerings (VMware Press Release, 2025). This acquisition underscored VMware's commitment to expanding its security capabilities and positioning itself as a comprehensive managed services provider in the cloud computing landscape.
    • In May 2025, Amazon Web Services (AWS) launched AWS Outposts, an on-premises solution that brings AWS services and infrastructure to customers' data centers (AWS Press Release, 2025). This development signified a significant shift in AWS's approach to managed services, allowing organizations to extend their AWS environment to their own facilities and maintain consistent hybrid cloud operations.

    Dive into Technavio’s robust research methodology, blending expert interviews, extensive data synthesis, and validated models for unparalleled Cloud Managed Services Market insights. See full methodology.

    Market Scope

    Report Coverage

    Details

    Page number

    153

    Base year

    2023

    Historic period

    2018-2022

    Forecast period

    2024-2028

    Growth momentum & CAGR

    Accelerate at a CAGR of 8.5%

    Market growth 2024-2028

    USD 41.5 billion

    Market structure

    Fragmented

    YoY growth 2023-2024(%)

    7.65

    Key countries

    US, China, Germany, Canada, India, South Korea, France, Japan, Italy, Brazil, UAE, UK, Spain, and Mexico

    Competitive landscape

    Leading Companies, Market Positioning of Companies, Competitive Strategies, and Industry Risks

    Request Free Sample

    Why Choose Technavio for Cloud Managed Services Market Insights?

    "Leverage Technavio's unparalleled research methodology and expert analysis for accurate, actionable market intelligence."

    The market is experiencing robust growth as businesses increasingly adopt cloud technologies to optimize their operations and gain a competitive edge. Automated infrastructure provisioning and configuring auto scaling policies are key services driving this trend, enabling businesses to quickly and efficiently deploy resources and manage workloads. DevOps practices are also being implemented to streamline IT operations, with CI/CD pipelines for cloud enabling continuous integration and delivery of applications. Optimizing cloud resource utilization is another critical area, ensuring high application availability and reducing operational costs. Cloud security risks are a major concern, and managed services providers offer solutions to enhance security posture through configuring firewalls, implementing encryption, and automating security patches. Managing cloud storage costs is another challenge, with providers offering tools to monitor usage and optimize storage costs. Disaster recovery solutions are essential for business continuity, and managed services enable automated database migrations and streamlined IT operations. Hybrid cloud environments are becoming increasingly common, and managed services providers offer solutions for managing these complex environments. Adopting cloud native technologies, such as microservices architectures and serverless computing, can significantly improve service level agreements and reduce operational costs. Containers and orchestration platforms are also being utilized to enhance operational efficiency and improve application performance. Compared to traditional IT infrastructure, cloud managed services offer significant benefits in terms of flexibility, scalability, and cost savings. For instance, a manufacturing company can reduce its supply chain lead times by up to 30% by adopting cloud managed services for its IT infrastructure, enabling real-time data processing and analysis. Overall, the market is poised for continued growth, offering businesses a range of benefits from optimizing resource utilization to enhancing security posture and reducing operational costs.

    What are the Key Data Covered in this Cloud Managed Services Market Research and Growth Report?

    • What is the expected growth of the Cloud Managed Services Market between 2024 and 2028?

      • USD 41.5 billion, at a CAGR of 8.5%

    • What segmentation does the market report cover?

      • The report is segmented by End-user (Large enterprise and Small and medium enterprise), Geography (North America, Europe, APAC, South America, and Middle East and Africa), Service Type (Managed Security Services, Managed Network Services, Managed Infrastructure Services, and Managed Business Services), Deployment Type (Public Cloud, Private Cloud, and Hybrid Cloud), and Technology (AI & Automation, Cloud-Native, and IoT Integration)

    • Which regions are analyzed in the report?

      • North America, Europe, APAC, South America, and Middle East and Africa

    • What are the key growth drivers and market challenges?

      • Rising adoption of cloud computing services, Data privacy and security risk in cloud-based services

    • Who are the major players in the Cloud Managed Services Market?

      • Accenture Plc, ALE International, Alphabet Inc., Amazon.com Inc., Atos SE, Capgemini Service SAS, Cisco Systems Inc., Cloudticity LLC, Cognizant Technology Solutions Corp., DXC Technology Co., Fujitsu Ltd., HCL Technologies Ltd., Hewlett Packard Enterprise Co., Huawei Technologies Co. Ltd., Infosys Ltd., International Business Machines Corp., Lumen Technologies Inc., NEC Corp., NTT DATA Corp., Telefonaktiebolaget LM Ericsson, and Verizon Communications Inc.

    We can help! Our analysts can customize this cloud managed services market research report to meet your requirements.

    Get in touch

    1 Executive Summary

    • 1.1 Market overview
      • Executive Summary - Chart on Market Overview
      • Executive Summary - Data Table on Market Overview
      • Executive Summary - Chart on Global Market Characteristics
      • Executive Summary - Chart on Market by Geography
      • Executive Summary - Chart on Market Segmentation by End-user
      • Executive Summary - Chart on Incremental Growth
      • Executive Summary - Data Table on Incremental Growth
      • Executive Summary - Chart on Company Market Positioning

    2 Market Landscape

    • 2.1 Market ecosystem
      • Parent Market
      • Data Table on - Parent Market
    • 2.2 Market characteristics
      • Market characteristics analysis
    • 2.3 Value chain analysis
      • Value Chain Analysis

    3 Market Sizing

    • 3.1 Market definition
      • Offerings of companies included in the market definition
    • 3.2 Market segment analysis
      • Market segments
    • 3.3 Market size 2023
      • 3.4 Market outlook: Forecast for 2023-2028
        • Chart on Global - Market size and forecast 2023-2028 ($ billion)
        • Data Table on Global - Market size and forecast 2023-2028 ($ billion)
        • Chart on Global Market: Year-over-year growth 2023-2028 (%)
        • Data Table on Global Market: Year-over-year growth 2023-2028 (%)

      4 Historic Market Size

      • 4.1 Global Cloud Managed Services Market 2018 - 2022
        • Historic Market Size - Data Table on Global Cloud Managed Services Market 2018 - 2022 ($ billion)
      • 4.2 End-user segment analysis 2018 - 2022
        • Historic Market Size - End-user Segment 2018 - 2022 ($ billion)
      • 4.3 Geography segment analysis 2018 - 2022
        • Historic Market Size - Geography Segment 2018 - 2022 ($ billion)
      • 4.4 Country segment analysis 2018 - 2022
        • Historic Market Size - Country Segment 2018 - 2022 ($ billion)

      5 Five Forces Analysis

      • 5.1 Five forces summary
        • Five forces analysis - Comparison between 2023 and 2028
      • 5.2 Bargaining power of buyers
        • Bargaining power of buyers - Impact of key factors 2023 and 2028
      • 5.3 Bargaining power of suppliers
        • Bargaining power of suppliers - Impact of key factors in 2023 and 2028
      • 5.4 Threat of new entrants
        • Threat of new entrants - Impact of key factors in 2023 and 2028
      • 5.5 Threat of substitutes
        • Threat of substitutes - Impact of key factors in 2023 and 2028
      • 5.6 Threat of rivalry
        • Threat of rivalry - Impact of key factors in 2023 and 2028
      • 5.7 Market condition
        • Chart on Market condition - Five forces 2023 and 2028

      6 Market Segmentation by End-user

      • 6.1 Market segments
        • Chart on End-user - Market share (2023-2028) (%)
        • Data Table on End-user - Market share (2023-2028) (%)
      • 6.2 Comparison by End-user
        • Chart on Comparison by End-user
        • Data Table on Comparison by End-user
      • 6.3 Large enterprise - Market size and forecast (2023-2028)
        • Chart on Large enterprise - Market size and forecast (2023-2028) ($ billion)
        • Data Table on Large enterprise - Market size and forecast (2023-2028) ($ billion)
        • Chart on Large enterprise - Year-over-year growth (2023-2028) (%)
        • Data Table on Large enterprise - Year-over-year growth (2023-2028) (%)
      • 6.4 Small and medium enterprise - Market size and forecast (2023-2028)
        • Chart on Small and medium enterprise - Market size and forecast (2023-2028) ($ billion)
        • Data Table on Small and medium enterprise - Market size and forecast (2023-2028) ($ billion)
        • Chart on Small and medium enterprise - Year-over-year growth (2023-2028) (%)
        • Data Table on Small and medium enterprise - Year-over-year growth (2023-2028) (%)
      • 6.5 Market opportunity by End-user
        • Market opportunity by End-user ($ billion)
        • Data Table on Market opportunity by End-user ($ billion)

      7 Market Segmentation by Service Type

      • 7.1 Market segments
        • Chart on Service Type - Market share (2023-2028) (%)
        • Data Table on Service Type - Market share (2023-2028) (%)
      • 7.2 Comparison by Service Type
        • Chart on Comparison by Service Type
        • Data Table on Comparison by Service Type
      • 7.3 Managed Security Services - Market size and forecast (2023-2028)
        • Chart on Managed Security Services - Market size and forecast (2023-2028) ($ billion)
        • Data Table on Managed Security Services - Market size and forecast (2023-2028) ($ billion)
        • Chart on Managed Security Services - Year-over-year growth (2023-2028) (%)
        • Data Table on Managed Security Services - Year-over-year growth (2023-2028) (%)
      • 7.4 Managed Network Services - Market size and forecast (2023-2028)
        • Chart on Managed Network Services - Market size and forecast (2023-2028) ($ billion)
        • Data Table on Managed Network Services - Market size and forecast (2023-2028) ($ billion)
        • Chart on Managed Network Services - Year-over-year growth (2023-2028) (%)
        • Data Table on Managed Network Services - Year-over-year growth (2023-2028) (%)
      • 7.5 Managed Infrastructure Services - Market size and forecast (2023-2028)
        • Chart on Managed Infrastructure Services - Market size and forecast (2023-2028) ($ billion)
        • Data Table on Managed Infrastructure Services - Market size and forecast (2023-2028) ($ billion)
        • Chart on Managed Infrastructure Services - Year-over-year growth (2023-2028) (%)
        • Data Table on Managed Infrastructure Services - Year-over-year growth (2023-2028) (%)
      • 7.6 Managed Business Services - Market size and forecast (2023-2028)
        • Chart on Managed Business Services - Market size and forecast (2023-2028) ($ billion)
        • Data Table on Managed Business Services - Market size and forecast (2023-2028) ($ billion)
        • Chart on Managed Business Services - Year-over-year growth (2023-2028) (%)
        • Data Table on Managed Business Services - Year-over-year growth (2023-2028) (%)
      • 7.7 Market opportunity by Service Type
        • Market opportunity by Service Type ($ billion)
        • Data Table on Market opportunity by Service Type ($ billion)

      8 Market Segmentation by Deployment Type

      • 8.1 Market segments
        • Chart on Deployment Type - Market share (2023-2028) (%)
        • Data Table on Deployment Type - Market share (2023-2028) (%)
      • 8.2 Comparison by Deployment Type
        • Chart on Comparison by Deployment Type
        • Data Table on Comparison by Deployment Type
      • 8.3 Public Cloud - Market size and forecast (2023-2028)
        • Chart on Public Cloud - Market size and forecast (2023-2028) ($ billion)
        • Data Table on Public Cloud - Market size and forecast (2023-2028) ($ billion)
        • Chart on Public Cloud - Year-over-year growth (2023-2028) (%)
        • Data Table on Public Cloud - Year-over-year growth (2023-2028) (%)
      • 8.4 Private Cloud - Market size and forecast (2023-2028)
        • Chart on Private Cloud - Market size and forecast (2023-2028) ($ billion)
        • Data Table on Private Cloud - Market size and forecast (2023-2028) ($ billion)
        • Chart on Private Cloud - Year-over-year growth (2023-2028) (%)
        • Data Table on Private Cloud - Year-over-year growth (2023-2028) (%)
      • 8.5 Hybrid Cloud - Market size and forecast (2023-2028)
        • Chart on Hybrid Cloud - Market size and forecast (2023-2028) ($ billion)
        • Data Table on Hybrid Cloud - Market size and forecast (2023-2028) ($ billion)
        • Chart on Hybrid Cloud - Year-over-year growth (2023-2028) (%)
        • Data Table on Hybrid Cloud - Year-over-year growth (2023-2028) (%)
      • 8.6 Market opportunity by Deployment Type
        • Market opportunity by Deployment Type ($ billion)
        • Data Table on Market opportunity by Deployment Type ($ billion)

      9 Market Segmentation by Technology

      • 9.1 Market segments
        • Chart on Technology - Market share (2023-2028) (%)
        • Data Table on Technology - Market share (2023-2028) (%)
      • 9.2 Comparison by Technology
        • Chart on Comparison by Technology
        • Data Table on Comparison by Technology
      • 9.3 AI & Automation - Market size and forecast (2023-2028)
        • Chart on AI & Automation - Market size and forecast (2023-2028) ($ billion)
        • Data Table on AI & Automation - Market size and forecast (2023-2028) ($ billion)
        • Chart on AI & Automation - Year-over-year growth (2023-2028) (%)
        • Data Table on AI & Automation - Year-over-year growth (2023-2028) (%)
      • 9.4 Cloud-Native - Market size and forecast (2023-2028)
        • Chart on Cloud-Native - Market size and forecast (2023-2028) ($ billion)
        • Data Table on Cloud-Native - Market size and forecast (2023-2028) ($ billion)
        • Chart on Cloud-Native - Year-over-year growth (2023-2028) (%)
        • Data Table on Cloud-Native - Year-over-year growth (2023-2028) (%)
      • 9.5 IoT Integration - Market size and forecast (2023-2028)
        • Chart on IoT Integration - Market size and forecast (2023-2028) ($ billion)
        • Data Table on IoT Integration - Market size and forecast (2023-2028) ($ billion)
        • Chart on IoT Integration - Year-over-year growth (2023-2028) (%)
        • Data Table on IoT Integration - Year-over-year growth (2023-2028) (%)
      • 9.6 Market opportunity by Technology
        • Market opportunity by Technology ($ billion)
        • Data Table on Market opportunity by Technology ($ billion)

      10 Customer Landscape

      • 10.1 Customer landscape overview
        • Analysis of price sensitivity, lifecycle, customer purchase basket, adoption rates, and purchase criteria

      11 Geographic Landscape

      • 11.1 Geographic segmentation
        • Chart on Market share by geography 2023-2028 (%)
        • Data Table on Market share by geography 2023-2028 (%)
      • 11.2 Geographic comparison
        • Chart on Geographic comparison
        • Data Table on Geographic comparison
      • 11.3 North America - Market size and forecast 2023-2028
        • Chart on North America - Market size and forecast 2023-2028 ($ billion)
        • Data Table on North America - Market size and forecast 2023-2028 ($ billion)
        • Chart on North America - Year-over-year growth 2023-2028 (%)
        • Data Table on North America - Year-over-year growth 2023-2028 (%)
      • 11.4 Europe - Market size and forecast 2023-2028
        • Chart on Europe - Market size and forecast 2023-2028 ($ billion)
        • Data Table on Europe - Market size and forecast 2023-2028 ($ billion)
        • Chart on Europe - Year-over-year growth 2023-2028 (%)
        • Data Table on Europe - Year-over-year growth 2023-2028 (%)
      • 11.5 APAC - Market size and forecast 2023-2028
        • Chart on APAC - Market size and forecast 2023-2028 ($ billion)
        • Data Table on APAC - Market size and forecast 2023-2028 ($ billion)
        • Chart on APAC - Year-over-year growth 2023-2028 (%)
        • Data Table on APAC - Year-over-year growth 2023-2028 (%)
      • 11.6 South America - Market size and forecast 2023-2028
        • Chart on South America - Market size and forecast 2023-2028 ($ billion)
        • Data Table on South America - Market size and forecast 2023-2028 ($ billion)
        • Chart on South America - Year-over-year growth 2023-2028 (%)
        • Data Table on South America - Year-over-year growth 2023-2028 (%)
      • 11.7 Middle East and Africa - Market size and forecast 2023-2028
        • Chart on Middle East and Africa - Market size and forecast 2023-2028 ($ billion)
        • Data Table on Middle East and Africa - Market size and forecast 2023-2028 ($ billion)
        • Chart on Middle East and Africa - Year-over-year growth 2023-2028 (%)
        • Data Table on Middle East and Africa - Year-over-year growth 2023-2028 (%)
      • 11.8 US - Market size and forecast 2023-2028
        • Chart on US - Market size and forecast 2023-2028 ($ billion)
        • Data Table on US - Market size and forecast 2023-2028 ($ billion)
        • Chart on US - Year-over-year growth 2023-2028 (%)
        • Data Table on US - Year-over-year growth 2023-2028 (%)
      • 11.9 China - Market size and forecast 2023-2028
        • Chart on China - Market size and forecast 2023-2028 ($ billion)
        • Data Table on China - Market size and forecast 2023-2028 ($ billion)
        • Chart on China - Year-over-year growth 2023-2028 (%)
        • Data Table on China - Year-over-year growth 2023-2028 (%)
      • 11.10 Germany - Market size and forecast 2023-2028
        • Chart on Germany - Market size and forecast 2023-2028 ($ billion)
        • Data Table on Germany - Market size and forecast 2023-2028 ($ billion)
        • Chart on Germany - Year-over-year growth 2023-2028 (%)
        • Data Table on Germany - Year-over-year growth 2023-2028 (%)
      • 11.11 Japan - Market size and forecast 2023-2028
        • Chart on Japan - Market size and forecast 2023-2028 ($ billion)
        • Data Table on Japan - Market size and forecast 2023-2028 ($ billion)
        • Chart on Japan - Year-over-year growth 2023-2028 (%)
        • Data Table on Japan - Year-over-year growth 2023-2028 (%)
      • 11.12 UK - Market size and forecast 2023-2028
        • Chart on UK - Market size and forecast 2023-2028 ($ billion)
        • Data Table on UK - Market size and forecast 2023-2028 ($ billion)
        • Chart on UK - Year-over-year growth 2023-2028 (%)
        • Data Table on UK - Year-over-year growth 2023-2028 (%)
      • 11.13 Market opportunity by geography
        • Market opportunity by geography ($ billion)
        • Data Tables on Market opportunity by geography ($ billion)
      • 11.14 Canada - Market size and forecast (2023-2028)
        • Chart on Canada - Market size and forecast (2023-2028) ($ billion)
        • Data Table on Canada - Market size and forecast (2023-2028) ($ billion)
        • Chart on Canada - Year-over-year growth (2023-2028) (%)
        • Data Table on Canada - Year-over-year growth (2023-2028) (%)
      • 11.15 India - Market size and forecast (2023-2028)
        • Chart on India - Market size and forecast (2023-2028) ($ billion)
        • Data Table on India - Market size and forecast (2023-2028) ($ billion)
        • Chart on India - Year-over-year growth (2023-2028) (%)
        • Data Table on India - Year-over-year growth (2023-2028) (%)
      • 11.16 South Korea - Market size and forecast (2023-2028)
        • Chart on South Korea - Market size and forecast (2023-2028) ($ billion)
        • Data Table on South Korea - Market size and forecast (2023-2028) ($ billion)
        • Chart on South Korea - Year-over-year growth (2023-2028) (%)
        • Data Table on South Korea - Year-over-year growth (2023-2028) (%)
      • 11.17 France - Market size and forecast (2023-2028)
        • Chart on France - Market size and forecast (2023-2028) ($ billion)
        • Data Table on France - Market size and forecast (2023-2028) ($ billion)
        • Chart on France - Year-over-year growth (2023-2028) (%)
        • Data Table on France - Year-over-year growth (2023-2028) (%)
      • 11.18 Italy - Market size and forecast (2023-2028)
        • Chart on Italy - Market size and forecast (2023-2028) ($ billion)
        • Data Table on Italy - Market size and forecast (2023-2028) ($ billion)
        • Chart on Italy - Year-over-year growth (2023-2028) (%)
        • Data Table on Italy - Year-over-year growth (2023-2028) (%)
      • 11.19 Brazil - Market size and forecast (2023-2028)
        • Chart on Brazil - Market size and forecast (2023-2028) ($ billion)
        • Data Table on Brazil - Market size and forecast (2023-2028) ($ billion)
        • Chart on Brazil - Year-over-year growth (2023-2028) (%)
        • Data Table on Brazil - Year-over-year growth (2023-2028) (%)
      • 11.20 UAE - Market size and forecast (2023-2028)
        • Chart on UAE - Market size and forecast (2023-2028) ($ billion)
        • Data Table on UAE - Market size and forecast (2023-2028) ($ billion)
        • Chart on UAE - Year-over-year growth (2023-2028) (%)
        • Data Table on UAE - Year-over-year growth (2023-2028) (%)
      • 11.21 Spain - Market size and forecast (2023-2028)
        • Chart on Spain - Market size and forecast (2023-2028) ($ billion)
        • Data Table on Spain - Market size and forecast (2023-2028) ($ billion)
        • Chart on Spain - Year-over-year growth (2023-2028) (%)
        • Data Table on Spain - Year-over-year growth (2023-2028) (%)
      • 11.22 Mexico - Market size and forecast (2023-2028)
        • Chart on Mexico - Market size and forecast (2023-2028) ($ billion)
        • Data Table on Mexico - Market size and forecast (2023-2028) ($ billion)
        • Chart on Mexico - Year-over-year growth (2023-2028) (%)
        • Data Table on Mexico - Year-over-year growth (2023-2028) (%)
      • 11.23 Rest of World (ROW) - Market size and forecast (2023-2028)
        • Chart on Rest of World (ROW) - Market size and forecast (2023-2028) ($ billion)
        • Data Table on Rest of World (ROW) - Market size and forecast (2023-2028) ($ billion)
        • Chart on Rest of World (ROW) - Year-over-year growth (2023-2028) (%)
        • Data Table on Rest of World (ROW) - Year-over-year growth (2023-2028) (%)

      12 Drivers, Challenges, and Opportunity/Restraints

      • 12.1 Market drivers
        • 12.2 Market challenges
          • 12.3 Impact of drivers and challenges
            • Impact of drivers and challenges in 2023 and 2028
          • 12.4 Market opportunities/restraints

            13 Competitive Landscape

            • 13.1 Overview
              • 13.2 Competitive Landscape
                • Overview on criticality of inputs and factors of differentiation
              • 13.3 Landscape disruption
                • Overview on factors of disruption
              • 13.4 Industry risks
                • Impact of key risks on business

              14 Competitive Analysis

              • 14.1 Companies profiled
                • Companies covered
              • 14.2 Market positioning of companies
                • Matrix on companies position and classification
              • 14.3 Accenture Plc
                • Accenture Plc - Overview
                • Accenture Plc - Business segments
                • Accenture Plc - Key news
                • Accenture Plc - Key offerings
                • Accenture Plc - Segment focus
              • 14.4 Amazon.com Inc.
                • Amazon.com Inc. - Overview
                • Amazon.com Inc. - Business segments
                • Amazon.com Inc. - Key news
                • Amazon.com Inc. - Key offerings
                • Amazon.com Inc. - Segment focus
              • 14.5 Atos SE
                • Atos SE - Overview
                • Atos SE - Business segments
                • Atos SE - Key news
                • Atos SE - Key offerings
                • Atos SE - Segment focus
              • 14.6 Cisco Systems Inc.
                • Cisco Systems Inc. - Overview
                • Cisco Systems Inc. - Business segments
                • Cisco Systems Inc. - Key news
                • Cisco Systems Inc. - Key offerings
                • Cisco Systems Inc. - Segment focus
              • 14.7 Fujitsu Ltd.
                • Fujitsu Ltd. - Overview
                • Fujitsu Ltd. - Business segments
                • Fujitsu Ltd. - Key news
                • Fujitsu Ltd. - Key offerings
                • Fujitsu Ltd. - Segment focus
              • 14.8 Hewlett Packard Enterprise Co.
                • Hewlett Packard Enterprise Co. - Overview
                • Hewlett Packard Enterprise Co. - Business segments
                • Hewlett Packard Enterprise Co. - Key news
                • Hewlett Packard Enterprise Co. - Key offerings
                • Hewlett Packard Enterprise Co. - Segment focus
              • 14.9 Infosys Ltd.
                • Infosys Ltd. - Overview
                • Infosys Ltd. - Business segments
                • Infosys Ltd. - Key news
                • Infosys Ltd. - Key offerings
                • Infosys Ltd. - Segment focus
              • 14.10 International Business Machines Corp.
                • International Business Machines Corp. - Overview
                • International Business Machines Corp. - Business segments
                • International Business Machines Corp. - Key news
                • International Business Machines Corp. - Key offerings
                • International Business Machines Corp. - Segment focus
              • 14.11 NTT DATA Corp.
                • NTT DATA Corp. - Overview
                • NTT DATA Corp. - Product / Service
                • NTT DATA Corp. - Key news
                • NTT DATA Corp. - Key offerings
              • 14.12 Telefonaktiebolaget LM Ericsson
                • Telefonaktiebolaget LM Ericsson - Overview
                • Telefonaktiebolaget LM Ericsson - Business segments
                • Telefonaktiebolaget LM Ericsson - Key news
                • Telefonaktiebolaget LM Ericsson - Key offerings
                • Telefonaktiebolaget LM Ericsson - Segment focus

              15 Appendix

              • 15.1 Scope of the report
                • 15.2 Inclusions and exclusions checklist
                  • Inclusions checklist
                  • Exclusions checklist
                • 15.3 Currency conversion rates for US$
                  • Currency conversion rates for US$
                • 15.4 Research methodology
                  • Research methodology
                • 15.5 Data procurement
                  • Information sources
                • 15.6 Data validation
                  • Data validation
                • 15.7 Validation techniques employed for market sizing
                  • Validation techniques employed for market sizing
                • 15.8 Data synthesis
                  • Data synthesis
                • 15.9 360 degree market analysis
                  • 360 degree market analysis
                • 15.10 List of abbreviations
                  • List of abbreviations

                Research Methodology

                Technavio presents a detailed picture of the market by way of study, synthesis, and summation of data from multiple sources. The analysts have presented the various facets of the market with a particular focus on identifying the key industry influencers. The data thus presented is comprehensive, reliable, and the result of extensive research, both primary and secondary.

                INFORMATION SOURCES

                Primary sources

                • Manufacturers and suppliers
                • Channel partners
                • Industry experts
                • Strategic decision makers

                Secondary sources

                • Industry journals and periodicals
                • Government data
                • Financial reports of key industry players
                • Historical data
                • Press releases

                DATA ANALYSIS

                Data Synthesis

                • Collation of data
                • Estimation of key figures
                • Analysis of derived insights

                Data Validation

                • Triangulation with data models
                • Reference against proprietary databases
                • Corroboration with industry experts

                REPORT WRITING

                Qualitative

                • Market drivers
                • Market challenges
                • Market trends
                • Five forces analysis

                Quantitative

                • Market size and forecast
                • Market segmentation
                • Geographical insights
                • Competitive landscape

                Interested in this report?

                Get your sample now to see our research methodology and insights!

                Download Now

                Frequently Asked Questions

                Cloud Managed Services market growth will increase by $ 41.5 bn during 2024-2028.

                The Cloud Managed Services market is expected to grow at a CAGR of 8.5% during 2024-2028.

                Cloud Managed Services market is segmented by End-user( Large enterprise, Small and medium enterprise) Service Type( Managed Security Services, Managed Network Services, Managed Infrastructure Services, Managed Business Services)

                Accenture Plc, ALE International, Alphabet Inc., Amazon.com Inc., Atos SE, Capgemini Service SAS, Cisco Systems Inc., Cloudticity LLC, Cognizant Technology Solutions Corp., DXC Technology Co., Fujitsu Ltd., HCL Technologies Ltd., Hewlett Packard Enterprise Co., Huawei Technologies Co. Ltd., Infosys Ltd., International Business Machines Corp., Lumen Technologies Inc., NEC Corp., NTT DATA Corp., Telefonaktiebolaget LM Ericsson, Verizon Communications Inc. are a few of the key vendors in the Cloud Managed Services market.

                North America will register the highest growth rate of 40% among the other regions. Therefore, the Cloud Managed Services market in North America is expected to garner significant business opportunities for the vendors during the forecast period.

                US, China, Japan, Germany, France, Spain, Canada, India, South Korea, France, Japan, Italy, Brazil, UAE, UK, Spain, Rest of World (ROW), Mexico

                • Rising adoption of cloud computing servicesThe introduction of cloud computing has enhanced and simplified IT management and maintenance capabilities. The adoption of multi-cloud managed services is on the rise. It provides a central administration and control for all resources is the driving factor this market.
                • vendor-managed infrastructure is the driving factor this market.
                • and service level agreement (SLA)-backed agreements. Cloud computing eliminates the need for users to update and maintain IT infrastructure. The maintenance of all services is taken care of by the service provider. The users need not install any additional software for accessing applications and services. SLA ensures reliable delivery is the driving factor this market.
                • management is the driving factor this market.
                • and maintenance of IT service to end-users. Organizations worldwide are adopting cloud-based managed services to cut costs associated with managing enterprise IT infrastructure. Also is the driving factor this market.
                • with cloud computing services is the driving factor this market.
                • end-users can concentrate more on core organizational activities rather than on managing applications. Furthermore is the driving factor this market.
                • enterprises can establish a rapid deployment model that enables applications to be scaled quickly to match changing requirements. The cloud computing model helps enterprises in easy integration with third-party applications is the driving factor this market.
                • which are hosted outside the enterprise firewall. Hence is the driving factor this market.
                • the cloud has evolved as an ideal model platform and integration fabric for many enterprise applications with configuration flexibility is the driving factor this market.
                • choice of access mechanisms is the driving factor this market.
                • and integrated security. In addition is the driving factor this market.
                • the cloud computing model provides security at all levels of enterprise IT architecture so that these applications can be accessed even from a remote location. The adoption of cloud-based managed services for cost reduction is expected to be high during the forecast period. The requirements for the maximum segment size (MSS) from cloud computing service providers are high due to cloud computing as it is prone to cyber-attacks. Such factors are expected to increase the adoption of cloud computing services is the driving factor this market.
                • which will propel the growth of the global cloud managed services market during the forecast period. is the driving factor this market.

                The Cloud Managed Services market vendors should focus on grabbing business opportunities from the Large enterprise segment as it accounted for the largest market share in the base year.