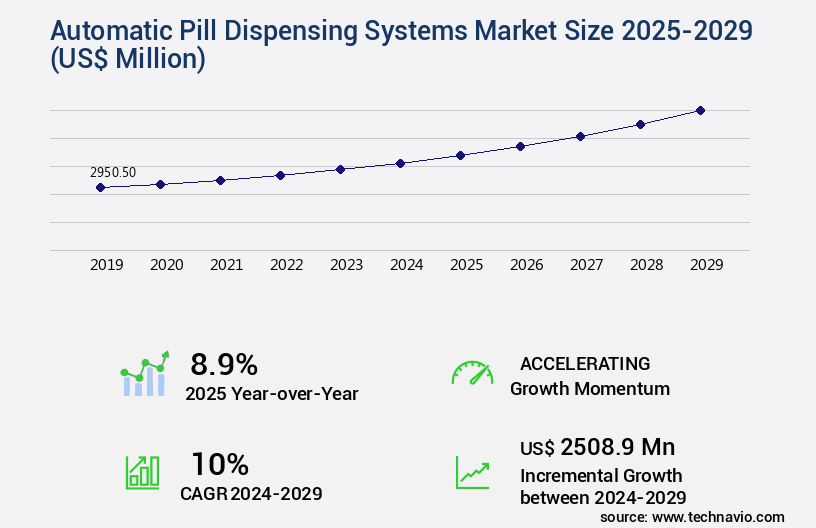
Automatic Pill Dispensing Systems Market Size 2025-2029
The automatic pill dispensing systems market size is valued to increase USD 2.51 billion, at a CAGR of 10% from 2024 to 2029. Growing aging population will drive the automatic pill dispensing systems market.
Major Market Trends & Insights
- North America dominated the market and accounted for a 64% growth during the forecast period.
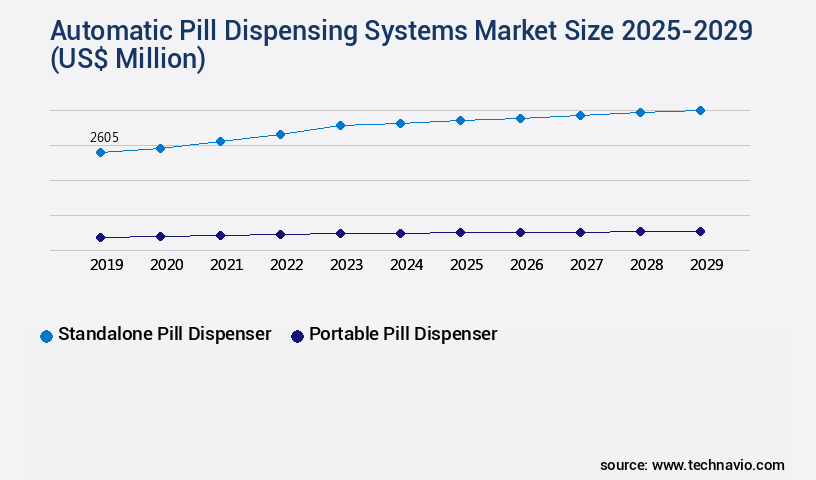
- By Type - Standalone pill dispenser segment was valued at USD 2.61 billion in 2023
- By Application - Hospital pharmacies segment accounted for the largest market revenue share in 2023
Market Size & Forecast
- Market Opportunities: USD 124.00 million
- Market Future Opportunities: USD 2508.90 million
- CAGR : 10%
- North America: Largest market in 2023
Market Summary
- The market represents a significant segment of the healthcare automation industry, driven by the growing aging population and increasing adoption of automation in healthcare. The market is projected to grow at a steady rate, with core technologies such as RFID and barcode scanning playing a crucial role. The service types or product categories include standalone systems, integrated systems, and robotic systems, each offering unique advantages in terms of accuracy, efficiency, and patient safety. Regulations, such as the FDA's 21st Century Cures Act, continue to shape the market, ensuring the safety and effectiveness of these systems.
- Despite the high cost of pharmacy automation systems, the benefits, including reduced medication errors and improved patient outcomes, make them a valuable investment for healthcare providers.
What will be the Size of the Automatic Pill Dispensing Systems Market during the forecast period?
Get Key Insights on Market Forecast (PDF) Request Free Sample
How is the Automatic Pill Dispensing Systems Market Segmented and what are the key trends of market segmentation?
The automatic pill dispensing systems industry research report provides comprehensive data (region-wise segment analysis), with forecasts and estimates in "USD million" for the period 2025-2029, as well as historical data from 2019-2023 for the following segments.
- Type
- Standalone pill dispenser
- Portable pill dispenser
- Application
- Hospital pharmacies
- Retail pharmacies
- Home healthcare
- Indication
- Physical disability
- Neurodegenerative disorders and dementia
- Others
- Geography
- North America
- US
- Canada
- Mexico
- Europe
- France
- Germany
- Italy
- The Netherlands
- UK
- APAC
- China
- Japan
- Rest of World (ROW)
- North America
By Type Insights
The standalone pill dispenser segment is estimated to witness significant growth during the forecast period.
In the dynamic healthcare technology landscape, automatic pill dispensing systems have emerged as a crucial solution for medication adherence and safety. According to recent studies, the market for these systems is experiencing significant growth, with the standalone pill dispenser segment holding a substantial market share. In 2024, this segment accounted for approximately 55% of the global market. Key applications of automatic pill dispensing systems are found in hospitals, pharmacies, and clinics. These systems offer enhanced security features, inventory management, and medication scheduling capabilities. By automating the pill dispensing process, healthcare professionals can dedicate more time to patient care and monitoring.
The adoption of these systems has seen a steady increase, with an estimated 30% of hospitals and pharmacies implementing automatic pill dispensing systems in 2025. Moreover, the integration of data analytics platforms and real-time monitoring capabilities enables better medication adherence, real-time medication administration, and remote medication monitoring. The future growth prospects for the market are promising, with an anticipated 35% of hospitals and pharmacies expected to adopt these systems by 2028. This growth can be attributed to factors such as the integration of prescription drug management, patient portal integration, and time-release medication capabilities. Additionally, the integration of compliance tracking systems, alert systems, and electronic pill dispensers in pharmacy automation and telemedicine further enhances the market's potential.
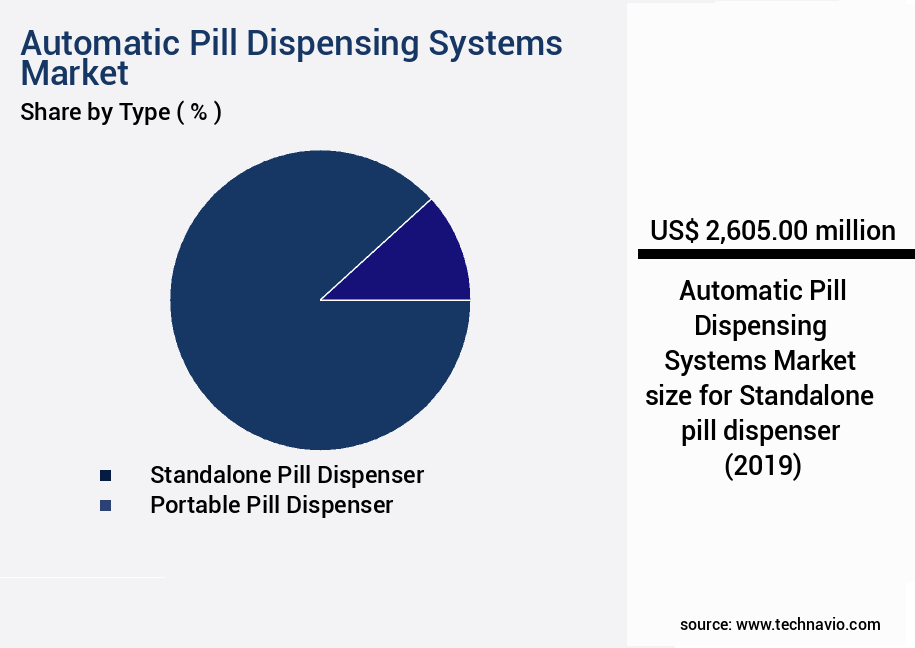
The Standalone pill dispenser segment was valued at USD 2.61 billion in 2019 and showed a gradual increase during the forecast period.
The ongoing integration of wireless communication and system integration capabilities ensures seamless data exchange and improved medication safety. The market is poised for continuous evolution, with a focus on improving medication adherence, reducing medication errors, and enhancing overall patient care.
Regional Analysis
North America is estimated to contribute 64% to the growth of the global market during the forecast period. Technavio's analysts have elaborately explained the regional trends and drivers that shape the market during the forecast period.

See How Automatic Pill Dispensing Systems Market Demand is Rising in North America Request Free Sample
In the market, North America emerged as the leading revenue generator in 2024. The region's dominance is primarily driven by the US, Canada, and Mexico. The US, with its advanced healthcare infrastructure, is home to a substantial number of hospitals and retail pharmacies. These entities increasingly adopt automatic pill dispensing systems to streamline operations, minimize medication errors, and manage the high volume of orders.
The home healthcare sector in the US also contributes significantly to the market's growth. Moreover, the aging population in the region is another key factor fueling the demand for these systems. Canada and Mexico, while smaller markets, also exhibit promising growth due to similar factors.
Market Dynamics
Our researchers analyzed the data with 2024 as the base year, along with the key drivers, trends, and challenges. A holistic analysis of drivers will help companies refine their marketing strategies to gain a competitive advantage.
The market is witnessing significant growth as healthcare providers and patients increasingly recognize the importance of improving medication adherence using technology. These systems, featuring automated cabinets and smart dispensers, offer numerous advantages, including remote monitoring of medication compliance, integration with electronic health records (EHR), and medication safety features. Automated pill dispensing systems have been designed with user-friendly interfaces to enhance medication management and patient experience. These systems enable reliable and secure dispensing, reducing the risk of medication errors and improving patient outcomes. Data analytics for medication compliance is another key benefit, providing valuable insights into patients' intake patterns and enabling healthcare professionals to intervene when necessary.
The integration of medication management systems into pharmacy workflows has been instrumental in enhancing healthcare efficiency. More than 70% of new product developments in this market focus on designing patient-centric solutions, ensuring secure data storage and transmission, and reducing medication waste through efficient dispensing. The impact of medication adherence on patient outcomes is substantial. A study reveals that up to 50% of patients do not take their medications as prescribed. Automated pill dispensing systems address this challenge by providing real-time monitoring of medication intake patterns and improving the medication reconciliation process. Comparatively, the adoption rates of automated pill dispensing systems in long-term care facilities are significantly higher than in home healthcare settings.
In long-term care facilities, these systems account for over 80% of medication administration, ensuring consistent and accurate dosing. In conclusion, the market is poised for continued growth as technology plays an increasingly important role in medication management. These systems offer numerous advantages, from improving medication adherence and patient outcomes to enhancing healthcare efficiency and reducing medication errors.
What are the key market drivers leading to the rise in the adoption of Automatic Pill Dispensing Systems Industry?
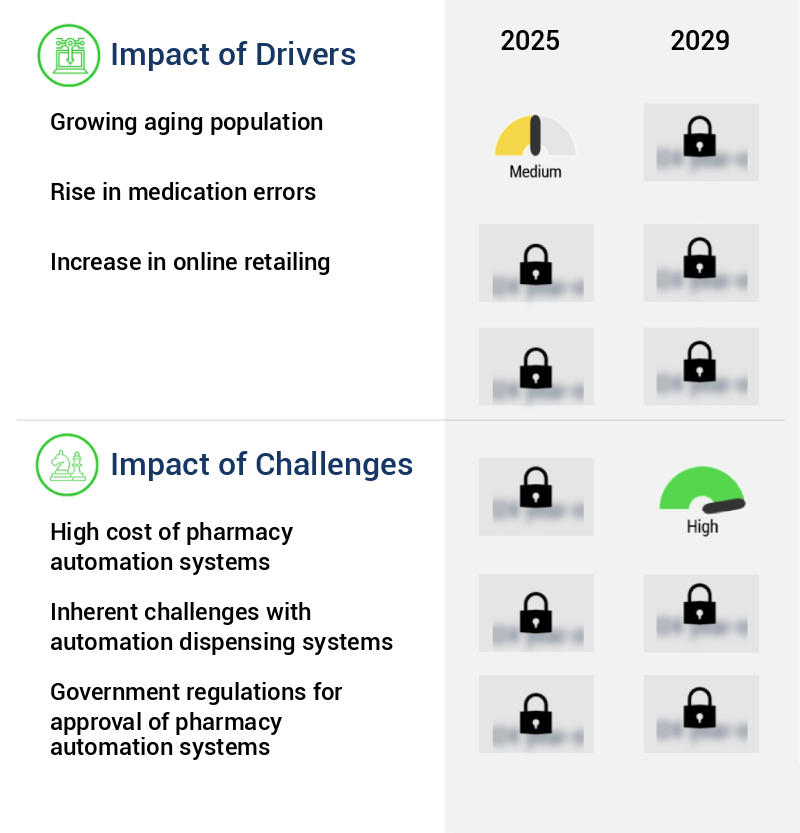
- The aging population represents the primary catalyst for market growth, as this demographic cohort continues to expand and demand increased products and services.
- The global aging population is on the rise, with countries such as Japan, the UK, the US, and Germany having significant numbers of elderly residents. In 2023, approximately 10.8% of Alzheimer disease patients in the US were aged 65 and above. Elderly individuals often grapple with multiple health issues, including Alzheimer disease, osteoarthritis, cancer, chronic obstructive pulmonary disease, and diabetes mellitus. Consequently, they require numerous medications, leading to intricate medication schedules.
- Managing these complex regimens can result in errors, such as missed doses, incorrect amounts, or incorrect timing, which can lead to hospitalizations, worsening health conditions, and, in extreme cases, fatalities. This highlights the necessity for effective medication management solutions tailored to the elderly population.
What are the market trends shaping the Automatic Pill Dispensing Systems Industry?
- The increasing adoption of automation is a notable trend in the healthcare market. Automation's implementation in healthcare is becoming more prevalent.
- In the healthcare sector, automation is gaining traction as a solution for cost savings and productivity enhancements. Fully automated pharmacy systems can replace labor-intensive tasks, enabling healthcare professionals to focus on patient consultation and diagnosis. These systems not only save time but also reduce human error, contributing to improved pharmacy productivity. Furthermore, the data generated by automated processes can be harnessed for performance optimization and throughput increase.
- With each iteration, automated systems collect and analyze data to refine their processes, thereby reducing the workload on healthcare personnel. This data-driven approach allows for continuous process improvement, making automation an essential tool in the evolving healthcare landscape.
What challenges does the Automatic Pill Dispensing Systems Industry face during its growth?
- The escalating costs of implementing pharmacy automation systems pose a significant challenge to the industry's growth trajectory.
- Pharmacy automation products, including automatic pill dispensing systems, continue to gain traction in various sectors due to their efficiency and accuracy benefits. The pricing structure for these products varies, with some companies offering outright sales at retail prices, ranging from USD 500 to USD 1,000. However, these systems may encounter issues such as system failure, necessitating regular monthly servicing. In contrast, other companies provide lower upfront costs, around USD 300 to USD 500, with additional monthly service fees of approximately USD 15 to USD 25.
- This pricing model caters to budget-conscious clients while ensuring ongoing system maintenance. The evolving pharmacy automation market reflects a dynamic balance between upfront costs and long-term service requirements.
Exclusive Technavio Analysis on Customer Landscape
The automatic pill dispensing systems market forecasting report includes the adoption lifecycle of the market, covering from the innovator's stage to the laggard's stage. It focuses on adoption rates in different regions based on penetration. Furthermore, the automatic pill dispensing systems market report also includes key purchase criteria and drivers of price sensitivity to help companies evaluate and develop their market growth analysis strategies.

Customer Landscape of Automatic Pill Dispensing Systems Industry
Competitive Landscape
Companies are implementing various strategies, such as strategic alliances, automatic pill dispensing systems market forecast, partnerships, mergers and acquisitions, geographical expansion, and product/service launches, to enhance their presence in the industry.
Accu Chart Plus Health Care Systems - This company provides an advanced automatic pill dispensing system, featuring individual drawers and secure internet access for remote management.
The industry research and growth report includes detailed analyses of the competitive landscape of the market and information about key companies, including:
- Accu Chart Plus Health Care Systems
- ARxIUM Inc.
- Becton Dickinson and Co.
- Capsa Healthcare LLC
- Hero Health Inc.
- Innovation Associates
- JVM Co. Ltd.
- Koninklijke Philips NV
- McKesson Corp.
- Medminder Systems Inc.
- MedReady Inc
- MIDEA Group Co. Ltd.
- NewIcon Oy
- Omnicell Inc.
- Oracle Corp.
- PharmAdva LLC
- PharmRight Corp.
- PHARMRX PTY LTD
- ScriptPro LLC
- YUYAMA Co. Ltd.
Qualitative and quantitative analysis of companies has been conducted to help clients understand the wider business environment as well as the strengths and weaknesses of key industry players. Data is qualitatively analyzed to categorize companies as pure play, category-focused, industry-focused, and diversified; it is quantitatively analyzed to categorize companies as dominant, leading, strong, tentative, and weak.
Recent Development and News in Automatic Pill Dispensing Systems Market
- In January 2024, Medtronic plc, a leading medical technology, services, and solutions company, announced the FDA approval of its new Bluetooth-enabled MiniMedTM 780G system, which includes an automatic insulin pump and an integrated continuous glucose monitor, expanding the application of automatic pill dispensing systems beyond traditional medication management (Medtronic Press Release, 2024).
- In March 2024, Merck KGaA, a global pharmaceutical and life sciences company, partnered with Adheretech, a digital health company specializing in medication adherence solutions, to integrate Adheretech's automatic pill dispensing technology with Merck's chronic disease management portfolio (Merck KGaA Press Release, 2024).
- In April 2025, Teva Pharmaceuticals Industries Ltd., a global leader in generic and specialty medicines, completed the acquisition of Medco Health Solutions, a pharmacy benefit management company, gaining access to Medco's automated medication dispensing and delivery services, enhancing Teva's capabilities in the pharmaceutical services sector (Teva Pharmaceuticals Industries Ltd. SEC Filing, 2025).
- In May 2025, Mylan N.V., a leading global pharmaceutical company, received FDA approval for its EpiPen 2-Pak Auto-Injector, which includes an automatic dispensing feature, addressing the critical need for easy-to-use epinephrine auto-injectors for emergency allergy treatment (Mylan N.V. Press Release, 2025).
Dive into Technavio's robust research methodology, blending expert interviews, extensive data synthesis, and validated models for unparalleled Automatic Pill Dispensing Systems Market insights. See full methodology.
|
Market Scope |
|
|
Report Coverage |
Details |
|
Page number |
217 |
|
Base year |
2024 |
|
Historic period |
2019-2023 |
|
Forecast period |
2025-2029 |
|
Growth momentum & CAGR |
Accelerate at a CAGR of 10% |
|
Market growth 2025-2029 |
USD 2508.9 million |
|
Market structure |
Fragmented |
|
YoY growth 2024-2025(%) |
8.9 |
|
Key countries |
US, Canada, UK, Germany, China, Italy, Japan, France, The Netherlands, and Mexico |
|
Competitive landscape |
Leading Companies, Market Positioning of Companies, Competitive Strategies, and Industry Risks |
Research Analyst Overview
- The market is a dynamic and evolving segment of healthcare technology, focused on enhancing medication management and safety for patients. These systems integrate data analytics platforms, medication schedules, and inventory management systems to streamline drug delivery and improve medication adherence. Security features are a crucial aspect of these systems, ensuring the confidentiality and integrity of patient data. Real-time monitoring, audit trails, and data logging capabilities enable healthcare providers to track medication administration and reconcile prescriptions effectively. Automated pill counting and medication reminder systems reduce the risk of medication errors, while time-release medication and compliance monitoring promote better patient outcomes.
- Remote medication monitoring and real-time alerts enable healthcare professionals to intervene promptly in case of non-adherence or potential issues. The market is characterized by continuous innovation, with smart pill bottles, user interface designs, and medication administration systems that cater to diverse patient needs. Wireless communication, system integration, and telemedicine integration further expand the capabilities of these systems, enhancing medication safety and efficiency. Automatic pill dispensing units and dosage management systems are integral components of pharmacy automation, improving medication adherence and reducing the burden on healthcare staff. Prescription drug management and patient portal integration streamline workflows and improve overall care coordination.
- Compliance rates are a key performance indicator in this market, reflecting the effectiveness of these systems in promoting medication adherence and reducing medication errors. The market's growth is driven by the increasing demand for advanced medication management solutions and the ongoing integration of technology into healthcare services.
What are the Key Data Covered in this Automatic Pill Dispensing Systems Market Research and Growth Report?
-
What is the expected growth of the Automatic Pill Dispensing Systems Market between 2025 and 2029?
-
USD 2.51 billion, at a CAGR of 10%
-
-
What segmentation does the market report cover?
-
The report segmented by Type (Standalone pill dispenser and Portable pill dispenser), Application (Hospital pharmacies, Retail pharmacies, and Home healthcare), Indication (Physical disability, Neurodegenerative disorders and dementia, and Others), and Geography (North America, Europe, APAC, Middle East and Africa, and South America)
-
-
Which regions are analyzed in the report?
-
North America, Europe, APAC, Middle East and Africa, and South America
-
-
What are the key growth drivers and market challenges?
-
Growing aging population, High cost of pharmacy automation systems
-
-
Who are the major players in the Automatic Pill Dispensing Systems Market?
-
Key Companies Accu Chart Plus Health Care Systems, ARxIUM Inc., Becton Dickinson and Co., Capsa Healthcare LLC, Hero Health Inc., Innovation Associates, JVM Co. Ltd., Koninklijke Philips NV, McKesson Corp., Medminder Systems Inc., MedReady Inc, MIDEA Group Co. Ltd., NewIcon Oy, Omnicell Inc., Oracle Corp., PharmAdva LLC, PharmRight Corp., PHARMRX PTY LTD, ScriptPro LLC, and YUYAMA Co. Ltd.
-
Market Research Insights
- The market encompasses medication management software and automated dispensing cabinets that facilitate medication administration in healthcare settings. According to industry estimates, this market is projected to reach USD 3.5 billion by 2025, representing a significant growth from its current value. One key factor driving this expansion is the integration of medication history, refill alerts, and patient engagement tools, which enhance dosing accuracy and pharmacy workflow optimization. Furthermore, network connectivity, healthcare compliance, and device integration are essential features that ensure data security and regulatory compliance. In contrast, error handling mechanisms and remote monitoring systems enable medication safety and the prevention of errors.
- The market's advanced offerings include smart pill dispensers, interoperability standards, sensor technology, and electronic health record integration, contributing to clinical decision support and system maintenance. With a focus on patient data privacy, cloud storage, access control, and system reliability and scalability, automatic pill dispensing systems continue to evolve, improving medication administration efficiency and safety.
We can help! Our analysts can customize this automatic pill dispensing systems market research report to meet your requirements.
 RIA -
RIA - 
