Automotive Active Purge Pump Market Size 2024-2028
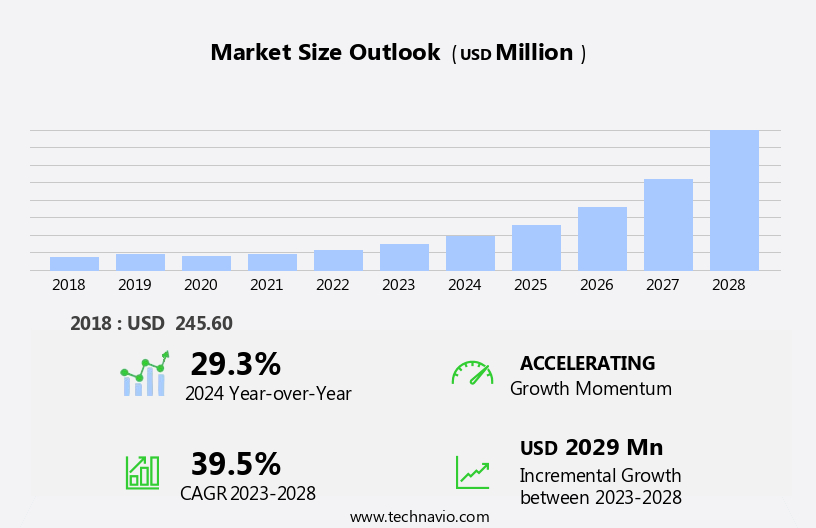
The automotive active purge pump market size is forecast to increase by USD 2.03 billion, at a CAGR of 39.5% between 2023 and 2028.
- The market is driven by stringent regulations mandating the adoption of advanced emission control systems in vehicles. These laws, formulated by governments worldwide, necessitate the use of active purge pumps to ensure efficient fuel evaporative emission control. Another key driver is the increasing popularity of electric vehicles (EVs), which also require active purge pumps for battery cooling and thermal management systems. However, the market faces challenges in the form of the high cost and weight of these pumps, which can impact vehicle affordability and fuel efficiency. Manufacturers must focus on developing cost-effective and lightweight solutions to address these challenges and capitalize on the market's potential.
- Additionally, the growing trend towards hybrid and hydrogen fuel cell vehicles presents opportunities for active purge pump manufacturers, as these vehicles also require advanced emission control systems. To stay competitive, companies must continuously innovate and improve the performance and efficiency of their active purge pumps while addressing cost and weight concerns.
What will be the Size of the Automotive Active Purge Pump Market during the forecast period?
Explore in-depth regional segment analysis with market size data - historical 2018-2022 and forecasts 2024-2028 - in the full report.
Request Free Sample
The market is characterized by continuous evolution and dynamic market activities. This market encompasses various sectors, including die casting, canister purge valve, electric vehicles, materials science, hybrid vehicles, emissions reduction, and vapor recovery systems. The integration of advanced technologies, such as solenoid valves and pressure sensors, into the manufacturing process enhances the efficiency and effectiveness of active purge pumps. In the realm of electric vehicles, the focus on emissions reduction and fuel efficiency drives the demand for active purge pumps in the vapor recovery system. Materials science plays a pivotal role in enhancing the service life of purge valves and rubber components, ensuring optimal performance and reliability.
Heavy-duty vehicles and light trucks are also adopting active purge pumps to meet stringent emissions standards set by regulatory bodies like the EPA and CARB. Injection molding and die casting processes employ active purge pumps to improve quality control and reduce costs. The supply chain for active purge pumps is intricately linked to the manufacturing process, with distribution networks ensuring seamless delivery of components and finished products. The use of metal alloys and advanced flow sensors in active purge pumps further optimizes their performance and efficiency. The market is an ever-evolving landscape, with ongoing research and development in materials science and manufacturing processes shaping its future.
The integration of these advancements into various vehicle applications, from fuel tanks to hybrid and electric vehicles, underscores the market's continuous dynamism.
How is this Automotive Active Purge Pump Industry segmented?
The automotive active purge pump industry research report provides comprehensive data (region-wise segment analysis), with forecasts and estimates in "USD million" for the period 2024-2028, as well as historical data from 2018-2022 for the following segments.
- Vehicle Type
- Passenger Vehicles
- Commercial Vehicles
- Fuel Type
- Gasoline
- Hybrid
- Application
- Evaporative Emission Control
- Fuel Vapor Management
- Geography
- North America
- US
- Canada
- Europe
- France
- Germany
- UK
- Middle East and Africa
- UAE
- APAC
- Australia
- China
- India
- Japan
- South Korea
- South America
- Brazil
- Rest of World (ROW)
- North America
By Vehicle Type Insights
The passenger vehicles segment is estimated to witness significant growth during the forecast period.
The automotive industry is experiencing significant advancements, particularly in the passenger vehicle segment, which holds the largest market share. These developments are primarily driven by stringent emission regulations, fuel efficiency standards, and the need to reduce production costs. The global passenger vehicle market produced 67.1 million units in 2019, according to the Organisation Internationale des Constructeurs d'Automobiles (OICA). In Europe, mid-sized crossover sales grew by 8% in 2019 to 872,500 units. Technological innovations in the automotive sector include the integration of materials science in manufacturing processes, such as die casting and injection molding, to create lightweight components.
Electric and hybrid vehicles are gaining popularity due to their environmental benefits, leading to the increased use of vapor recovery systems and purge valves. These systems ensure the efficient recovery and reuse of fuel vapors, contributing to emissions reduction. The supply chain in the automotive industry is evolving, with a focus on quality control and cost reduction. Solenoid valves and pressure sensors are essential components in various vehicle systems, including the fuel tank and emissions control systems. Rubber components and metal alloys are also crucial in the manufacturing process, ensuring the durability and longevity of the vehicle.
Heavy-duty vehicles and light trucks are subject to different emissions standards, with the former facing stricter regulations due to their larger carbon footprint. The distribution network plays a significant role in ensuring the availability and accessibility of these vehicles, with companies investing in expanding their reach and improving their service life. In conclusion, the automotive industry is undergoing transformative changes, driven by technological advancements, regulatory requirements, and consumer preferences. The integration of materials science, vapor recovery systems, and purge valves is essential for reducing emissions and improving fuel efficiency. The focus on quality control, cost reduction, and expanding distribution networks is crucial for maintaining a competitive edge in the market.
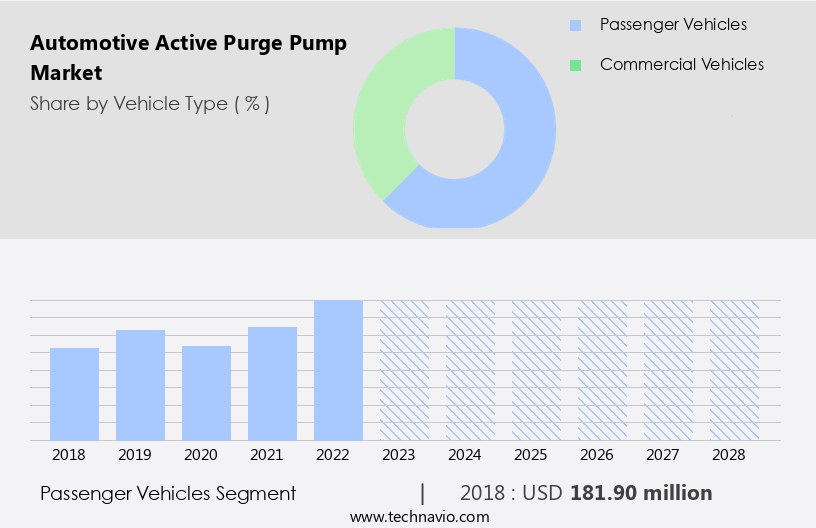
The Passenger Vehicles segment was valued at USD 181.90 billion in 2018 and showed a gradual increase during the forecast period.
Regional Analysis
Europe is estimated to contribute 51% to the growth of the global market during the forecast period.Technavio’s analysts have elaborately explained the regional trends and drivers that shape the market during the forecast period.

The European the market is primarily driven by the passenger car segment due to the high production and sales volumes in this sector. Europe's leadership in luxury car manufacturing, with brands like Mercedes-Benz, BMW, and Audi, contributes significantly to market growth. These premium carmakers equip their vehicles with advanced emission control and safety systems, increasing the demand for active purge pumps. Moreover, the increasing preference for luxury cars in Europe presents lucrative opportunities for market participants. In 2023, Europe held the largest market share in the global automotive active purge pump industry and is projected to maintain its position during the forecast period.
Materials science plays a crucial role in the manufacturing process, with rubber components and metal alloys used in the production of purge valves and canisters. The vapor recovery system, which includes purge pumps, is essential for emissions reduction and fuel efficiency in modern vehicles. The supply chain involves various components, such as solenoid valves, pressure sensors, and flow sensors, which ensure the proper functioning of the purge system. EPA regulations and emissions standards for heavy-duty vehicles and light trucks also contribute to market growth, as these vehicles require efficient purge systems to meet the stringent requirements. The distribution network ensures the timely delivery of these components to vehicle manufacturers and aftermarket customers.
Overall, the European the market is a dynamic and evolving industry, driven by technological advancements, regulatory requirements, and consumer demand for fuel-efficient and environmentally friendly vehicles.
Market Dynamics
Our researchers analyzed the data with 2023 as the base year, along with the key drivers, trends, and challenges. A holistic analysis of drivers will help companies refine their marketing strategies to gain a competitive advantage.
The market is a significant segment in the automotive industry, focusing on the production and application of active purge pumps in vehicles. These advanced pumps play a crucial role in the emission control system, ensuring efficient fuel combustion and reducing harmful emissions. The market encompasses various types of active purge pumps, including electric, vacuum-assisted, and engine-driven pumps. Key players in this market prioritize innovation, designing pumps with enhanced durability, improved flow rates, and advanced control systems. The integration of these pumps in hybrid and electric vehicles is a growing trend, as they optimize fuel efficiency and contribute to overall vehicle performance. Furthermore, stringent emission regulations drive the demand for active purge pumps, making them an essential component in modern vehicles' emission control systems. Additionally, the market witnesses continuous advancements in materials, manufacturing processes, and technology, ensuring the production of high-performance and cost-effective pumps.
What are the key market drivers leading to the rise in the adoption of Automotive Active Purge Pump Industry?
- Strict government-formulated laws are essential for market functionality and compliance.
- The market is driven by increasing regulations aimed at reducing carbon emissions from vehicles, particularly those powered by gasoline. These regulations, implemented by various governments worldwide, are a response to health and environmental concerns. Gasoline fuel is highly combustible and prone to evaporation, resulting in the emission of harmful fumes containing benzene. Inhaling these fumes can pose health risks. Furthermore, the issue of photochemical smog, caused by the combination of sunlight and exhaust fumes, is a growing concern in megacities. To mitigate these issues, modern vehicles are equipped with an onboard system that minimizes hydrocarbon emissions. This system includes an active purge pump, which enhances the flow of fuel vapor from the fuel tank to the carbon canister for storage before being released back into the engine for combustion.
- The use of active purge pumps helps in cost reduction by optimizing fuel consumption and improving engine performance. A flow sensor is employed to monitor the fuel vapor flow rate, ensuring efficient operation of the system.
What are the market trends shaping the Automotive Active Purge Pump Industry?
- Weight and cost reduction are current market trends that prioritize efficiency and economization in business operations. Companies are increasingly focusing on these areas to enhance competitiveness and optimize resources.
- The market is experiencing significant growth due to the emphasis on weight reduction and cost efficiency in the automotive industry. With the increasing focus on fuel efficiency and emissions reduction, automakers are turning to lightweight materials such as advanced composites and aluminum for vehicle design. Active purge pumps, essential components of emission control systems, are also being developed using lighter materials to contribute to this trend. By decreasing the overall weight of the vehicle, lighter pumps help improve fuel economy and reduce emissions, making them a valuable addition to modern vehicles. Furthermore, the vapor recovery system in the automotive industry benefits from the use of active purge pumps, which optimize the system's performance and contribute to emissions reduction.
- Materials science plays a crucial role in the development of these pumps, ensuring their durability and effectiveness while keeping production costs low. The supply chain for active purge pumps is streamlined to meet the growing demand, with manufacturers focusing on innovation and efficiency to meet the evolving needs of the automotive industry. Electric and hybrid vehicles, which are becoming increasingly popular, also rely on active purge pumps to optimize their emissions systems and improve overall performance.
What challenges does the Automotive Active Purge Pump Industry face during its growth?
- The rising demand for electric vehicles (EVs) poses a significant challenge to the automotive industry's growth trajectory.
- The market is driven by the increasing adoption of electric vehicles (EVs) and stringent emissions standards. According to the International Energy Agency (IEA), the Electric Vehicles Initiative was initiated in 2009 to promote EV development in the transportation sector under the Clean Energy Ministerial. With the global EV adoption surpassing 3 million units, China leads the market with over 50% adoption in 2020. The US is also encouraging EV adoption through incentives such as rebates, tax credits, and tax exemptions for the purchase of plug-in hybrid electric vehicles (PHEVs). The manufacturing process of active purge pumps involves the use of solenoid valves for controlling the flow of fuel and air.
- Injection molding is a common manufacturing technique used to produce these components. EPA regulations mandate the use of active purge pumps in heavy-duty vehicles to meet emissions standards, ensuring fuel efficiency and reduced GHG emissions. Quality control measures are essential in the manufacturing process to ensure the durability and reliability of these pumps.
Exclusive Customer Landscape
The automotive active purge pump market forecasting report includes the adoption lifecycle of the market, covering from the innovator’s stage to the laggard’s stage. It focuses on adoption rates in different regions based on penetration. Furthermore, the automotive active purge pump market report also includes key purchase criteria and drivers of price sensitivity to help companies evaluate and develop their market growth analysis strategies.

Customer Landscape
Key Companies & Market Insights
Companies are implementing various strategies, such as strategic alliances, automotive active purge pump market forecast, partnerships, mergers and acquisitions, geographical expansion, and product/service launches, to enhance their presence in the industry.
Agilent Technologies Inc. - The company specializes in providing automotive active purge pump solutions, including the X3501-68003, X3502-68004, and PTSPURGEKIT. These products enhance engine performance and efficiency, ensuring optimal fuel system operation. With a focus on innovation and quality, the company's offerings cater to diverse automotive needs.
The industry research and growth report includes detailed analyses of the competitive landscape of the market and information about key companies, including:
- Agilent Technologies Inc.
- Continental AG
- DENSO Corp.
- Dial Manufacturing Inc.
- Eaton Corp plc
- Geotech Environmental Equipment Inc.
- HELLA GmbH and Co. KGaA
- Robert Bosch GmbH
- Sauermann Group
- Vitesco Technologies Group AG
Qualitative and quantitative analysis of companies has been conducted to help clients understand the wider business environment as well as the strengths and weaknesses of key industry players. Data is qualitatively analyzed to categorize companies as pure play, category-focused, industry-focused, and diversified; it is quantitatively analyzed to categorize companies as dominant, leading, strong, tentative, and weak.
Recent Development and News in Automotive Active Purge Pump Market
- In January 2024, Continental AG, a leading automotive technology company, announced the launch of its new Active Pure Air System with an integrated active purge pump. This system aims to improve cabin air quality by continuously filtering and recirculating air inside the vehicle (Continental AG press release).
- In March 2024, Magna International, a global automotive supplier, entered into a strategic partnership with Honeywell to develop and manufacture electric active purge pumps for various automakers. This collaboration is expected to enhance Magna's product portfolio and strengthen its presence in the electric vehicle market (Magna International press release).
- In May 2024, Denso Corporation, a major automotive components manufacturer, received regulatory approval for its new active purge pump technology in Europe. This approval marks Denso's entry into the European market with its advanced purge pump technology, which is designed to improve fuel efficiency and reduce emissions (Denso Corporation press release).
- In April 2025, Bosch Automotive Service Solutions GmbH, a subsidiary of Bosch, announced a significant investment of â¬50 million in its production facility in Würzburg, Germany, to expand its capacity for manufacturing active purge pumps. This expansion is in response to the growing demand for advanced emission control systems in the automotive industry (Bosch Automotive Service Solutions GmbH press release).
Research Analyst Overview
- The automotive aftermarket is witnessing significant activity in the area of active purge pumps, driven by the need for cost optimization in vehicle repair and manufacturing efficiency. Product development in this sector is focused on testing and validation to ensure quality assurance and regulatory compliance. Performance optimization and emission control are key areas of interest, with material selection and supply chain management playing crucial roles in the design and production of these components. Active purge pumps are essential elements of engine management systems, requiring reverse engineering and automotive software integration for effective operation. The market is also witnessing a trend towards preventive maintenance and root cause analysis to minimize failure and improve parts distribution.
- Automotive sensors and actuators are integral to the functioning of active purge pumps, necessitating a collaborative approach between manufacturers and suppliers to ensure seamless integration. Fuel system efficiency and regulatory compliance are critical factors influencing the market's growth, with lifecycle management and failure analysis also playing essential roles in maintaining the competitiveness of automotive components.
Dive into Technavio’s robust research methodology, blending expert interviews, extensive data synthesis, and validated models for unparalleled Automotive Active Purge Pump Market insights. See full methodology.
|
Market Scope |
|
|
Report Coverage |
Details |
|
Page number |
161 |
|
Base year |
2023 |
|
Historic period |
2018-2022 |
|
Forecast period |
2024-2028 |
|
Growth momentum & CAGR |
Accelerate at a CAGR of 39.5% |
|
Market growth 2024-2028 |
USD 2029 million |
|
Market structure |
Fragmented |
|
YoY growth 2023-2024(%) |
29.3 |
|
Key countries |
US, China, Germany, Japan, UK, Australia, India, France, Brazil, Canada, UAE, Rest of World (ROW), Saudi Arabia, France, and South Korea |
|
Competitive landscape |
Leading Companies, Market Positioning of Companies, Competitive Strategies, and Industry Risks |
What are the Key Data Covered in this Automotive Active Purge Pump Market Research and Growth Report?
- CAGR of the Automotive Active Purge Pump industry during the forecast period
- Detailed information on factors that will drive the growth and forecasting between 2024 and 2028
- Precise estimation of the size of the market and its contribution of the industry in focus to the parent market
- Accurate predictions about upcoming growth and trends and changes in consumer behaviour
- Growth of the market across Europe, North America, APAC, South America, and Middle East and Africa
- Thorough analysis of the market’s competitive landscape and detailed information about companies
- Comprehensive analysis of factors that will challenge the automotive active purge pump market growth of industry companies
We can help! Our analysts can customize this automotive active purge pump market research report to meet your requirements.
 RIA -
RIA - 
