Autonomous Bus Market Analysis, Size, and Forecast 2025-2029: North America (US and Canada), APAC (China, India, Japan, South Korea), Europe (France, Germany, Italy, UK), Middle East and Africa , and South America

Autonomous Bus Market Analysis, Size, and Forecast 2025-2029:
North America (US and Canada), APAC (China, India, Japan, South Korea), Europe (France, Germany, Italy, UK), Middle East and Africa , and South America

Published: Mar 2025 222 Pages SKU: IRTNTR40072

Market Overview at a Glance

$2.88 B
Market Opportunity
22.4%
CAGR
21.4
YoY growth 2024-2025(%)

Autonomous Bus Market Size 2025-2029

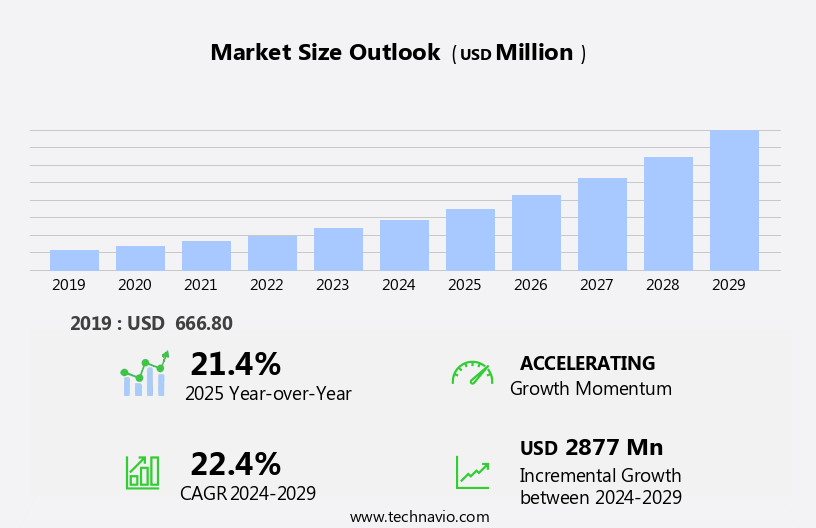
The autonomous bus market size is forecast to increase by USD 2.88 billion at a CAGR of 22.4% between 2024 and 2029.

  • The market is experiencing significant growth, driven by the increasing launch of new autonomous buses and the development of autonomous vehicle corridors. The number of autonomous buses in operation is on the rise, indicating a strong market demand. This trend is further fueled by the establishment of dedicated hybrid and  autonomous vehicle corridors, which provide a safe and regulated environment for the deployment of these vehicles. However, the market also faces challenges, primarily in the form of cybersecurity threats. The input data highlights that autonomous buses are vulnerable to cyberattacks, which could compromise the safety and reliability of these vehicles.
  • This issue poses a significant challenge for market players, requiring them to invest in robust cybersecurity measures to protect their systems and maintain consumer trust. Companies seeking to capitalize on the opportunities presented by the market must address these challenges effectively to ensure the safe and efficient deployment of their vehicles.

What will be the Size of the Autonomous Bus Market during the forecast period?

Autonomous Bus Market Size

 Request Free Sample

  • The market continues to evolve, driven by advancements in technology and shifting consumer preferences. Autonomous fleets are revolutionizing mass transit, with hybrid buses and electric vehicles leading the charge towards emission reduction and fuel efficiency. Route optimization and adaptive cruise control enable seamless passenger experience, while machine learning and sensor fusion enhance path planning and vehicle health monitoring. Autonomous driving is a key focus, with virtual testing and cloud computing facilitating the development of software-defined vehicles. Autonomous shuttle services and shared mobility solutions are gaining traction in urban mobility, addressing the last-mile delivery challenge. Regulatory frameworks are evolving to accommodate these innovations, with human-machine interface and passenger safety at the forefront.
  • On-demand transportation and predictive maintenance are essential components of fleet management, ensuring optimal performance and passenger experience. Autonomous navigation and obstacle detection are critical safety standards, with emergency braking and vehicle-to-vehicle communication further enhancing safety. Public acceptance is a crucial factor, with passenger information systems and vehicle-to-infrastructure communication playing a role in building trust. Continuous testing and validation, deep learning, and artificial intelligence are driving improvements in performance and reliability. The market's dynamics are ever-changing, with ongoing deployment strategies and evolving patterns shaping the future of autonomous buses.

How is this Autonomous Bus Industry segmented?

The autonomous bus industry research report provides comprehensive data (region-wise segment analysis), with forecasts and estimates in "USD million" for the period 2025-2029, as well as historical data from 2019-2023 for the following segments.

  • Type
    • Semi-autonomous
    • Fully-autonomous
  • Propulsion
    • Diesel
    • Electric
    • Hybrid
  • End-user
    • Public transportation
    • Private shuttle services
    • Logistics and goods transport
  • Geography
    • North America
      • US
      • Canada
    • Europe
      • France
      • Germany
      • Italy
      • UK
    • APAC
      • China
      • India
      • Japan
      • South Korea
    • Rest of World (ROW)

By Type Insights

The semi-autonomous segment is estimated to witness significant growth during the forecast period.

The market encompasses the development and implementation of buses with advanced technologies, including lane keeping, user experience, hybrid buses, last-mile delivery, fuel efficiency, route optimization, passenger safety, mass transit, path planning, software-defined vehicles, adaptive cruise control, camera systems, shared mobility, emission reduction, urban mobility, edge computing, over-the-air updates, vehicle health monitoring, electric buses, corporate transportation, autonomous shuttle, sensor fusion, fleet management, school transportation, vehicle-to-vehicle communication, machine learning, deployment strategies, passenger capacity, autonomous driving, virtual testing, cloud computing, automated guided vehicle, public transportation, regulatory framework, human-machine interface, passenger experience, on-demand transportation, safety standards, testing and validation, deep learning, public acceptance, passenger information system, predictive maintenance, artificial intelligence, emergency braking, obstacle detection, shuttle services, vehicle-to-infrastructure communication, and data analytics.

The semi-autonomous segment, which includes buses with driving automation at Level 3 or below, as defined by the Society of Automotive Engineers (SAE), is currently dominating the market. The growth of this segment can be attributed to the reduced cost of operations and the increasing availability of infrastructure supporting Level 3 autonomy in public transportation. As a result, the semi-the market is anticipated to expand significantly during the forecast period.

Autonomous Bus Market Size

Request Free Sample

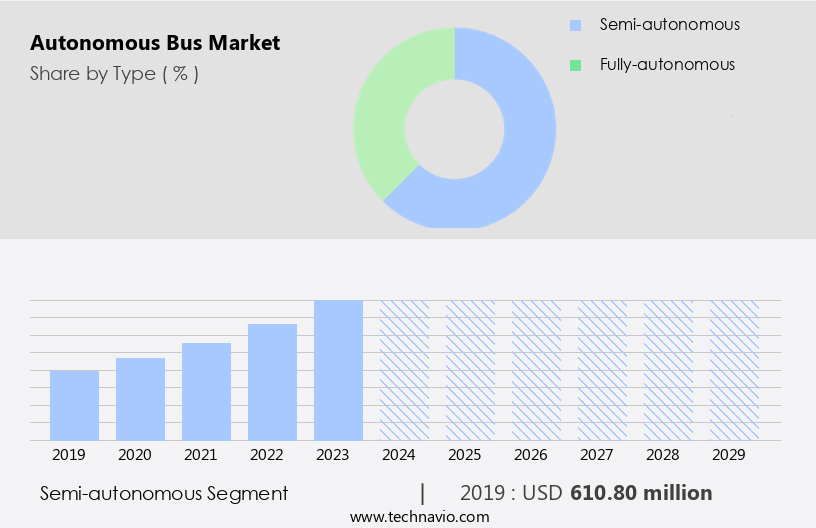
The Semi-autonomous segment was valued at USD 610.80 billion in 2019 and showed a gradual increase during the forecast period.

Regional Analysis

North America is estimated to contribute 36% to the growth of the global market during the forecast period.Technavio's analysts have elaborately explained the regional trends and drivers that shape the market during the forecast period.

Autonomous Bus Market Share by Geography

 Request Free Sample

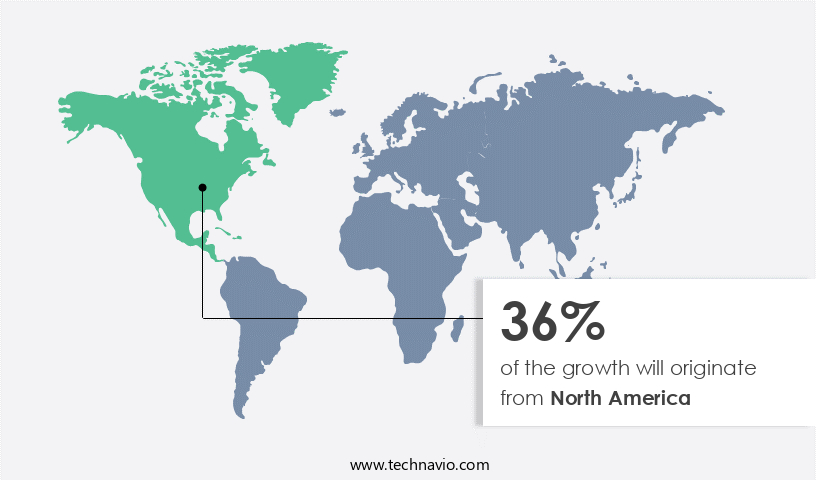
The market in the US is experiencing notable growth, driven by the presence of leading technology companies and collaborations in the field of vehicle autonomy. Autonomous fleet expansion, including buses, is a significant trend, with advancements in lane keeping, path planning, and sensor fusion. These technologies enhance user experience, improve fuel efficiency, and optimize routes for mass transit and last-mile delivery. Electric buses and shared mobility solutions, such as autonomous shuttle services, are also gaining traction due to their emission reduction capabilities and contribution to urban mobility. Moreover, the integration of edge computing, over-the-air updates, and vehicle health monitoring ensures fleet management efficiency and passenger safety.

Autonomous driving technologies, including adaptive cruise control, emergency braking, and obstacle detection, are crucial safety standards. Regulatory frameworks and testing and validation processes are essential for public acceptance and the successful deployment of autonomous buses. The market is further enriched by advancements in machine learning, deep learning, and artificial intelligence, which enable predictive maintenance and passenger information systems. Public transportation providers are adopting these technologies to enhance the overall passenger experience, ensuring a harmonious and immersive journey. Additionally, vehicle-to-vehicle and vehicle-to-infrastructure communication, data analytics, and automated guided vehicles are shaping the future of public transportation.

In conclusion, the market in the US is witnessing significant growth, fueled by technological advancements, collaborations, and the need for efficient, safe, and sustainable transportation solutions. The market's evolution is shaped by a focus on passenger experience, safety standards, and regulatory frameworks, ensuring a harmonious and immersive journey for passengers.

Market Dynamics

Our researchers analyzed the data with 2024 as the base year, along with the key drivers, trends, and challenges. A holistic analysis of drivers will help companies refine their marketing strategies to gain a competitive advantage.

What are the key market drivers leading to the rise in the adoption of Autonomous Bus Industry?

  • The significant advancements in autonomous vehicle technology, particularly in the creation of dedicated corridors, are the primary catalyst fueling market growth. 
  • Autonomous buses are gaining momentum in the mass transit sector, with lane keeping technology and user experience at the forefront of their development. BYD and All Nippon Airways (ANA) recently conducted a successful ten-day trial run of an autonomous driving bus at Haneda Airport in Japan. This marks ANA's initiative to enhance airport transportation and is a global first for BYD, showcasing their autonomous bus in real-world scenarios. The bus, equipped with advanced features such as adaptive cruise control, camera systems, path planning software, and route optimization, offers improved fuel efficiency and passenger safety.
  • The deployment of autonomous vehicle corridors facilitates the testing, development, and implementation of these innovative buses, contributing to the growth of the autonomous fleet market. Additionally, the integration of software-defined vehicles and hybrid buses in last-mile delivery services further enhances the market's potential.

What are the market trends shaping the Autonomous Bus Industry?

  • The launch of new autonomous buses is a notable trend in the market. This increasing trend signifies a significant shift towards advanced public transportation solutions.
  • The market is experiencing significant advancements, fueled by the growing emphasis on shared mobility and emission reduction in urban areas. Edge computing, sensor fusion, and vehicle-to-vehicle communication technologies are driving the development of autonomous buses. Electric buses are gaining popularity due to their environmental benefits and the integration of autonomous driving technology. Corporate transportation and school transportation sectors are increasingly adopting autonomous shuttles for cost-effective, efficient, and sustainable mobility solutions. Over-the-air updates and vehicle health monitoring systems ensure the continuous improvement of vehicle performance and safety. Fleet management systems enable operators to optimize routes, reduce downtime, and enhance passenger experience.
  • These trends are expected to propel the growth of the market during the forecast period. For instance, recent developments include the launch of the UK's first full-sized self-driving bus as part of a government-backed initiative, and the operation of five autonomous buses in Edinburgh as part of a connected and autonomous vehicles experiment.

What challenges does the Autonomous Bus Industry face during its growth?

  • The growth of the autonomous bus industry is significantly impacted by the escalating cybersecurity challenges, with potential threats posing potential risks to the safety and reliability of these vehicles. 
  • Autonomous buses, a subset of autonomous vehicles, employ machine learning algorithms and advanced sensors to ensure self-driving capabilities. Deployment strategies for these buses focus on enhancing passenger capacity and improving public transportation efficiency. Virtual testing and cloud computing facilitate the development and optimization of autonomous driving systems. However, the integration of these advanced technologies raises safety concerns, necessitating stringent regulatory frameworks. Passenger experience is a critical factor, with human-machine interface design playing a pivotal role in ensuring a harmonious and immersive experience.
  • On-demand transportation is a significant trend, with autonomous buses offering potential solutions to traffic congestion and reduced environmental impact. Despite these benefits, cybersecurity remains a challenge due to the increased connectivity and computational requirements. Ensuring data security and system integrity is essential to mitigate potential risks. The market is poised for growth, with continued innovation in automated guided vehicle technology and safety standards.

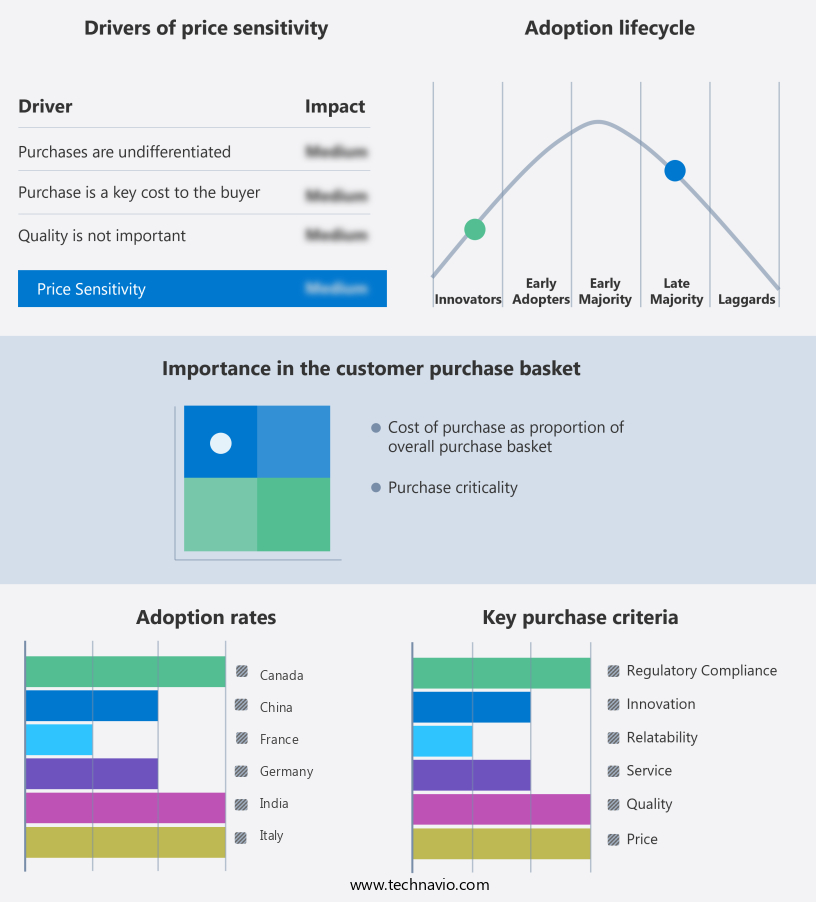
Exclusive Customer Landscape

The autonomous bus market forecasting report includes the adoption lifecycle of the market, covering from the innovator's stage to the laggard's stage. It focuses on adoption rates in different regions based on penetration. Furthermore, the autonomous bus market report also includes key purchase criteria and drivers of price sensitivity to help companies evaluate and develop their market growth analysis strategies.

Autonomous Bus Market Share by Geography

 Customer Landscape

Key Companies & Market Insights

Companies are implementing various strategies, such as strategic alliances, autonomous bus market forecast, partnerships, mergers and acquisitions, geographical expansion, and product/service launches, to enhance their presence in the industry.

AB Volvo - The company introduces Volvo 7900 Electric buses, outfitted with advanced sensors and navigation controls. Powered by Volvo's Autonomous Research Platform, this AI system manages bus operations, ensuring safety and efficiency. Equipped with cutting-edge technology, these buses represent the future of public transportation. The comprehensive AI system processes real-time data, enabling the buses to navigate complex environments and adapt to various situations. With a commitment to innovation, the company continues to push the boundaries of autonomous transportation solutions.

The industry research and growth report includes detailed analyses of the competitive landscape of the market and information about key companies, including:

  • AB Volvo
  • Aptiv Plc
  • Aurrigo International plc
  • Baidu Apollo Network Beijing Limited
  • BYD Co. Ltd.
  • Coast Autonomous Inc.
  • Continental AG
  • DeepBlue Technology Shanghai Co. Ltd.
  • Easymile SAS
  • Lilee Technology Inc.
  • Mercedes Benz Group AG
  • Navya SA
  • NFI Group Inc.
  • Proterra Inc.
  • Robert Bosch GmbH
  • Toyota Motor Corp.
  • Transdev Group SA
  • Xiamen King Long United Automotive Industry Co. Ltd.
  • Yutong Bus Co. Ltd.
  • ZF Friedrichshafen AG

Qualitative and quantitative analysis of companies has been conducted to help clients understand the wider business environment as well as the strengths and weaknesses of key industry players. Data is qualitatively analyzed to categorize companies as pure play, category-focused, industry-focused, and diversified; it is quantitatively analyzed to categorize companies as dominant, leading, strong, tentative, and weak.

Recent Development and News in Autonomous Bus Market

  • In March 2024, TransDev, a leading mobility provider, announced the launch of the world's first autonomous electric bus line in the Netherlands, marking a significant stride in the integration of autonomous buses into public transportation systems (TransDev Press Release, 2024). In October 2024, Waymo, Alphabet's autonomous vehicle subsidiary, entered into a strategic partnership with Volvo Buses to integrate Waymo's self-driving technology into Volvo buses, expanding their reach beyond ride-hailing services (Waymo Press Release, 2024).
  • In January 2025, NVIDIA, a leading technology company, secured a strategic investment of USD200 million from SoftBank Vision Fund 2 to accelerate the development and deployment of its autonomous driving platform, Drive AGX (NVIDIA Press Release, 2025). In May 2025, the European Union announced a €2.5 billion (USD2.8 billion) investment in autonomous bus projects, aiming to make Europe a global leader in autonomous public transportation (European Commission Press Release, 2025). These developments underscore the growing momentum in the market, driven by technological advancements, strategic partnerships, and significant investments.

Research Analyst Overview

In the realm of urban planning, the integration of autonomous buses into transportation systems is a significant trend. The development of autonomous vehicle technology relies heavily on big data and advanced sensor suites to ensure safe and efficient operation. Autonomous vehicle infrastructure, including smart cities and connected vehicles, plays a crucial role in enabling real-time information exchange and data-driven decision making. The future of transportation lies in the fusion of autonomous vehicle development and smart infrastructure. Autonomous vehicle simulation and open source software enable continuous improvement and innovation in this field. The reduction of carbon footprint is a key consideration, as the transportation sector contributes significantly to global emissions.

Autonomous vehicle platforms, including hardware and software, are essential components of the mobility ecosystems. Geospatial data and traffic management systems facilitate seamless integration of autonomous buses into urban transportation networks. The Internet of Things and clean energy are integral to the development of sustainable transportation solutions. AV testing and infrastructure development are ongoing processes that require collaboration between various stakeholders. Autonomous vehicle simulation and smart infrastructure enable efficient testing and optimization of AV technology. Infrastructure development, including sensor data and real-time information, is essential for ensuring safe and efficient AV operation. The integration of autonomous buses into urban transportation systems represents a major shift towards sustainable and efficient mobility solutions.The future of transportation is data-driven, and the development of AV infrastructure and technology is a critical component of this transition.

Dive into Technavio's robust research methodology, blending expert interviews, extensive data synthesis, and validated models for unparalleled Autonomous Bus Market insights. See full methodology.

Market Scope

Report Coverage

Details

Page number

222

Base year

2024

Historic period

2019-2023

Forecast period

2025-2029

Growth momentum & CAGR

Accelerate at a CAGR of 22.4%

Market growth 2025-2029

USD 2877 million

Market structure

Fragmented

YoY growth 2024-2025(%)

21.4

Key countries

US, Canada, China, Japan, India, Germany, South Korea, UK, France, and Italy

Competitive landscape

Leading Companies, Market Positioning of Companies, Competitive Strategies, and Industry Risks

Request Free Sample

What are the Key Data Covered in this Autonomous Bus Market Research and Growth Report?

  • CAGR of the Autonomous Bus industry during the forecast period
  • Detailed information on factors that will drive the growth and forecasting between 2025 and 2029
  • Precise estimation of the size of the market and its contribution of the industry in focus to the parent market
  • Accurate predictions about upcoming growth and trends and changes in consumer behaviour
  • Growth of the market across North America, APAC, Europe, Middle East and Africa, and South America
  • Thorough analysis of the market's competitive landscape and detailed information about companies
  • Comprehensive analysis of factors that will challenge the autonomous bus market growth of industry companies

We can help! Our analysts can customize this autonomous bus market research report to meet your requirements.

Get in touch

1 Executive Summary

  • 1.1 Market overview
    • Executive Summary - Chart on Market Overview
    • Executive Summary - Data Table on Market Overview
    • Executive Summary - Chart on Global Market Characteristics
    • Executive Summary - Chart on Market by Geography
    • Executive Summary - Chart on Market Segmentation by Type
    • Executive Summary - Chart on Market Segmentation by Propulsion
    • Executive Summary - Chart on Market Segmentation by End-user
    • Executive Summary - Chart on Incremental Growth
    • Executive Summary - Data Table on Incremental Growth
    • Executive Summary - Chart on Company Market Positioning

2 Technavio Analysis

  • 2.1 Analysis of price sensitivity, lifecycle, customer purchase basket, adoption rates, and purchase criteria
    • Analysis of price sensitivity, lifecycle, customer purchase basket, adoption rates, and purchase criteria
  • 2.2 Criticality of inputs and Factors of differentiation
    • Overview on criticality of inputs and factors of differentiation
  • 2.3 Factors of disruption
    • Overview on factors of disruption
  • 2.4 Impact of drivers and challenges
    • Impact of drivers and challenges in 2024 and 2029

3 Market Landscape

  • 3.1 Market ecosystem
    • Parent Market
    • Data Table on - Parent Market
  • 3.2 Market characteristics
    • Market characteristics analysis
  • 3.3 Value chain analysis
    • Value chain analysis

4 Market Sizing

  • 4.1 Market definition
    • Offerings of companies included in the market definition
  • 4.2 Market segment analysis
    • Market segments
  • 4.3 Market size 2024
    • 4.4 Market outlook: Forecast for 2024-2029
      • Chart on Global - Market size and forecast 2024-2029 ($ million)
      • Data Table on Global - Market size and forecast 2024-2029 ($ million)
      • Chart on Global Market: Year-over-year growth 2024-2029 (%)
      • Data Table on Global Market: Year-over-year growth 2024-2029 (%)

    5 Historic Market Size

    • 5.1 Global Autonomous Bus Market 2019 - 2023
      • Historic Market Size - Data Table on Global Autonomous Bus Market 2019 - 2023 ($ million)
    • 5.2 Type segment analysis 2019 - 2023
      • Historic Market Size - Type Segment 2019 - 2023 ($ million)
    • 5.3 Propulsion segment analysis 2019 - 2023
      • Historic Market Size - Propulsion Segment 2019 - 2023 ($ million)
    • 5.4 End-user segment analysis 2019 - 2023
      • Historic Market Size - End-user Segment 2019 - 2023 ($ million)
    • 5.5 Geography segment analysis 2019 - 2023
      • Historic Market Size - Geography Segment 2019 - 2023 ($ million)
    • 5.6 Country segment analysis 2019 - 2023
      • Historic Market Size - Country Segment 2019 - 2023 ($ million)

    6 Qualitative Analysis

    • 6.1 AI Impact on Global Autonomous Bus Market

      7 Five Forces Analysis

      • 7.1 Five forces summary
        • Five forces analysis - Comparison between 2024 and 2029
      • 7.2 Bargaining power of buyers
        • Bargaining power of buyers - Impact of key factors 2024 and 2029
      • 7.3 Bargaining power of suppliers
        • Bargaining power of suppliers - Impact of key factors in 2024 and 2029
      • 7.4 Threat of new entrants
        • Threat of new entrants - Impact of key factors in 2024 and 2029
      • 7.5 Threat of substitutes
        • Threat of substitutes - Impact of key factors in 2024 and 2029
      • 7.6 Threat of rivalry
        • Threat of rivalry - Impact of key factors in 2024 and 2029
      • 7.7 Market condition
        • Chart on Market condition - Five forces 2024 and 2029

      8 Market Segmentation by Type

      • 8.1 Market segments
        • Chart on Type - Market share 2024-2029 (%)
        • Data Table on Type - Market share 2024-2029 (%)
      • 8.2 Comparison by Type
        • Chart on Comparison by Type
        • Data Table on Comparison by Type
      • 8.3 Semi-autonomous - Market size and forecast 2024-2029
        • Chart on Semi-autonomous - Market size and forecast 2024-2029 ($ million)
        • Data Table on Semi-autonomous - Market size and forecast 2024-2029 ($ million)
        • Chart on Semi-autonomous - Year-over-year growth 2024-2029 (%)
        • Data Table on Semi-autonomous - Year-over-year growth 2024-2029 (%)
      • 8.4 Fully-autonomous - Market size and forecast 2024-2029
        • Chart on Fully-autonomous - Market size and forecast 2024-2029 ($ million)
        • Data Table on Fully-autonomous - Market size and forecast 2024-2029 ($ million)
        • Chart on Fully-autonomous - Year-over-year growth 2024-2029 (%)
        • Data Table on Fully-autonomous - Year-over-year growth 2024-2029 (%)
      • 8.5 Market opportunity by Type
        • Market opportunity by Type ($ million)
        • Data Table on Market opportunity by Type ($ million)

      9 Market Segmentation by Propulsion

      • 9.1 Market segments
        • Chart on Propulsion - Market share 2024-2029 (%)
        • Data Table on Propulsion - Market share 2024-2029 (%)
      • 9.2 Comparison by Propulsion
        • Chart on Comparison by Propulsion
        • Data Table on Comparison by Propulsion
      • 9.3 Diesel - Market size and forecast 2024-2029
        • Chart on Diesel - Market size and forecast 2024-2029 ($ million)
        • Data Table on Diesel - Market size and forecast 2024-2029 ($ million)
        • Chart on Diesel - Year-over-year growth 2024-2029 (%)
        • Data Table on Diesel - Year-over-year growth 2024-2029 (%)
      • 9.4 Electric - Market size and forecast 2024-2029
        • Chart on Electric - Market size and forecast 2024-2029 ($ million)
        • Data Table on Electric - Market size and forecast 2024-2029 ($ million)
        • Chart on Electric - Year-over-year growth 2024-2029 (%)
        • Data Table on Electric - Year-over-year growth 2024-2029 (%)
      • 9.5 Hybrid - Market size and forecast 2024-2029
        • Chart on Hybrid - Market size and forecast 2024-2029 ($ million)
        • Data Table on Hybrid - Market size and forecast 2024-2029 ($ million)
        • Chart on Hybrid - Year-over-year growth 2024-2029 (%)
        • Data Table on Hybrid - Year-over-year growth 2024-2029 (%)
      • 9.6 Market opportunity by Propulsion
        • Market opportunity by Propulsion ($ million)
        • Data Table on Market opportunity by Propulsion ($ million)

      10 Market Segmentation by End-user

      • 10.1 Market segments
        • Chart on End-user - Market share 2024-2029 (%)
        • Data Table on End-user - Market share 2024-2029 (%)
      • 10.2 Comparison by End-user
        • Chart on Comparison by End-user
        • Data Table on Comparison by End-user
      • 10.3 Public transportation - Market size and forecast 2024-2029
        • Chart on Public transportation - Market size and forecast 2024-2029 ($ million)
        • Data Table on Public transportation - Market size and forecast 2024-2029 ($ million)
        • Chart on Public transportation - Year-over-year growth 2024-2029 (%)
        • Data Table on Public transportation - Year-over-year growth 2024-2029 (%)
      • 10.4 Private shuttle services - Market size and forecast 2024-2029
        • Chart on Private shuttle services - Market size and forecast 2024-2029 ($ million)
        • Data Table on Private shuttle services - Market size and forecast 2024-2029 ($ million)
        • Chart on Private shuttle services - Year-over-year growth 2024-2029 (%)
        • Data Table on Private shuttle services - Year-over-year growth 2024-2029 (%)
      • 10.5 Logistics and goods transport - Market size and forecast 2024-2029
        • Chart on Logistics and goods transport - Market size and forecast 2024-2029 ($ million)
        • Data Table on Logistics and goods transport - Market size and forecast 2024-2029 ($ million)
        • Chart on Logistics and goods transport - Year-over-year growth 2024-2029 (%)
        • Data Table on Logistics and goods transport - Year-over-year growth 2024-2029 (%)
      • 10.6 Market opportunity by End-user
        • Market opportunity by End-user ($ million)
        • Data Table on Market opportunity by End-user ($ million)

      11 Customer Landscape

      • 11.1 Customer landscape overview
        • Analysis of price sensitivity, lifecycle, customer purchase basket, adoption rates, and purchase criteria

      12 Geographic Landscape

      • 12.1 Geographic segmentation
        • Chart on Market share by geography 2024-2029 (%)
        • Data Table on Market share by geography 2024-2029 (%)
      • 12.2 Geographic comparison
        • Chart on Geographic comparison
        • Data Table on Geographic comparison
      • 12.3 North America - Market size and forecast 2024-2029
        • Chart on North America - Market size and forecast 2024-2029 ($ million)
        • Data Table on North America - Market size and forecast 2024-2029 ($ million)
        • Chart on North America - Year-over-year growth 2024-2029 (%)
        • Data Table on North America - Year-over-year growth 2024-2029 (%)
      • 12.4 APAC - Market size and forecast 2024-2029
        • Chart on APAC - Market size and forecast 2024-2029 ($ million)
        • Data Table on APAC - Market size and forecast 2024-2029 ($ million)
        • Chart on APAC - Year-over-year growth 2024-2029 (%)
        • Data Table on APAC - Year-over-year growth 2024-2029 (%)
      • 12.5 Europe - Market size and forecast 2024-2029
        • Chart on Europe - Market size and forecast 2024-2029 ($ million)
        • Data Table on Europe - Market size and forecast 2024-2029 ($ million)
        • Chart on Europe - Year-over-year growth 2024-2029 (%)
        • Data Table on Europe - Year-over-year growth 2024-2029 (%)
      • 12.6 Middle East and Africa - Market size and forecast 2024-2029
        • Chart on Middle East and Africa - Market size and forecast 2024-2029 ($ million)
        • Data Table on Middle East and Africa - Market size and forecast 2024-2029 ($ million)
        • Chart on Middle East and Africa - Year-over-year growth 2024-2029 (%)
        • Data Table on Middle East and Africa - Year-over-year growth 2024-2029 (%)
      • 12.7 South America - Market size and forecast 2024-2029
        • Chart on South America - Market size and forecast 2024-2029 ($ million)
        • Data Table on South America - Market size and forecast 2024-2029 ($ million)
        • Chart on South America - Year-over-year growth 2024-2029 (%)
        • Data Table on South America - Year-over-year growth 2024-2029 (%)
      • 12.8 US - Market size and forecast 2024-2029
        • Chart on US - Market size and forecast 2024-2029 ($ million)
        • Data Table on US - Market size and forecast 2024-2029 ($ million)
        • Chart on US - Year-over-year growth 2024-2029 (%)
        • Data Table on US - Year-over-year growth 2024-2029 (%)
      • 12.9 Canada - Market size and forecast 2024-2029
        • Chart on Canada - Market size and forecast 2024-2029 ($ million)
        • Data Table on Canada - Market size and forecast 2024-2029 ($ million)
        • Chart on Canada - Year-over-year growth 2024-2029 (%)
        • Data Table on Canada - Year-over-year growth 2024-2029 (%)
      • 12.10 China - Market size and forecast 2024-2029
        • Chart on China - Market size and forecast 2024-2029 ($ million)
        • Data Table on China - Market size and forecast 2024-2029 ($ million)
        • Chart on China - Year-over-year growth 2024-2029 (%)
        • Data Table on China - Year-over-year growth 2024-2029 (%)
      • 12.11 Japan - Market size and forecast 2024-2029
        • Chart on Japan - Market size and forecast 2024-2029 ($ million)
        • Data Table on Japan - Market size and forecast 2024-2029 ($ million)
        • Chart on Japan - Year-over-year growth 2024-2029 (%)
        • Data Table on Japan - Year-over-year growth 2024-2029 (%)
      • 12.12 India - Market size and forecast 2024-2029
        • Chart on India - Market size and forecast 2024-2029 ($ million)
        • Data Table on India - Market size and forecast 2024-2029 ($ million)
        • Chart on India - Year-over-year growth 2024-2029 (%)
        • Data Table on India - Year-over-year growth 2024-2029 (%)
      • 12.13 Germany - Market size and forecast 2024-2029
        • Chart on Germany - Market size and forecast 2024-2029 ($ million)
        • Data Table on Germany - Market size and forecast 2024-2029 ($ million)
        • Chart on Germany - Year-over-year growth 2024-2029 (%)
        • Data Table on Germany - Year-over-year growth 2024-2029 (%)
      • 12.14 UK - Market size and forecast 2024-2029
        • Chart on UK - Market size and forecast 2024-2029 ($ million)
        • Data Table on UK - Market size and forecast 2024-2029 ($ million)
        • Chart on UK - Year-over-year growth 2024-2029 (%)
        • Data Table on UK - Year-over-year growth 2024-2029 (%)
      • 12.15 South Korea - Market size and forecast 2024-2029
        • Chart on South Korea - Market size and forecast 2024-2029 ($ million)
        • Data Table on South Korea - Market size and forecast 2024-2029 ($ million)
        • Chart on South Korea - Year-over-year growth 2024-2029 (%)
        • Data Table on South Korea - Year-over-year growth 2024-2029 (%)
      • 12.16 France - Market size and forecast 2024-2029
        • Chart on France - Market size and forecast 2024-2029 ($ million)
        • Data Table on France - Market size and forecast 2024-2029 ($ million)
        • Chart on France - Year-over-year growth 2024-2029 (%)
        • Data Table on France - Year-over-year growth 2024-2029 (%)
      • 12.17 Italy - Market size and forecast 2024-2029
        • Chart on Italy - Market size and forecast 2024-2029 ($ million)
        • Data Table on Italy - Market size and forecast 2024-2029 ($ million)
        • Chart on Italy - Year-over-year growth 2024-2029 (%)
        • Data Table on Italy - Year-over-year growth 2024-2029 (%)
      • 12.18 Market opportunity by geography
        • Market opportunity by geography ($ million)
        • Data Tables on Market opportunity by geography ($ million)

      13 Drivers, Challenges, and Opportunity/Restraints

      • 13.1 Market drivers
        • 13.2 Market challenges
          • 13.3 Impact of drivers and challenges
            • Impact of drivers and challenges in 2024 and 2029
          • 13.4 Market opportunities/restraints

            14 Competitive Landscape

            • 14.1 Overview
              • 14.2 Competitive Landscape
                • Overview on criticality of inputs and factors of differentiation
              • 14.3 Landscape disruption
                • Overview on factors of disruption
              • 14.4 Industry risks
                • Impact of key risks on business

              15 Competitive Analysis

              • 15.1 Companies profiled
                • Companies covered
              • 15.2 Company ranking index
                • Company ranking index
              • 15.3 Market positioning of companies
                • Matrix on companies position and classification
              • 15.4 AB Volvo
                • AB Volvo - Overview
                • AB Volvo - Business segments
                • AB Volvo - Key news
                • AB Volvo - Key offerings
                • AB Volvo - Segment focus
                • SWOT
              • 15.5 Aurrigo International plc
                • Aurrigo International plc - Overview
                • Aurrigo International plc - Product / Service
                • Aurrigo International plc - Key offerings
                • SWOT
              • 15.6 Baidu Apollo Network Beijing Limited
                • Baidu Apollo Network Beijing Limited - Overview
                • Baidu Apollo Network Beijing Limited - Product / Service
                • Baidu Apollo Network Beijing Limited - Key offerings
                • SWOT
              • 15.7 Continental AG
                • Continental AG - Overview
                • Continental AG - Business segments
                • Continental AG - Key news
                • Continental AG - Key offerings
                • Continental AG - Segment focus
                • SWOT
              • 15.8 DeepBlue Technology Shanghai Co. Ltd.
                • DeepBlue Technology Shanghai Co. Ltd. - Overview
                • DeepBlue Technology Shanghai Co. Ltd. - Product / Service
                • DeepBlue Technology Shanghai Co. Ltd. - Key offerings
                • SWOT
              • 15.9 Easymile SAS
                • Easymile SAS - Overview
                • Easymile SAS - Product / Service
                • Easymile SAS - Key offerings
                • SWOT
              • 15.10 Mercedes Benz Group AG
                • Mercedes Benz Group AG - Overview
                • Mercedes Benz Group AG - Product / Service
                • Mercedes Benz Group AG - Key offerings
                • SWOT
              • 15.11 Navya SA
                • Navya SA - Overview
                • Navya SA - Product / Service
                • Navya SA - Key offerings
                • SWOT
              • 15.12 Proterra Inc.
                • Proterra Inc. - Overview
                • Proterra Inc. - Product / Service
                • Proterra Inc. - Key offerings
                • SWOT
              • 15.13 Robert Bosch GmbH
                • Robert Bosch GmbH - Overview
                • Robert Bosch GmbH - Product / Service
                • Robert Bosch GmbH - Key news
                • Robert Bosch GmbH - Key offerings
                • SWOT
              • 15.14 Toyota Motor Corp.
                • Toyota Motor Corp. - Overview
                • Toyota Motor Corp. - Business segments
                • Toyota Motor Corp. - Key news
                • Toyota Motor Corp. - Key offerings
                • Toyota Motor Corp. - Segment focus
                • SWOT
              • 15.15 Transdev Group SA
                • Transdev Group SA - Overview
                • Transdev Group SA - Product / Service
                • Transdev Group SA - Key offerings
                • SWOT
              • 15.16 Xiamen King Long United Automotive Industry Co. Ltd.
                • Xiamen King Long United Automotive Industry Co. Ltd. - Overview
                • Xiamen King Long United Automotive Industry Co. Ltd. - Product / Service
                • Xiamen King Long United Automotive Industry Co. Ltd. - Key offerings
                • SWOT
              • 15.17 Yutong Bus Co. Ltd.
                • Yutong Bus Co. Ltd. - Overview
                • Yutong Bus Co. Ltd. - Product / Service
                • Yutong Bus Co. Ltd. - Key offerings
                • SWOT
              • 15.18 ZF Friedrichshafen AG
                • ZF Friedrichshafen AG - Overview
                • ZF Friedrichshafen AG - Business segments
                • ZF Friedrichshafen AG - Key news
                • ZF Friedrichshafen AG - Key offerings
                • ZF Friedrichshafen AG - Segment focus
                • SWOT

              16 Appendix

              • 16.1 Scope of the report
                • 16.2 Inclusions and exclusions checklist
                  • Inclusions checklist
                  • Exclusions checklist
                • 16.3 Currency conversion rates for US$
                  • Currency conversion rates for US$
                • 16.4 Research methodology
                  • Research methodology
                • 16.5 Data procurement
                  • Information sources
                • 16.6 Data validation
                  • Data validation
                • 16.7 Validation techniques employed for market sizing
                  • Validation techniques employed for market sizing
                • 16.8 Data synthesis
                  • Data synthesis
                • 16.9 360 degree market analysis
                  • 360 degree market analysis
                • 16.10 List of abbreviations
                  • List of abbreviations

                Research Methodology

                Technavio presents a detailed picture of the market by way of study, synthesis, and summation of data from multiple sources. The analysts have presented the various facets of the market with a particular focus on identifying the key industry influencers. The data thus presented is comprehensive, reliable, and the result of extensive research, both primary and secondary.

                INFORMATION SOURCES

                Primary sources

                • Manufacturers and suppliers
                • Channel partners
                • Industry experts
                • Strategic decision makers

                Secondary sources

                • Industry journals and periodicals
                • Government data
                • Financial reports of key industry players
                • Historical data
                • Press releases

                DATA ANALYSIS

                Data Synthesis

                • Collation of data
                • Estimation of key figures
                • Analysis of derived insights

                Data Validation

                • Triangulation with data models
                • Reference against proprietary databases
                • Corroboration with industry experts

                REPORT WRITING

                Qualitative

                • Market drivers
                • Market challenges
                • Market trends
                • Five forces analysis

                Quantitative

                • Market size and forecast
                • Market segmentation
                • Geographical insights
                • Competitive landscape

                Interested in this report?

                Get your sample now to see our research methodology and insights!

                Download Now

                Frequently Asked Questions

                Autonomous Bus market growth will increase by $ 2877 mn during 2025-2029.

                The Autonomous Bus market is expected to grow at a CAGR of 22.4% during 2025-2029.

                Autonomous Bus market is segmented by Type( Semi-autonomous, Fully-autonomous, Hybrid) Propulsion( Diesel, Electric, Hybrid, Middle East and Africa, South America) End-user( Public transportation, Private shuttle services, Logistics and goods transport, Middle East and Africa, South America)

                AB Volvo, Aptiv Plc, Aurrigo International plc, Baidu Apollo Network Beijing Limited, BYD Co. Ltd., Coast Autonomous Inc., Continental AG, DeepBlue Technology Shanghai Co. Ltd., Easymile SAS, Lilee Technology Inc., Mercedes Benz Group AG, Navya SA, NFI Group Inc., Proterra Inc., Robert Bosch GmbH, Toyota Motor Corp., Transdev Group SA, Xiamen King Long United Automotive Industry Co. Ltd., Yutong Bus Co. Ltd., ZF Friedrichshafen AG are a few of the key vendors in the Autonomous Bus market.

                North America will register the highest growth rate of 36% among the other regions. Therefore, the Autonomous Bus market in North America is expected to garner significant business opportunities for the vendors during the forecast period.

                US, Canada, China, Japan, India, Germany, South Korea, UK, France, Italy

                • Growing developments in autonomous vehicle corridorsAutonomous vehicle corridors that provide supporting infrastructure offer a conducive environment for the testing is the driving factor this market.
                • development is the driving factor this market.
                • and deployment of autonomous buses. Some of the recent developments in the deployment of such corridors dedicated to autonomous vehicles include:In February 2024 is the driving factor this market.
                • BYD and All Nippon Airways (ANA) is the driving factor this market.
                • the biggest airline in Japan is the driving factor this market.
                • concluded a ten-day trial run of an autonomous driving bus at Tokyos Haneda Airport. The bus represents ANAs audacious attempt to imagine a Simple and Smart airport and is BYDs first autonomous driving bus that has been tested and utilized in real-world scenarios worldwide. Haneda Airport will operate the nations first autonomous bus test program with this bus is the driving factor this market.
                • making it the first international airport to possess autonomous bus transport capabilities.In January 2024 is the driving factor this market.
                • the city of Singapore unveiled its plan to develop a dedicated autonomous vehicle (AV) corridor within its central business district. This initiative is the driving factor this market.
                • part of Singapore Smart Nation program is the driving factor this market.
                • aims to create a seamless environment for autonomous buses and shuttles to operate in mixed traffic alongside traditional vehicles. The corridor will feature advanced infrastructure is the driving factor this market.
                • including smart traffic signals and sensors is the driving factor this market.
                • to support the safe and efficient movement of autonomous vehicles.Such developments in the field of autonomous vehicle corridors will fuel the growth of the global autonomous bus market during the forecast period. is the driving factor this market.

                The Autonomous Bus market vendors should focus on grabbing business opportunities from the Semi-autonomous segment as it accounted for the largest market share in the base year.