Blue Hydrogen Market Analysis North America, Europe, APAC, Middle East and Africa, South America - US, China, Germany, UK, France - Size and Forecast 2024-2028

Blue Hydrogen Market Analysis North America, Europe, APAC, Middle East and Africa, South America - US, China, Germany, UK, France - Size and Forecast 2024-2028

Published: Feb 2024 172 Pages SKU: IRTNTR77648

Market Overview at a Glance

$16.06 B
Market Opportunity
13.75%
CAGR
13.55
YoY growth 2023-2024(%)

Blue Hydrogen Market Size 2024-2028 

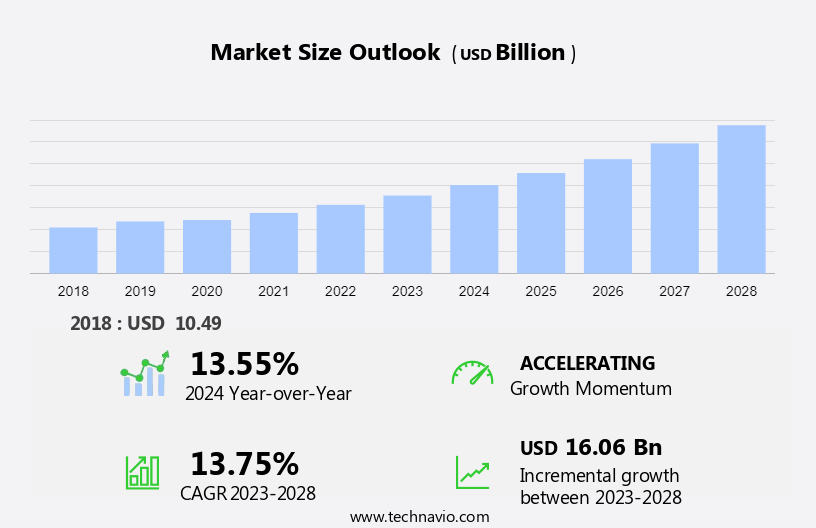
The blue hydrogen market size is forecast to increase by USD 16.06 billion at a CAGR of 13.75% between 2023 and 2028. The market is experiencing significant growth due to several key drivers. Heavy industries are increasingly turning to hydrogen as a cleaner alternative to traditional fossil fuels for processes such as hydrogen blending in natural gas networks and chemical production. Environmental regulations are pushing for decarbonization, making hydrogen an attractive option for reducing carbon emissions. However, the high costs associated with producing blue hydrogen through Steam Methane Reforming (SMR) from natural gas remain a challenge. The hydrogen-based economy is gaining traction as a viable solution for reducing greenhouse gas emissions and transitioning away from traditional energy sources. As the focus on clean energy continues to grow, the market for blue hydrogen is expected to expand, providing opportunities for growth in the chemical and industrial sectors.

Blue Hydrogen Market Size

 Request Free Sample

The blue hydrogen market is experiencing significant growth as this low-carbon transportation fuel gains traction in various sectors, including petroleum refineries, transportation, and power generation. Hydrogen-based fuels are becoming increasingly popular as the world transitions towards sustainable energy sources and decarbonization. Petroleum refineries are integrating hydrogen into their processes to reduce carbon emissions. Hydrogen can be used in refineries for synfuel production, ammonia production, and methanol production, thereby enhancing their overall efficiency and sustainability. Moreover, hydrogen can help refineries meet environmental regulations and emissions targets. In the transportation sector, hydrogen is gaining momentum as a clean fuel for fuel cell electric vehicles (FCEVs).

Additionally, the establishment of hydrogen refueling stations is essential for the widespread adoption of FCEVs. These stations will enable long-range travel and faster refueling times compared to battery electric vehicles. Power generation is another sector that can benefit significantly from hydrogen. Hydrogen can be used in combined heat and power (CHP) systems and power generation plants to produce electricity with minimal carbon emissions. Additionally, hydrogen can be used in natural gas networks as a clean-burning fuel, reducing the carbon footprint of the energy sector. The shift towards hydrogen-based fuels is driven by the need to decarbonize industries and reduce carbon emissions.

Further, carbon pricing, direct air capture, and sustainable practices are some of the initiatives being implemented to achieve this goal. Hydrogen can help industries meet their emissions targets while maintaining their operations, making it an attractive alternative to fossil fuels. The blue hydrogen market is expected to grow as more industries adopt this clean fuel. Hydrogen can be used in various industrial processes, including steel production and chemical manufacturing, to reduce carbon emissions. Furthermore, hydrogen can be used as a feedstock in the production of ammonia and methanol, which are essential chemicals in various industries. In conclusion, the blue hydrogen market is poised for growth as it offers a viable solution for reducing carbon emissions in various sectors. Hydrogen can help petroleum refineries, transportation, and power generation industries meet their decarbonization targets while maintaining their operations. The establishment of hydrogen refueling stations and the integration of hydrogen into industrial processes will further accelerate the growth of the market.

Market Segmentation

The market research report provides comprehensive data (region-wise segment analysis), with forecasts and estimates in "USD billion" for the period 2024-2028, as well as historical data from 2018-2022 for the following segments.

  • Technology
    • Steam methane reforming
    • Gas partial oxidation
    • Auto thermal reforming
  • End-user
    • Petroleum refinery
    • Chemical industry
    • Power generation
    • Others
  • Geography
    • North America
      • US
    • Europe
      • Germany
      • UK
      • France
    • APAC
      • China
    • Middle East and Africa
    • South America

By Technology Insights

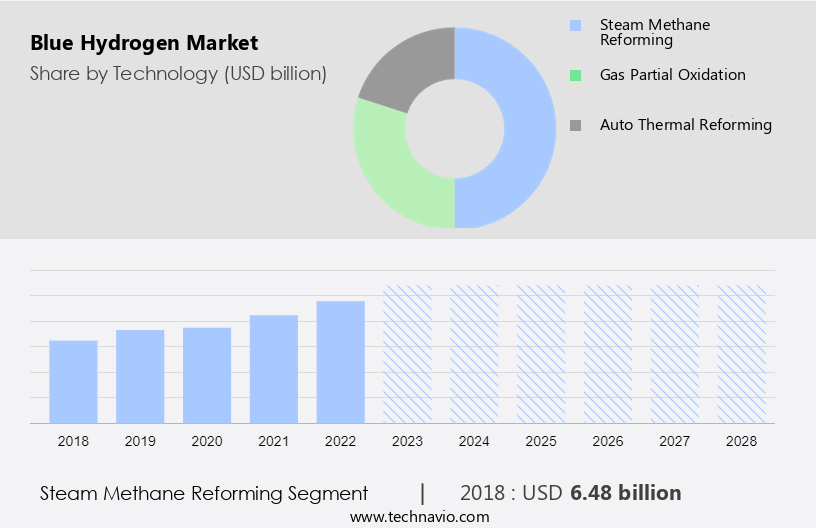
The steam methane reforming segment is estimated to witness significant growth during the forecast period. Steam methane reforming (SMR) is a process that converts natural gas into methane through the application of steam and a catalyst, typically made up of copper, nickel, and zinc. The resulting reaction produces hydrocarbon gases, including hydrogen, carbon monoxide, and water. The carbon monoxide is subsequently converted into carbon dioxide, releasing more hydrogen as a byproduct. This hydrogen, known as "blue hydrogen," is produced with lower carbon emissions and at a more affordable cost compared to gas partial oxidation and auto thermal reforming. For instance, Canada generates approximately 2-3 million tons of hydrogen annually through the SMR process of natural gas.

Carbon capture storage (CCS) technology is often employed in conjunction with blue hydrogen production to further reduce emissions. Synfuels, such as ammonia and methanol, can also be produced using blue hydrogen as a feedstock, contributing to sustainable practices within the petroleum refinery industry.

Blue Hydrogen Market Size

Get a glance at the market share of various segments Request Free Sample

The steam methane reforming segment accounted for USD 6.48 billion in 2018 and showed a gradual increase during the forecast period.

Regional Insights

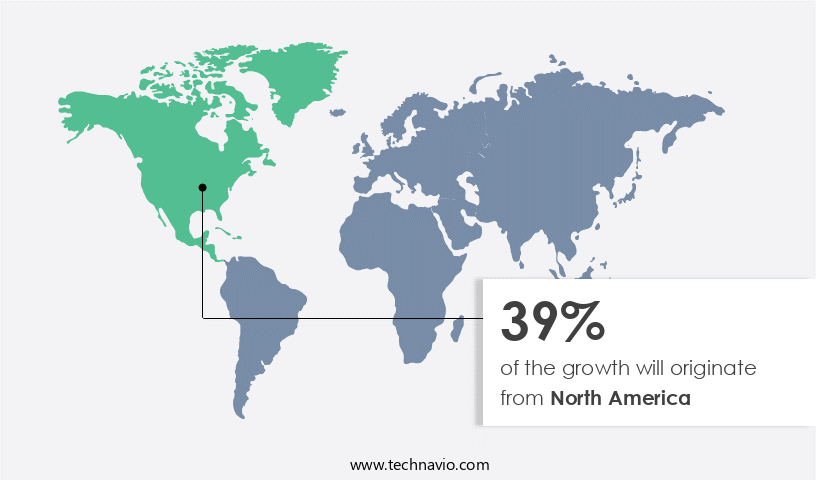
North America is estimated to contribute 39% to the growth of the global market during the forecast period. Technavio's analysts have elaborately explained the regional trends and drivers that shape the market during the forecast period.

Blue Hydrogen Market Share by Geography

For more insights on the market share of various regions Request Free Sample

Blue hydrogen is gaining traction as a low-carbon alternative to traditional hydrogen production methods in various industries across North America. Key players like Air Products are leading the charge in this space, utilizing renewable energy initiatives to produce industrial gases more sustainably. The US and Canada are at the forefront of this market, with the US accounting for a significant portion due to government incentives and industrial demand. Sectors such as chemical, fertilizer, refinery, fuel cell, and metal processing are expected to drive the growth of the market in North America.

Further, in the transportation sector, the US is a major player, with a focus on fuel-cell electric vehicles (FCEVs), fuel-cell electric buses, and material-handling vehicles. The adoption of blue hydrogen is not only environmentally friendly but also economically viable, making it an attractive option for industries looking to reduce their carbon footprint. The North American market is projected to expand steadily during the forecast period, driven by these factors.

Our researchers analyzed the data with 2023 as the base year, along with the key drivers, trends, and challenges. A holistic analysis of drivers will help companies refine their marketing strategies to gain a competitive advantage.

Market Driver

Increasing government focus on adoption of clean hydrogen is the key driver of the market. Blue hydrogen, derived from petroleum refineries, is gaining significant attention as a low-carbon transportation fuel and for power generation. Fossil fuels continue to dominate the energy sector, and blue hydrogen, produced through steam methane reforming with captured carbon dioxide, offers a potential solution to reduce carbon emissions. The market for hydrogen-based fuels is witnessing growth due to increasing government initiatives and policies. For instance, the European Union's Hydrogen Strategy aims to create a clean hydrogen market and promote the production of blue hydrogen using renewable energy sources. In July 2020, the European Commission established the European Clean Hydrogen Alliance, which includes approximately 1,700 participants from various sectors, to foster the development of a European hydrogen sector and encourage the use of clean hydrogen for a sustainable transition.

The alliance's goal is to make hydrogen a viable alternative to traditional fossil fuels in transportation and power generation. Blue hydrogen's potential as a low-carbon fuel for transportation and power generation is driving the growth of refueling stations and hydrogen production facilities. The increasing demand for hydrogen as a fuel source is expected to create new opportunities for market participants and investors. According to recent market research, The market is projected to grow at a steady pace in the coming years. Key players in the market include major energy companies, technology providers, and infrastructure developers.

Market Trends

Growing adoption of fuel cell-powered vehicles is the upcoming trend in the market. The transport sector in the United States accounted for approximately 25-30% of the country's total CO2 emissions in 2021, primarily due to the combustion of fossil fuels. Among this, around 75% of the CO2 emissions from the transport sector originated from road vehicles, including cars, trucks, buses, and two-wheelers. In response to growing environmental concerns and stringent regulations, there is a significant shift towards sustainable technologies in the transport sector. One such technology gaining widespread adoption is fuel cells. Fuel cells are an emerging solution in the transport sector, with various original equipment manufacturers (OEMs) in the electric vehicle (EV) and material-handling equipment industries adopting this technology.

Fuel cells offer extended range and/or propulsive power to vehicles such as material-handling equipment, fuel cell electric vehicles (FCEVs), trucks, buses, trains, and autonomous vehicles. The hydrogen required for fuel cells is primarily produced through Steam Methane Reforming (SMR) in heavy industries. The hydrogen produced is then blended into natural gas networks, facilitating the transition towards a hydrogen-based economy. This decarbonization process is crucial for reducing greenhouse gas emissions and meeting environmental regulations. The adoption of fuel cells in the transport sector is expected to significantly contribute to the reduction of CO2 emissions and the promotion of a sustainable future.

Market Challenge

High costs associated with production of blue hydrogen is a key challenge affecting the market growth. Blue hydrogen, produced through water electrolysis with natural gas and carbon capture utilization, functions as a synthetic energy carrier in the transition towards net zero emissions. The production costs for blue hydrogen vary significantly, with estimates ranging from USD 1 to USD 4 per kilogram. This economic infeasibility is primarily due to the substantial capital expenditure (CAPEX) required for the production equipment. Key components of blue hydrogen production include the reformer unit, steam turbine, balance of plant, and other technology-specific units, such as steam methane reforming (SMR) and autothermal reforming (ATR). Renewable electricity procurement costs also contribute to the overall production cost.

In the UK, for instance, blue hydrogen production costs were approximately 35%-40% higher than anticipated prices in 2021. Energy efficiency and low-carbon technologies are crucial in reducing energy losses and greenhouse emissions associated with blue hydrogen production. Enhancing the efficiency of hydrogen refueling stations and optimizing the production process can help mitigate these concerns and make blue hydrogen a more economically attractive option for the energy sector.

Exclusive Customer Landscape

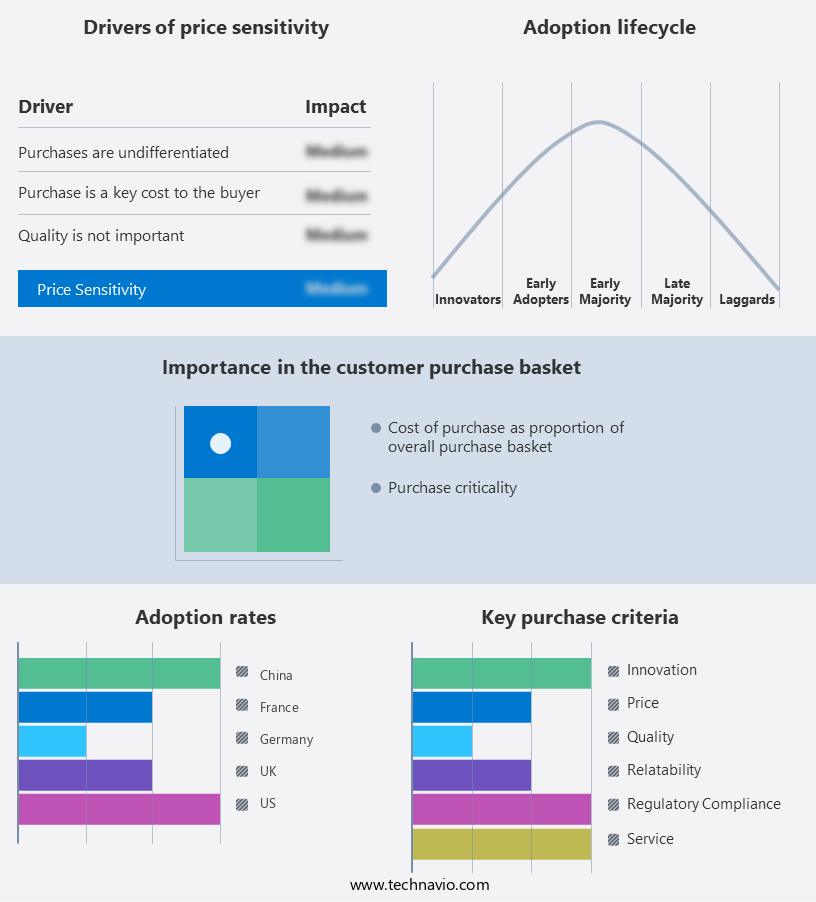
The market forecasting report includes the adoption lifecycle of the market, covering from the innovator's stage to the laggard's stage. It focuses on adoption rates in different regions based on penetration. Furthermore, the report also includes key purchase criteria and drivers of price sensitivity to help companies evaluate and develop their market growth analysis strategies.

Blue Hydrogen Market Share by Geography

 Customer Landscape

Key Companies & Market Insights

Companies are implementing various strategies, such as strategic alliances, partnerships, mergers and acquisitions, geographical expansion, and product/service launches, to enhance their presence in the market.

Air Liquide SA: The company offers blue hydrogen that can be used in fuel cells to generate heat and electricity, and it is also a useful raw material for many industrial sectors.

The market research and growth report includes detailed analyses of the competitive landscape of the market and information about key companies, including:

  • Air Products and Chemicals Inc.
  • Ceres Power Holdings plc
  • CERTIFHY CONSORTIUM
  • Chart Industries Inc.
  • Cummins Inc.
  • Equinor ASA
  • Exxon Mobil Corp.
  • Iwatani Corp.
  • Linde Plc
  • Messer SE and Co. KGaA
  • Mitsubishi Corp.
  • Nel ASA
  • Orsted AS
  • Shell plc
  • Siemens AG
  • Uniper SE

Qualitative and quantitative analysis of companies has been conducted to help clients understand the wider business environment as well as the strengths and weaknesses of key market players. Data is qualitatively analyzed to categorize companies as pure play, category-focused, industry-focused, and diversified; it is quantitatively analyzed to categorize companies as dominant, leading, strong, tentative, and weak.

Research Analyst Overview

Hydrogen is gaining significant attention as a low-carbon transportation fuel and a synthetic energy carrier for power generation. Petroleum refineries are exploring the production of hydrogen through various methods such as steam methane reforming, auto thermal reforming, and water electrolysis to reduce their carbon footprint and meet emissions targets. Hydrogen refueling stations are being established to cater to the growing demand for hydrogen-based fuels in transportation. The power generation sector is also embracing hydrogen as a clean energy source, with hydrogen-based fuels offering net zero emissions and high energy efficiency. The use of hydrogen in industrial processes, including chemical production, synfuel production, ammonia production, and methanol production, is expected to increase as part of the transition to a hydrogen-based economy.

Further, heavy industries are also turning to hydrogen as a low-carbon alternative to fossil fuels for decarbonization. Hydrogen blending in natural gas networks is another approach to reduce carbon emissions in the energy sector. Environmental regulations and emissions targets are driving the adoption of low-carbon technologies and sustainable practices in the production of hydrogen. The fueling segment of the hydrogen market is expected to grow significantly as the clean hydrogen economy gains momentum. The production methods for hydrogen, including methane reforming and water electrolysis, are being optimized for energy efficiency and reduced energy losses. The integration of renewable energy initiatives and carbon capture storage is also crucial for the sustainable production of hydrogen.

Additionally, the transition to a hydrogen-based economy offers significant potential for reducing carbon emissions and mitigating climate change. The use of hydrogen as a clean fuel in transportation and industrial processes is a key component of the clean energy transition. The adoption of low-carbon hydrogen production methods and sustainable practices is essential for the long-term success of the market.

Market Scope

Report Coverage

Details

Page number

172

Base year

2023

Historic period

2018-2022

Forecast period

2024-2028

Growth momentum & CAGR

Accelerate at a CAGR of 13.75%

Market growth 2024-2028

USD 16.06 billion

Market structure

Fragmented

YoY growth 2023-2024(%)

13.55

Regional analysis

North America, Europe, APAC, Middle East and Africa, and South America

Performing market contribution

North America at 39%

Key countries

US, China, Germany, UK, and France

Competitive landscape

Leading Companies, Market Positioning of Companies, Competitive Strategies, and Industry Risks

Key companies profiled

Air Liquide SA, Air Products and Chemicals Inc., Ceres Power Holdings plc, CERTIFHY CONSORTIUM, Chart Industries Inc., Cummins Inc., Equinor ASA, Exxon Mobil Corp., Iwatani Corp., Linde Plc, Messer SE and Co. KGaA, Mitsubishi Corp., Nel ASA, Orsted AS, Shell plc, Siemens AG, and Uniper SE

Market dynamics

Parent market analysis, market growth inducers and obstacles, market forecast, fast-growing and slow-growing segment analysis, COVID-19 impact and recovery analysis and future consumer dynamics, market condition analysis for the forecast period

Customization purview

If our market report has not included the data that you are looking for, you can reach out to our analysts and get segments customized.

Request Free Sample

What are the Key Data Covered in this Market Research and Growth Report?

  • CAGR of the market during the forecast period
  • Detailed information on factors that will drive the market growth and forecasting between 2024 and 2028
  • Precise estimation of the size of the market  and its contribution of the market in focus to the parent market
  • Accurate predictions about upcoming market growth and trends and changes in consumer behaviour
  • Growth of the market across North America, Europe, APAC, Middle East and Africa, and South America
  • Thorough analysis of the market's competitive landscape and detailed information about companies
  • Comprehensive analysis of factors that will challenge the growth of market companies

We can help! Our analysts can customize this market research report to meet your requirements. Get in touch

1 Executive Summary

  • 1.1 Market overview
    • Exhibit 01: Executive Summary – Chart on Market Overview
    • Exhibit 02: Executive Summary – Data Table on Market Overview
    • Exhibit 03: Executive Summary – Chart on Global Market Characteristics
    • Exhibit 04: Executive Summary – Chart on Market by Geography
    • Exhibit 05: Executive Summary – Chart on Market Segmentation by Technology
    • Exhibit 06: Executive Summary – Chart on Market Segmentation by End-user
    • Exhibit 07: Executive Summary – Chart on Incremental Growth
    • Exhibit 08: Executive Summary – Data Table on Incremental Growth
    • Exhibit 09: Executive Summary – Chart on Vendor Market Positioning

2 Market Landscape

  • 2.1 Market ecosystem
    • Exhibit 10: Parent market
    • Exhibit 11: Market Characteristics

3 Market Sizing

  • 3.1 Market definition
    • Exhibit 12: Offerings of vendors included in the market definition
  • 3.2 Market segment analysis
    • Exhibit 13: Market segments
  • 3.3 Market size 2023
    • 3.4 Market outlook: Forecast for 2023-2028
      • Exhibit 14: Chart on Global - Market size and forecast 2023-2028 ($ billion)
      • Exhibit 15: Data Table on Global - Market size and forecast 2023-2028 ($ billion)
      • Exhibit 16: Chart on Global Market: Year-over-year growth 2023-2028 (%)
      • Exhibit 17: Data Table on Global Market: Year-over-year growth 2023-2028 (%)

    4 Historic Market Size

    • 4.1 Global blue hydrogen market 2018 - 2022
      • Exhibit 18: Historic Market Size – Data Table on global blue hydrogen market 2018 - 2022 ($ billion)
    • 4.2 Technology Segment Analysis 2018 - 2022
      • Exhibit 19: Historic Market Size – Technology Segment 2018 - 2022 ($ billion)
    • 4.3 End-user Segment Analysis 2018 - 2022
      • Exhibit 20: Historic Market Size – End-user Segment 2018 - 2022 ($ billion)
    • 4.4 Geography Segment Analysis 2018 - 2022
      • Exhibit 21: Historic Market Size – Geography Segment 2018 - 2022 ($ billion)
    • 4.5 Country Segment Analysis 2018 - 2022
      • Exhibit 22: Historic Market Size – Country Segment 2018 - 2022 ($ billion)

    5 Five Forces Analysis

    • 5.1 Five forces summary
      • Exhibit 23: Five forces analysis - Comparison between 2023 and 2028
    • 5.2 Bargaining power of buyers
      • Exhibit 24: Chart on Bargaining power of buyers – Impact of key factors 2023 and 2028
    • 5.3 Bargaining power of suppliers
      • Exhibit 25: Bargaining power of suppliers – Impact of key factors in 2023 and 2028
    • 5.4 Threat of new entrants
      • Exhibit 26: Threat of new entrants – Impact of key factors in 2023 and 2028
    • 5.5 Threat of substitutes
      • Exhibit 27: Threat of substitutes – Impact of key factors in 2023 and 2028
    • 5.6 Threat of rivalry
      • Exhibit 28: Threat of rivalry – Impact of key factors in 2023 and 2028
    • 5.7 Market condition
      • Exhibit 29: Chart on Market condition - Five forces 2023 and 2028

    6 Market Segmentation by Technology

    • 6.1 Market segments
      • Exhibit 30: Chart on Technology - Market share 2023-2028 (%)
      • Exhibit 31: Data Table on Technology - Market share 2023-2028 (%)
    • 6.2 Comparison by Technology
      • Exhibit 32: Chart on Comparison by Technology
      • Exhibit 33: Data Table on Comparison by Technology
    • 6.3 Steam methane reforming - Market size and forecast 2023-2028
      • Exhibit 34: Chart on Steam methane reforming - Market size and forecast 2023-2028 ($ billion)
      • Exhibit 35: Data Table on Steam methane reforming - Market size and forecast 2023-2028 ($ billion)
      • Exhibit 36: Chart on Steam methane reforming - Year-over-year growth 2023-2028 (%)
      • Exhibit 37: Data Table on Steam methane reforming - Year-over-year growth 2023-2028 (%)
    • 6.4 Gas partial oxidation - Market size and forecast 2023-2028
      • Exhibit 38: Chart on Gas partial oxidation - Market size and forecast 2023-2028 ($ billion)
      • Exhibit 39: Data Table on Gas partial oxidation - Market size and forecast 2023-2028 ($ billion)
      • Exhibit 40: Chart on Gas partial oxidation - Year-over-year growth 2023-2028 (%)
      • Exhibit 41: Data Table on Gas partial oxidation - Year-over-year growth 2023-2028 (%)
    • 6.5 Auto thermal reforming - Market size and forecast 2023-2028
      • Exhibit 42: Chart on Auto thermal reforming - Market size and forecast 2023-2028 ($ billion)
      • Exhibit 43: Data Table on Auto thermal reforming - Market size and forecast 2023-2028 ($ billion)
      • Exhibit 44: Chart on Auto thermal reforming - Year-over-year growth 2023-2028 (%)
      • Exhibit 45: Data Table on Auto thermal reforming - Year-over-year growth 2023-2028 (%)
    • 6.6 Market opportunity by Technology
      • Exhibit 46: Market opportunity by Technology ($ billion)
      • Exhibit 47: Data Table on Market opportunity by Technology ($ billion)

    7 Market Segmentation by End-user

    • 7.1 Market segments
      • Exhibit 48: Chart on End-user - Market share 2023-2028 (%)
      • Exhibit 49: Data Table on End-user - Market share 2023-2028 (%)
    • 7.2 Comparison by End-user
      • Exhibit 50: Chart on Comparison by End-user
      • Exhibit 51: Data Table on Comparison by End-user
    • 7.3 Petroleum refinery - Market size and forecast 2023-2028
      • Exhibit 52: Chart on Petroleum refinery - Market size and forecast 2023-2028 ($ billion)
      • Exhibit 53: Data Table on Petroleum refinery - Market size and forecast 2023-2028 ($ billion)
      • Exhibit 54: Chart on Petroleum refinery - Year-over-year growth 2023-2028 (%)
      • Exhibit 55: Data Table on Petroleum refinery - Year-over-year growth 2023-2028 (%)
    • 7.4 Chemical industry - Market size and forecast 2023-2028
      • Exhibit 56: Chart on Chemical industry - Market size and forecast 2023-2028 ($ billion)
      • Exhibit 57: Data Table on Chemical industry - Market size and forecast 2023-2028 ($ billion)
      • Exhibit 58: Chart on Chemical industry - Year-over-year growth 2023-2028 (%)
      • Exhibit 59: Data Table on Chemical industry - Year-over-year growth 2023-2028 (%)
    • 7.5 Power generation - Market size and forecast 2023-2028
      • Exhibit 60: Chart on Power generation - Market size and forecast 2023-2028 ($ billion)
      • Exhibit 61: Data Table on Power generation - Market size and forecast 2023-2028 ($ billion)
      • Exhibit 62: Chart on Power generation - Year-over-year growth 2023-2028 (%)
      • Exhibit 63: Data Table on Power generation - Year-over-year growth 2023-2028 (%)
    • 7.6 Others - Market size and forecast 2023-2028
      • Exhibit 64: Chart on Others - Market size and forecast 2023-2028 ($ billion)
      • Exhibit 65: Data Table on Others - Market size and forecast 2023-2028 ($ billion)
      • Exhibit 66: Chart on Others - Year-over-year growth 2023-2028 (%)
      • Exhibit 67: Data Table on Others - Year-over-year growth 2023-2028 (%)
    • 7.7 Market opportunity by End-user
      • Exhibit 68: Market opportunity by End-user ($ billion)
      • Exhibit 69: Data Table on Market opportunity by End-user ($ billion)

    8 Customer Landscape

    • 8.1 Customer landscape overview
      • Exhibit 70: Analysis of price sensitivity, lifecycle, customer purchase basket, adoption rates, and purchase criteria

    9 Geographic Landscape

    • 9.1 Geographic segmentation
      • Exhibit 71: Chart on Market share by geography 2023-2028 (%)
      • Exhibit 72: Data Table on Market share by geography 2023-2028 (%)
    • 9.2 Geographic comparison
      • Exhibit 73: Chart on Geographic comparison
      • Exhibit 74: Data Table on Geographic comparison
    • 9.3 North America - Market size and forecast 2023-2028
      • Exhibit 75: Chart on North America - Market size and forecast 2023-2028 ($ billion)
      • Exhibit 76: Data Table on North America - Market size and forecast 2023-2028 ($ billion)
      • Exhibit 77: Chart on North America - Year-over-year growth 2023-2028 (%)
      • Exhibit 78: Data Table on North America - Year-over-year growth 2023-2028 (%)
    • 9.4 Europe - Market size and forecast 2023-2028
      • Exhibit 79: Chart on Europe - Market size and forecast 2023-2028 ($ billion)
      • Exhibit 80: Data Table on Europe - Market size and forecast 2023-2028 ($ billion)
      • Exhibit 81: Chart on Europe - Year-over-year growth 2023-2028 (%)
      • Exhibit 82: Data Table on Europe - Year-over-year growth 2023-2028 (%)
    • 9.5 APAC - Market size and forecast 2023-2028
      • Exhibit 83: Chart on APAC - Market size and forecast 2023-2028 ($ billion)
      • Exhibit 84: Data Table on APAC - Market size and forecast 2023-2028 ($ billion)
      • Exhibit 85: Chart on APAC - Year-over-year growth 2023-2028 (%)
      • Exhibit 86: Data Table on APAC - Year-over-year growth 2023-2028 (%)
    • 9.6 Middle East and Africa - Market size and forecast 2023-2028
      • Exhibit 87: Chart on Middle East and Africa - Market size and forecast 2023-2028 ($ billion)
      • Exhibit 88: Data Table on Middle East and Africa - Market size and forecast 2023-2028 ($ billion)
      • Exhibit 89: Chart on Middle East and Africa - Year-over-year growth 2023-2028 (%)
      • Exhibit 90: Data Table on Middle East and Africa - Year-over-year growth 2023-2028 (%)
    • 9.7 South America - Market size and forecast 2023-2028
      • Exhibit 91: Chart on South America - Market size and forecast 2023-2028 ($ billion)
      • Exhibit 92: Data Table on South America - Market size and forecast 2023-2028 ($ billion)
      • Exhibit 93: Chart on South America - Year-over-year growth 2023-2028 (%)
      • Exhibit 94: Data Table on South America - Year-over-year growth 2023-2028 (%)
    • 9.8 US - Market size and forecast 2023-2028
      • Exhibit 95: Chart on US - Market size and forecast 2023-2028 ($ billion)
      • Exhibit 96: Data Table on US - Market size and forecast 2023-2028 ($ billion)
      • Exhibit 97: Chart on US - Year-over-year growth 2023-2028 (%)
      • Exhibit 98: Data Table on US - Year-over-year growth 2023-2028 (%)
    • 9.9 China - Market size and forecast 2023-2028
      • Exhibit 99: Chart on China - Market size and forecast 2023-2028 ($ billion)
      • Exhibit 100: Data Table on China - Market size and forecast 2023-2028 ($ billion)
      • Exhibit 101: Chart on China - Year-over-year growth 2023-2028 (%)
      • Exhibit 102: Data Table on China - Year-over-year growth 2023-2028 (%)
    • 9.10 Germany - Market size and forecast 2023-2028
      • Exhibit 103: Chart on Germany - Market size and forecast 2023-2028 ($ billion)
      • Exhibit 104: Data Table on Germany - Market size and forecast 2023-2028 ($ billion)
      • Exhibit 105: Chart on Germany - Year-over-year growth 2023-2028 (%)
      • Exhibit 106: Data Table on Germany - Year-over-year growth 2023-2028 (%)
    • 9.11 UK - Market size and forecast 2023-2028
      • Exhibit 107: Chart on UK - Market size and forecast 2023-2028 ($ billion)
      • Exhibit 108: Data Table on UK - Market size and forecast 2023-2028 ($ billion)
      • Exhibit 109: Chart on UK - Year-over-year growth 2023-2028 (%)
      • Exhibit 110: Data Table on UK - Year-over-year growth 2023-2028 (%)
    • 9.12 France - Market size and forecast 2023-2028
      • Exhibit 111: Chart on France - Market size and forecast 2023-2028 ($ billion)
      • Exhibit 112: Data Table on France - Market size and forecast 2023-2028 ($ billion)
      • Exhibit 113: Chart on France - Year-over-year growth 2023-2028 (%)
      • Exhibit 114: Data Table on France - Year-over-year growth 2023-2028 (%)
    • 9.13 Market opportunity by geography
      • Exhibit 115: Market opportunity by geography ($ billion)
      • Exhibit 116: Data Tables on Market opportunity by geography ($ billion)

    10 Drivers, Challenges, and Trends

    • 10.1 Market drivers
      • 10.2 Market challenges
        • 10.3 Impact of drivers and challenges
          • Exhibit 117: Impact of drivers and challenges in 2023 and 2028
        • 10.4 Market trends

          11 Vendor Landscape

          • 11.1 Overview
            • 11.2 Vendor landscape
              • Exhibit 118: Overview on Criticality of inputs and Factors of differentiation
            • 11.3 Landscape disruption
              • Exhibit 119: Overview on factors of disruption
            • 11.4 Industry risks
              • Exhibit 120: Impact of key risks on business

            12 Vendor Analysis

            • 12.1 Vendors covered
              • Exhibit 121: Vendors covered
            • 12.2 Market positioning of vendors
              • Exhibit 122: Matrix on vendor position and classification
            • 12.3 Air Liquide SA
              • Exhibit 123: Air Liquide SA - Overview
              • Exhibit 124: Air Liquide SA - Business segments
              • Exhibit 125: Air Liquide SA - Key news
              • Exhibit 126: Air Liquide SA - Key offerings
              • Exhibit 127: Air Liquide SA - Segment focus
            • 12.4 Air Products and Chemicals Inc.
              • Exhibit 128: Air Products and Chemicals Inc. - Overview
              • Exhibit 129: Air Products and Chemicals Inc. - Business segments
              • Exhibit 130: Air Products and Chemicals Inc. - Key news
              • Exhibit 131: Air Products and Chemicals Inc. - Key offerings
              • Exhibit 132: Air Products and Chemicals Inc. - Segment focus
            • 12.5 Ceres Power Holdings plc
              • Exhibit 133: Ceres Power Holdings plc - Overview
              • Exhibit 134: Ceres Power Holdings plc - Business segments
              • Exhibit 135: Ceres Power Holdings plc - Key news
              • Exhibit 136: Ceres Power Holdings plc - Key offerings
              • Exhibit 137: Ceres Power Holdings plc - Segment focus
            • 12.6 Chart Industries Inc.
              • Exhibit 138: Chart Industries Inc. - Overview
              • Exhibit 139: Chart Industries Inc. - Business segments
              • Exhibit 140: Chart Industries Inc. - Key news
              • Exhibit 141: Chart Industries Inc. - Key offerings
              • Exhibit 142: Chart Industries Inc. - Segment focus
            • 12.7 Equinor ASA
              • Exhibit 143: Equinor ASA - Overview
              • Exhibit 144: Equinor ASA - Business segments
              • Exhibit 145: Equinor ASA - Key offerings
              • Exhibit 146: Equinor ASA - Segment focus
            • 12.8 Exxon Mobil Corp.
              • Exhibit 147: Exxon Mobil Corp. - Overview
              • Exhibit 148: Exxon Mobil Corp. - Business segments
              • Exhibit 149: Exxon Mobil Corp. - Key news
              • Exhibit 150: Exxon Mobil Corp. - Key offerings
              • Exhibit 151: Exxon Mobil Corp. - Segment focus
            • 12.9 Iwatani Corp.
              • Exhibit 152: Iwatani Corp. - Overview
              • Exhibit 153: Iwatani Corp. - Business segments
              • Exhibit 154: Iwatani Corp. - Key offerings
              • Exhibit 155: Iwatani Corp. - Segment focus
            • 12.10 Linde Plc
              • Exhibit 156: Linde Plc - Overview
              • Exhibit 157: Linde Plc - Business segments
              • Exhibit 158: Linde Plc - Key news
              • Exhibit 159: Linde Plc - Key offerings
              • Exhibit 160: Linde Plc - Segment focus
            • 12.11 Messer SE and Co. KGaA
              • Exhibit 161: Messer SE and Co. KGaA - Overview
              • Exhibit 162: Messer SE and Co. KGaA - Product / Service
              • Exhibit 163: Messer SE and Co. KGaA - Key offerings
            • 12.12 Mitsubishi Corp.
              • Exhibit 164: Mitsubishi Corp. - Overview
              • Exhibit 165: Mitsubishi Corp. - Business segments
              • Exhibit 166: Mitsubishi Corp. - Key news
              • Exhibit 167: Mitsubishi Corp. - Key offerings
              • Exhibit 168: Mitsubishi Corp. - Segment focus
            • 12.13 Nel ASA
              • Exhibit 169: Nel ASA - Overview
              • Exhibit 170: Nel ASA - Business segments
              • Exhibit 171: Nel ASA - Key offerings
              • Exhibit 172: Nel ASA - Segment focus
            • 12.14 Orsted AS
              • Exhibit 173: Orsted AS - Overview
              • Exhibit 174: Orsted AS - Product / Service
              • Exhibit 175: Orsted AS - Key news
              • Exhibit 176: Orsted AS - Key offerings
            • 12.15 Shell plc
              • Exhibit 177: Shell plc - Overview
              • Exhibit 178: Shell plc - Business segments
              • Exhibit 179: Shell plc - Key news
              • Exhibit 180: Shell plc - Key offerings
              • Exhibit 181: Shell plc - Segment focus
            • 12.16 Siemens AG
              • Exhibit 182: Siemens AG - Overview
              • Exhibit 183: Siemens AG - Business segments
              • Exhibit 184: Siemens AG - Key news
              • Exhibit 185: Siemens AG - Key offerings
              • Exhibit 186: Siemens AG - Segment focus
            • 12.17 Uniper SE
              • Exhibit 187: Uniper SE - Overview
              • Exhibit 188: Uniper SE - Business segments
              • Exhibit 189: Uniper SE - Key offerings
              • Exhibit 190: Uniper SE - Segment focus

            13 Appendix

            • 13.1 Scope of the report
              • 13.2 Inclusions and exclusions checklist
                • Exhibit 191: Inclusions checklist
                • Exhibit 192: Exclusions checklist
              • 13.3 Currency conversion rates for US$
                • Exhibit 193: Currency conversion rates for US$
              • 13.4 Research methodology
                • Exhibit 194: Research methodology
                • Exhibit 195: Validation techniques employed for market sizing
                • Exhibit 196: Information sources
              • 13.5 List of abbreviations
                • Exhibit 197: List of abbreviations

              Research Methodology

              Technavio presents a detailed picture of the market by way of study, synthesis, and summation of data from multiple sources. The analysts have presented the various facets of the market with a particular focus on identifying the key industry influencers. The data thus presented is comprehensive, reliable, and the result of extensive research, both primary and secondary.

              INFORMATION SOURCES

              Primary sources

              • Manufacturers and suppliers
              • Channel partners
              • Industry experts
              • Strategic decision makers

              Secondary sources

              • Industry journals and periodicals
              • Government data
              • Financial reports of key industry players
              • Historical data
              • Press releases

              DATA ANALYSIS

              Data Synthesis

              • Collation of data
              • Estimation of key figures
              • Analysis of derived insights

              Data Validation

              • Triangulation with data models
              • Reference against proprietary databases
              • Corroboration with industry experts

              REPORT WRITING

              Qualitative

              • Market drivers
              • Market challenges
              • Market trends
              • Five forces analysis

              Quantitative

              • Market size and forecast
              • Market segmentation
              • Geographical insights
              • Competitive landscape

              Interested in this report?

              Get your sample now to see our research methodology and insights!

              Download Now

              Frequently Asked Questions

              Blue Hydrogen market growth will increase by $ 16.06 bn during 2024-2028.

              The Blue Hydrogen market is expected to grow at a CAGR of 13.75% during 2024-2028.

              Blue Hydrogen market is segmented by Technology( Steam methane reforming, Gas partial oxidation, Auto thermal reforming) End-user( Petroleum refinery, Chemical industry, Power generation, Others)

              Air Liquide SA, Air Products and Chemicals Inc., Ceres Power Holdings plc, CERTIFHY CONSORTIUM, Chart Industries Inc., Cummins Inc., Equinor ASA, Exxon Mobil Corp., Iwatani Corp., Linde Plc, Messer SE and Co. KGaA, Mitsubishi Corp., Nel ASA, Orsted AS, Shell plc, Siemens AG, Uniper SE are a few of the key vendors in the Blue Hydrogen market.

              North America will register the highest growth rate of 39% among the other regions. Therefore, the Blue Hydrogen market in North America is expected to garner significant business opportunities for the vendors during the forecast period.

              US, China, Germany, UK, France

              • Increasing government focus on adoption of clean hydrogenGrowing government initiatives and policies play a pivotal role in shaping the trajectory of the global blue hydrogen market is the driving factor this market.
              • providing crucial support and direction for its growth. One notable example is the European Unions ambitious Hydrogen Strategy is the driving factor this market.
              • which aims to establish a clean hydrogen market and facilitate the production of blue hydrogen using renewable energy sources. In July 2020 is the driving factor this market.
              • the European Commission established the European Clean Hydrogen Alliance with the aim of fostering the development of a European hydrogen sector and promoting the utilization of clean hydrogen to facilitate Europes environmentally friendly transition. The alliance comprises approximately 1 is the driving factor this market.
              • 700 participants is the driving factor this market.
              • spanning industry is the driving factor this market.
              • civil society is the driving factor this market.
              • research organizations is the driving factor this market.
              • investors is the driving factor this market.
              • and public authorities. It encompasses every facet of the hydrogen value chain is the driving factor this market.
              • encompassing clean hydrogen generation and distribution to applications is the driving factor this market.
              • transportation is the driving factor this market.
              • energy is the driving factor this market.
              • and buildings. On the national level is the driving factor this market.
              • Germanys National Hydrogen Strategy is a comprehensive plan to advance hydrogen technologies is the driving factor this market.
              • with a focus on both domestic and international partnerships. The German government has allocated significant funding to support research is the driving factor this market.
              • development is the driving factor this market.
              • and the establishment of hydrogen infrastructure. Similarly is the driving factor this market.
              • Japan has been a pioneer in promoting hydrogen technologies through its Basic Hydrogen Strategy. Japan views hydrogen as a crucial means of decarbonizing its economy while simultaneously maintaining its industrial competitiveness. Hydrogen is one of the 14 sectors highlighted in the Green Growth Strategy for Achieving Carbon Neutrality by 2050 is the driving factor this market.
              • which was unveiled in December 2020 and is essential for Japan to fulfill its objectives. In a renewed commitment to hydrogen is the driving factor this market.
              • the Japanese government is the driving factor this market.
              • in June 2021 is the driving factor this market.
              • reinforced its green growth strategy by incorporating detailed action plans for priority sectors. In the US is the driving factor this market.
              • the Biden administrations focus on clean energy has led to the inclusion of hydrogen in the American Jobs Plan. The plan allocates substantial funds for the development and deployment of hydrogen technologies is the driving factor this market.
              • emphasizing the role of hydrogen in achieving climate goals and promoting job creation. Thus is the driving factor this market.
              • the increasing government focus on boosting hydrogen generation is expected to drive the growth of the market in focus during the forecast period. is the driving factor this market.

              The Blue Hydrogen market vendors should focus on grabbing business opportunities from the Steam methane reforming segment as it accounted for the largest market share in the base year.