
Canned Soups Market Size 2024-2028
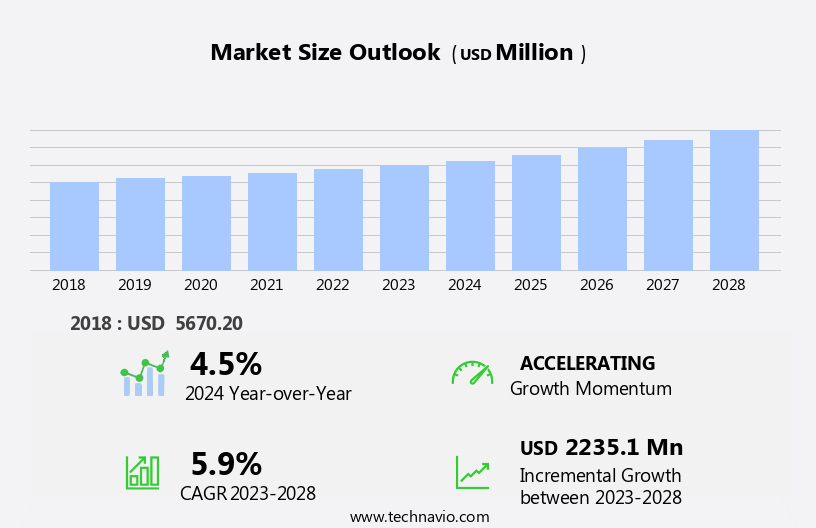
The canned soups market size is forecast to increase by USD 2.24 billion, at a CAGR of 5.9% between 2023 and 2028.
- The market is characterized by continuous investment in product innovation to cater to evolving consumer preferences and tastes soups. companies are focusing on introducing new flavors, organic options, and convenient packaging to attract a broader consumer base. However, product recalls due to contamination incidents pose a significant challenge to market growth. These incidents not only damage brand reputation but also raise concerns regarding food safety, potentially leading to decreased consumer trust and sales. As consumer health awareness increases, companies must prioritize stringent quality control measures to mitigate risks and maintain market position.
- Navigating this dynamic market requires strategic planning and a focus on product innovation while ensuring the highest standards of food safety. Companies that successfully balance these priorities will be well-positioned to capitalize on market opportunities and maintain a competitive edge.
What will be the Size of the Canned Soups Market during the forecast period?
Explore in-depth regional segment analysis with market size data - historical 2018-2022 and forecasts 2024-2028 - in the full report.
Request Free Sample
The market continues to evolve, driven by dynamic market forces and advancements in technology. Manufacturers employ cost optimization strategies, integrating thermal sterilization methods such as high-pressure processing to minimize water waste and usage and enhance product quality. Supply chain optimization is paramount, with aseptic filling systems ensuring product integrity and enabling longer shelf life. Predictive modeling and ingredient preservation methods are key to maintaining food safety regulations, while statistical process control and product traceability systems enable efficient production and consumer trust. Flavor compound analysis and sensory evaluation methods refine product offerings, aligning with evolving consumer preferences. Ingredient sourcing strategies prioritize sustainability and quality, while process automation systems streamline operations and improve filling line efficiency.
biodegradable packaging material selection and label integrity testing are crucial for maintaining brand reputation and consumer satisfaction. Waste reduction initiatives, such as retort pouch packaging and can sealing integrity, minimize environmental impact. Nutritional content analysis and microbial contamination control ensure product healthfulness and safety. New product development and quality control metrics drive innovation, with shelf-life extension techniques and sodium reduction strategies addressing consumer demands. Metal can manufacturing advances, texture profile analysis, energy consumption monitoring, and energy-efficient production methods further contribute to the market's continuous evolution.
How is this Canned Soups Industry segmented?
The canned soups industry research report provides comprehensive data (region-wise segment analysis), with forecasts and estimates in "USD million" for the period 2024-2028, as well as historical data from 2018-2022 for the following segments.
- Type
- Condensed
- Ready-to-eat
- Product
- Conventional
- Organic
- Distribution Channel
- Supermarkets and Hypermarkets
- Online Retail
- Convenience Stores
- Foodservice
- Form
- Vegetable
- Meat
- Seafood
- Others
- Geography
- North America
- US
- Canada
- Europe
- France
- Germany
- Italy
- UK
- APAC
- China
- India
- Japan
- South Korea
- Rest of World (ROW)
- North America
By Type Insights
The condensed segment is estimated to witness significant growth during the forecast period.
The market continues to evolve, driven by consumer demand for convenient, flavorful meal options. Innovation is at the forefront, as demonstrated by Campbell's introduction of a grilled cheese and tomato soup in March 2024. This unique offering combines the comforting flavors of a grilled cheese sandwich with tomato soup, catering to consumers' taste preferences. Cost optimization strategies, such as thermal sterilization methods and high-pressure processing, are crucial in canned soup production. Supply chain optimization ensures efficient operations, while aseptic filling systems and predictive modeling maintain product quality. Ingredient preservation methods, statistical process control, and product traceability systems prioritize food safety.
Ingredient sourcing strategies and process automation systems streamline production, while packaging material selection and label integrity testing maintain product integrity. Waste reduction initiatives and energy consumption monitoring contribute to sustainability. Retort pouch packaging and filling line efficiency enhance convenience, and can sealing integrity and nutritional content analysis ensure product safety and quality. Microbial contamination control and new product development are ongoing priorities, with quality control metrics and metal can manufacturing ensuring consistency. Shelf-life extension techniques and sodium reduction techniques cater to evolving consumer preferences. Texture profile analysis and sensory evaluation methods maintain the desired taste and mouthfeel.
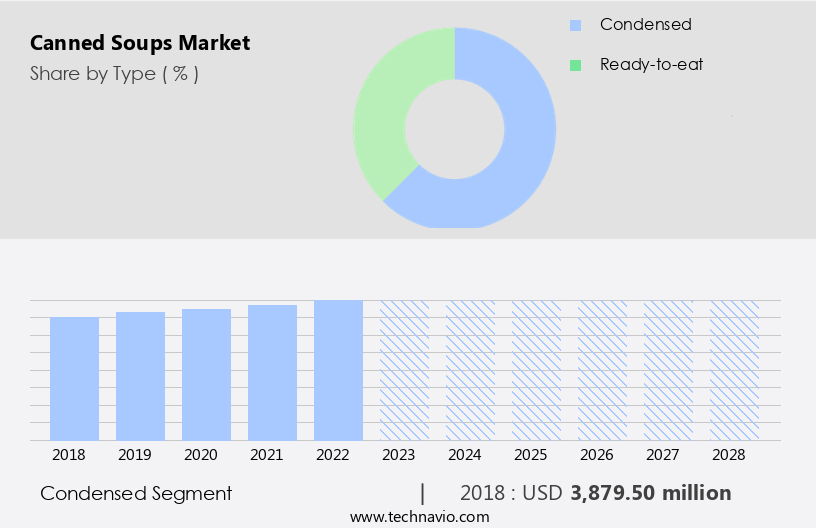
The Condensed segment was valued at USD 3.88 billion in 2018 and showed a gradual increase during the forecast period.
Regional Analysis
North America is estimated to contribute 37% to the growth of the global market during the forecast period.Technavio's analysts have elaborately explained the regional trends and drivers that shape the market during the forecast period.
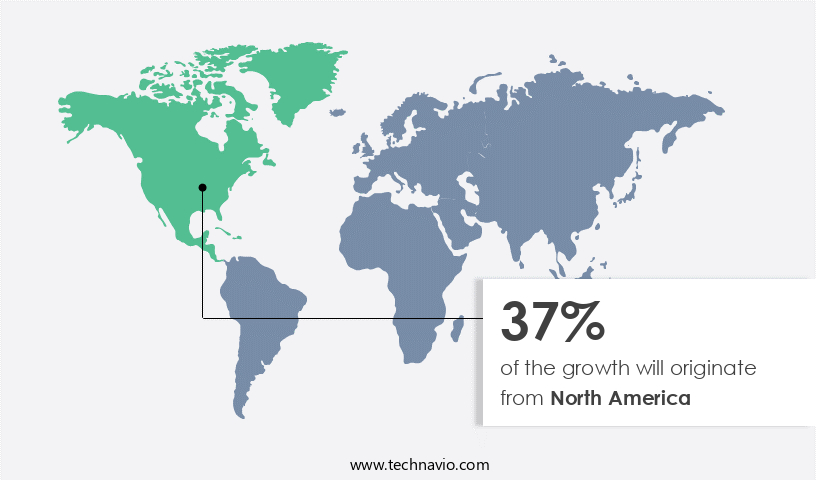
The North American canned soup market is witnessing significant growth, fueled by strategic cost optimization and innovative marketing approaches. Sterilization methods and high-pressure processing ensure food safety and shelf-life extension, while aseptic filling systems and predictive modeling streamline production and improve efficiency. Ingredient preservation methods and statistical process control maintain product quality, and product traceability systems enable transparency in the supply chain. Consumer preference research and ingredient sourcing strategies cater to evolving tastes and health trends. Process automation systems and packaging material selection optimize production and reduce waste. Sensory evaluation methods and label integrity testing ensure product consistency and quality.
Energy consumption monitoring and water usage reduction initiatives promote sustainability. New product development, including sodium reduction techniques and texture profile analysis, cater to changing consumer preferences. Quality control metrics and metal can manufacturing ensure consistent product standards. Microbial contamination control and nutritional content analysis maintain food safety and healthfulness. Retort pouch packaging and filling line efficiency offer convenience and versatility. In the US and Canada, canned soup production is a significant industry, with a strong focus on food safety regulations and flavor compound analysis. The market is expected to grow as consumers increasingly seek convenient, healthy, and sustainable food options.
Market Dynamics
Our researchers analyzed the data with 2023 as the base year, along with the key drivers, trends, and challenges. A holistic analysis of drivers will help companies refine their marketing strategies to gain a competitive advantage.
B2B soup strategies utilize low-sodium soup technologies for convenience markets. Canned soup prospects 2024 include organic soups for retailers and vegan food and canned soups, driving demand. Soup logistics analytics optimize distribution, while canned soup benchmarks highlight Campbell's. Sustainable soup sourcing aligns with healthy eating trends. Soup regulations 2024-2028 guide canned soup demand in North America 2024. Premium soup products and canned soup forecasts enhance expansion. Soups for vending machines and custom soup blends target niches. Canned soup hurdles and innovations address sodium concerns, with soup supplier networks and soup cost tactics boosting margins. Canned soup insights and healthy soup breakthroughs accelerate momentum.
What are the key market drivers leading to the rise in the adoption of Canned Soups Industry?
- companies' investments play a pivotal role in driving market growth. The market is experiencing significant growth due to strategic investments made by key players to optimize supply chains and enhance production capabilities. For instance, Campbell announced a USD230 million plan in May 2024, focusing on supply chain optimization. This initiative aims to streamline production processes and upgrade facilities, leading to increased efficiency and reduced costs. Advanced technologies, such as thermal sterilization methods like high-pressure processing and aseptic filling systems, play a crucial role in preserving ingredients and ensuring product quality.
- Moreover, predictive modeling and ingredient preservation methods are essential for maintaining consistency and extending shelf life. These investments not only improve operational efficiency but also contribute to the overall growth of the market.
What are the market trends shaping the Canned Soups Industry?
- Product innovation is an essential trend in today's market. Companies that prioritize new product development and improvement are more likely to stay competitive and attract customers.
- The market is undergoing transformation, driven by consumer preferences for customizable meal solutions and convenience without sacrificing taste and quality. A notable trend is the development of versatile flavor enhancers, allowing consumers to personalize their recipes. In June 2022, Campbell launched a new line of concentrated flavor soups, enabling users to control the intensity and portion of flavors according to their preferences. This innovation not only adds convenience but also empowers consumers to explore various culinary creations, thereby expanding the appeal of canned soups. To ensure product consistency and adhere to stringent food safety regulations, companies are implementing statistical process control and product traceability systems.
- Flavor compound analysis is another crucial aspect, as it guarantees the accurate measurement and blending of ingredients. Water usage reduction is another focus area, as sustainability becomes increasingly important to consumers. Companies are investing in ingredient sourcing strategies and process automation systems to streamline production and maintain cost-effectiveness. These initiatives underscore the industry's commitment to innovation and meeting evolving consumer demands.
What challenges does the Canned Soups Industry face during its growth?
- Product recalls pose a significant challenge to industry expansion. In the business world, the necessity to address and effectively manage product recalls is a critical aspect of ensuring consumer trust and maintaining industry growth.
- The market encounters critical challenges, particularly in relation to product recalls. In September 2024, Aldi, a major retailer, recalled two soup products - supreme creamy chicken soup and specially selected pea and ham hock soup - due to undeclared peanuts. This incident underscores the importance of allergen management and labeling accuracy. Product recalls in the food and beverage sector can stem from mishandled raw materials or supplies, potentially compromising product safety and quality. Regulatory and compliance authorities hold the power to mandate recalls and even halt operations if products pose a threat to public health.
- Waste reduction initiatives, such as retort pouch packaging and filling line efficiency, can help mitigate the risks and costs associated with recalls. Sensory evaluation methods, label integrity testing, can sealing integrity, nutritional content analysis, and waste reduction initiatives are essential strategies to maintain product quality and consumer trust.
Exclusive Customer Landscape
The canned soups market forecasting report includes the adoption lifecycle of the market, covering from the innovator's stage to the laggard's stage. It focuses on adoption rates in different regions based on penetration. Furthermore, the canned soups market report also includes key purchase criteria and drivers of price sensitivity to help companies evaluate and develop their market growth analysis strategies.
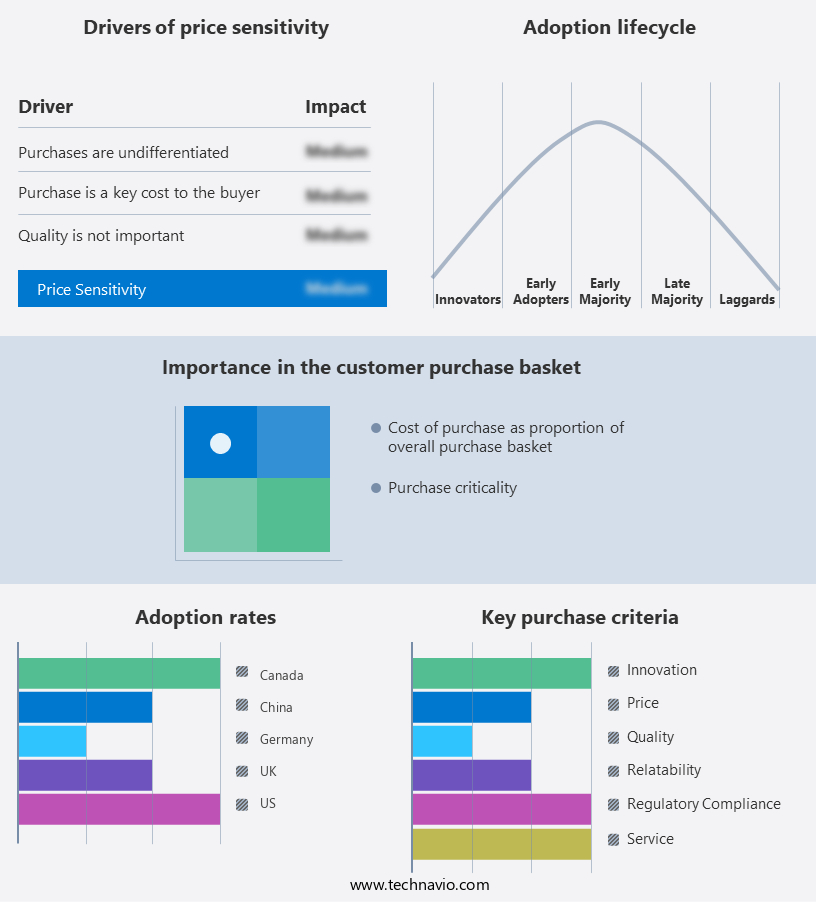
Customer Landscape
Key Companies & Market Insights
Companies are implementing various strategies, such as strategic alliances, canned soups market forecast, partnerships, mergers and acquisitions, geographical expansion, and product/service launches, to enhance their presence in the industry.
AFP advanced food products llc - This company specializes in producing organic canned soups, featuring an Organic Lentil Soup variant. Crafted with slow-simmered broths, organic vegetables, and hearty grains, these soups deliver rich, savory flavors. Consumers can opt for reduced sodium versions, ensuring a health-conscious choice. The company's commitment to organic ingredients sets it apart in the market.
The industry research and growth report includes detailed analyses of the competitive landscape of the market and information about key companies, including:
- AFP advanced food products llc
- Amys Kitchen Inc.
- Baxters Food Group Ltd.
- BCI Foods Inc.
- Blount Fine Foods
- Campbell Soup Co.
- Conagra Brands Inc.
- Delicia Foods India Pvt. Ltd.
- General Mills Inc.
- Hanover Foods
- Nestle SA
- Panera Bread
- Savory Creations International Inc.
- Sprague Foods Ltd.
- The Hain Celestial Group Inc.
- The Kraft Heinz Co.
- The Kroger Co.
- Unilever PLC
- Upton Naturals
Qualitative and quantitative analysis of companies has been conducted to help clients understand the wider business environment as well as the strengths and weaknesses of key industry players. Data is qualitatively analyzed to categorize companies as pure play, category-focused, industry-focused, and diversified; it is quantitatively analyzed to categorize companies as dominant, leading, strong, tentative, and weak.
Recent Development and News in Canned Soups Market
- In January 2024, Campbell Soup Company, a leading player in the market, introduced a new line of organic soups under its Swanson brand. This expansion catered to the growing consumer demand for healthier food options (Campbell Soup Company Press Release).
- In March 2024, Nestlé, another major player, announced a strategic partnership with Starbucks to develop and manufacture Starbucks' ready-to-eat and ready-to-cook meals, including soups, for the U.S. Market. This collaboration aimed to leverage Nestlé's expertise in food manufacturing and Starbucks' brand recognition (Nestlé SA Press Release).
- In May 2024, ConAgra Foods, Inc. Completed the acquisition of Pinnacle Foods Inc., significantly expanding its portfolio in the market. The acquisition added well-known brands like Campbell's and Red Gold to ConAgra's existing offerings (ConAgra Foods, Inc. Press Release).
- In February 2025, Hormel Foods Corporation received regulatory approval from the U.S. Food and Drug Administration (FDA) for its new high-pressure processing technology for canned soups. This technology allows for extended shelf life while maintaining product quality and nutritional value (Hormel Foods Corporation Press Release).
Research Analyst Overview
- In the dynamic the market, sales data analysis plays a crucial role in identifying consumer preferences and market trends. Flavor stability studies ensure consistent taste and quality, while waste management strategies minimize environmental impact. Ingredient quality control and supply chain management are essential for maintaining product integrity. New product innovation, achieved through process optimization techniques and microbial load reduction, keeps brands competitive. Texture modification methods and logistics optimization streamline production and distribution. Process validation studies, equipment maintenance schedules, and water conservation methods contribute to energy efficiency.
- Competitor analysis informs strategic decision-making, and canned soup formulations undergo consumer insights analysis and market research for acceptance testing. Food safety audits and thermal processing parameters ensure product safety and shelf life. Nutrient retention analysis and ingredient cost analysis are integral to maintaining profitability.
Dive into Technavio's robust research methodology, blending expert interviews, extensive data synthesis, and validated models for unparalleled Canned Soups Market insights. See full methodology.
|
Market Scope |
|
|
Report Coverage |
Details |
|
Page number |
202 |
|
Base year |
2023 |
|
Historic period |
2018-2022 |
|
Forecast period |
2024-2028 |
|
Growth momentum & CAGR |
Accelerate at a CAGR of 5.9% |
|
Market growth 2024-2028 |
USD 2235.1 million |
|
Market structure |
Fragmented |
|
YoY growth 2023-2024(%) |
4.5 |
|
Key countries |
US, China, Canada, Germany, UK, Japan, France, South Korea, Italy, and India |
|
Competitive landscape |
Leading Companies, Market Positioning of Companies, Competitive Strategies, and Industry Risks |
What are the Key Data Covered in this Canned Soups Market Research and Growth Report?
- CAGR of the Canned Soups industry during the forecast period
- Detailed information on factors that will drive the growth and forecasting between 2024 and 2028
- Precise estimation of the size of the market and its contribution of the industry in focus to the parent market
- Accurate predictions about upcoming growth and trends and changes in consumer behaviour
- Growth of the market across North America, Europe, APAC, Middle East and Africa, and South America
- Thorough analysis of the market's competitive landscape and detailed information about companies
- Comprehensive analysis of factors that will challenge the canned soups market growth of industry companies
We can help! Our analysts can customize this canned soups market research report to meet your requirements.
 RIA -
RIA - 
