Data Center IT Equipment Market Size 2026-2030
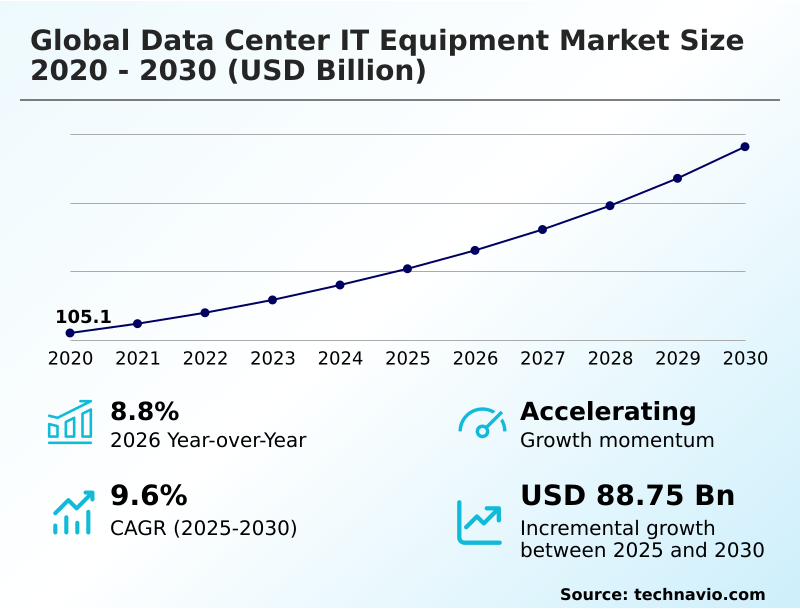
The data center it equipment market size is valued to increase by USD 88.75 billion, at a CAGR of 9.6% from 2025 to 2030. Expansion hyperscale cloud service infrastructure will drive the data center it equipment market.
Major Market Trends & Insights
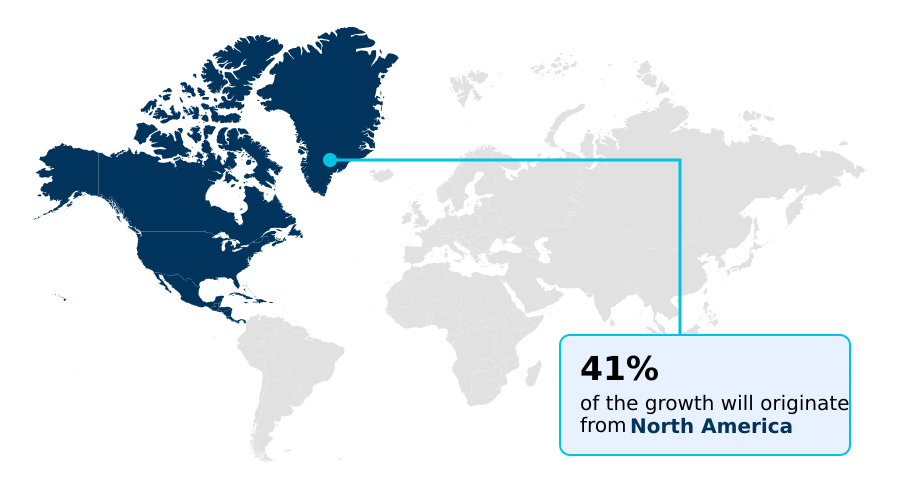
- North America dominated the market and accounted for a 40.8% growth during the forecast period.
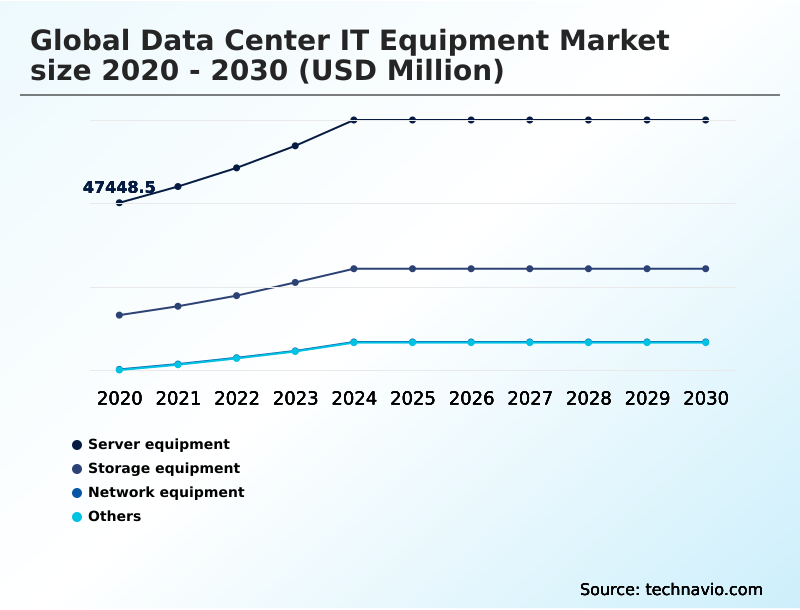
- By Product - Server equipment segment was valued at USD 63.15 billion in 2024
- By End-user - IT and telecommunication segment accounted for the largest market revenue share in 2024
Market Size & Forecast
- Market Opportunities: USD 135.48 billion
- Market Future Opportunities: USD 88.75 billion
- CAGR from 2025 to 2030 : 9.6%
Market Summary
- The data center IT equipment market is undergoing a significant technological shift driven by the intense demands of modern workloads. The expansion of hyperscale cloud infrastructure and the increasing need for high-performance computing demand are pushing the limits of traditional hardware.
- This evolution necessitates a move toward accelerated computing platforms featuring high bandwidth memory and specialized accelerators to support AI and large-scale data analytics. In response, a key trend is the adoption of advanced thermal management solutions such as direct-to-chip cooling and immersion cooling to handle increased power densities.
- A typical business scenario involves an enterprise evaluating a technology refresh cycle, weighing the high capital expenditure of new on-premises hardware against consumption-based models. This decision is complicated by power grid capacity constraints and supply chain volatility, forcing organizations to balance performance needs with operational risks and sustainability goals.
- The focus is now on creating resilient, efficient, and scalable infrastructure capable of supporting next-generation digital services.
What will be the Size of the Data Center IT Equipment Market during the forecast period?
Get Key Insights on Market Forecast (PDF) Get Free Sample
How is the Data Center IT Equipment Market Segmented?
The data center it equipment industry research report provides comprehensive data (region-wise segment analysis), with forecasts and estimates in "USD million" for the period 2026-2030, as well as historical data from 2020-2024 for the following segments.
- Product
- Server equipment
- Storage equipment
- Network equipment
- Others
- End-user
- IT and telecommunication
- BFSI
- Government and public
- Healthcare
- Others
- Deployment
- On-premises
- Cloud
- Colocation
- Geography
- North America
- US
- Canada
- Mexico
- Europe
- Germany
- UK
- France
- APAC
- China
- Australia
- Japan
- South America
- Brazil
- Argentina
- Middle East and Africa
- Saudi Arabia
- UAE
- South Africa
- Rest of World (ROW)
- North America
By Product Insights
The server equipment segment is estimated to witness significant growth during the forecast period.
The server equipment segment is foundational to digital infrastructure, encompassing configurations from traditional rack-mount servers to high-density multi-node systems. Demand is surging for servers with specialized accelerators and high-performance computing clusters, driven by AI and machine learning applications.
Architectures are evolving toward modular, scalable designs with high-speed interconnects to eliminate processing bottlenecks. This transition to high-density computing is also influencing physical designs, with a greater emphasis on advanced thermal management and power efficiency.
For instance, the integration of direct-to-chip cooling solutions has been shown to improve thermal transfer efficiency by over 30% compared to conventional air-based methods, enabling higher rack densities and supporting the intense computational needs of enterprise servers and hyperconverged infrastructure.
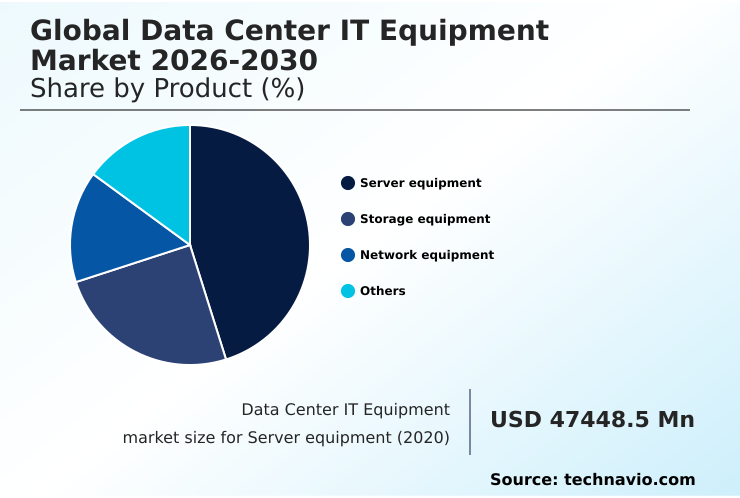
The Server equipment segment was valued at USD 63.15 billion in 2024 and showed a gradual increase during the forecast period.
Regional Analysis
North America is estimated to contribute 40.8% to the growth of the global market during the forecast period.Technavio’s analysts have elaborately explained the regional trends and drivers that shape the market during the forecast period.
See How Data Center IT Equipment Market Demand is Rising in North America Get Free Sample
The geographic landscape is defined by distinct regional priorities and investment patterns. North America, a mature market, leads in hyperscale cloud infrastructure and sovereign AI development, with a strong focus on data center modernization and hybrid cloud connectivity.
This region’s operators are pioneering advanced thermal management to support high-density rack configurations. In contrast, APAC is the fastest-growing region, driven by widespread digital transformation infrastructure needs and 5G network expansion.
This growth is creating a massive demand for data center consolidation and new colocation facility services. Europe emphasizes sustainability and data sovereignty requirements, influencing hardware choices.
For instance, data centers in this region achieve an average power usage effectiveness rating that is 10% lower than the global average.
Across all regions, the need for real-time data processing and multitenant environments is universal, though the approach to achieving these goals varies based on local economic conditions and regulatory pressures.
Market Dynamics
Our researchers analyzed the data with 2025 as the base year, along with the key drivers, trends, and challenges. A holistic analysis of drivers will help companies refine their marketing strategies to gain a competitive advantage.
- Strategic decisions in the data center IT equipment market increasingly revolve around navigating a complex matrix of technological and economic factors. Enterprises are evaluating the total cost of ownership by looking beyond initial hardware costs, asking crucial questions about the long-term benefits of liquid cooling in HPC environments and the on-premises vs. cloud data center TCO.
- The challenges in scaling edge computing infrastructure are forcing a re-evaluation of hardware requirements for 5G edge nodes. Meanwhile, the impact of open hardware on server costs is a key consideration for hyperscale operators seeking to optimize their supply chains.
- Best practices for data center IT equipment now extend to strategies for improving data center PUE and effective data center power management best practices, which are becoming as critical as raw performance. For instance, facilities implementing advanced liquid cooling report rack power densities exceeding 100 kilowatts, a nearly tenfold increase over traditional air-cooled systems.
- This highlights a critical trade-off where higher upfront investment can yield significant long-term operational efficiencies. Stakeholders must also manage supply chain risk for IT hardware while determining how to select high-density storage solutions that balance cost, capacity, and speed.
- Trends in prefabricated modular data centers offer a solution for rapid deployment, but the lifecycle management for data center assets remains a complex sustainability challenge. The high capital expenditure in data center construction necessitates a forward-looking approach, where choices made today dictate future performance and operational viability.
What are the key market drivers leading to the rise in the adoption of Data Center IT Equipment Industry?
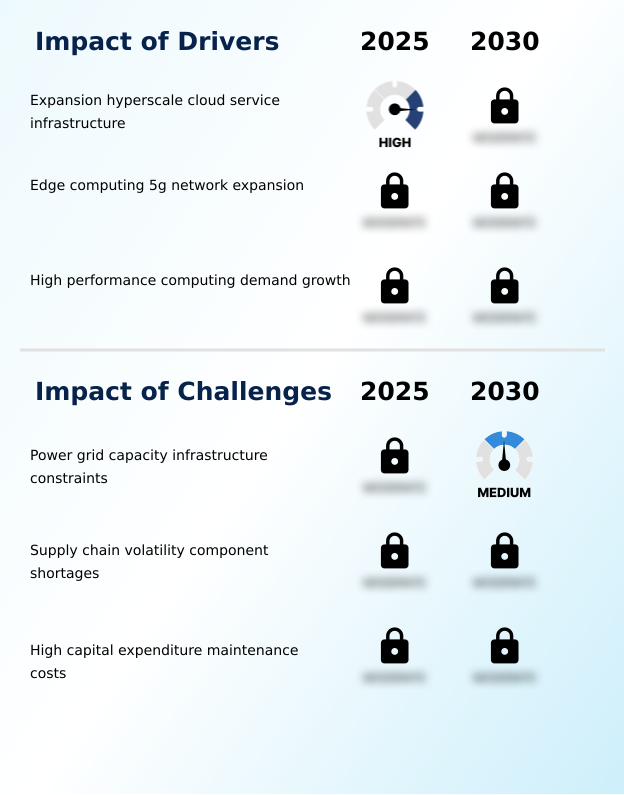
- The expansion of hyperscale cloud service infrastructure is a key driver for the data center IT equipment market, fueling demand for servers, storage, and networking hardware.
- Market growth is primarily fueled by three interconnected drivers. First, the relentless expansion of hyperscale cloud infrastructure continues, with capital expenditures increasing by more than 25% as providers build out massive campuses to support cloud services.
- This creates immense demand for custom hardware designs and open hardware standards. Second, the synergy between 5G network expansion and edge computing is creating a new frontier for ruggedized IT equipment designed for real-time data processing outside traditional facilities.
- Finally, the surging high-performance computing demand across scientific and financial sectors is driving the adoption of high bandwidth memory and non-volatile memory express technologies.
- These drivers collectively push the need for more powerful and specialized IT infrastructure management to handle increasingly complex workloads.
What are the market trends shaping the Data Center IT Equipment Industry?
- The adoption of liquid cooling hardware systems is an emerging market trend. This shift addresses the increasing thermal challenges posed by high-density computing environments.
- Key trends are reshaping infrastructure strategies, with a strong emphasis on efficiency and sustainability. The adoption of liquid cooling hardware systems is accelerating, driven by the need to manage heat loads from processors that now exceed 400 watts. This shift to technologies like rear-door heat exchangers enables facilities to drastically improve their power usage effectiveness.
- Concurrently, the move toward modular infrastructure design is streamlining deployment, with prefabricated data center modules and modular power systems reducing build times from years to months. This approach supports rapid scaling for both hyperscale and edge computing deployment scenarios.
- Furthermore, sustainable hardware initiatives are gaining traction, with a focus on circular design principles and the use of refurbished components to reduce e-waste and secure volatile supply chains.
What challenges does the Data Center IT Equipment Industry face during its growth?
- Constraints related to power grid capacity and aging electrical infrastructure present a key challenge affecting the growth of the data center industry.
- The market faces significant headwinds that test its growth trajectory, primarily centered on resource constraints and economic pressures. Severe power grid capacity constraints and aging infrastructure in key metropolitan hubs create long delays for new facility connections, with electricity prices for industrial users rising by over 15%.
- This challenge is compounded by persistent supply chain volatility, where semiconductor component shortages lead to extended hardware lead times and increased procurement costs. Furthermore, the industry is defined by extremely high capital expenditure, with a single high-performance server rack costing upwards of half a million dollars.
- This financial barrier, coupled with substantial maintenance costs, pushes many enterprises toward operational expenditure models and creates a challenging environment for long-term planning and investment.
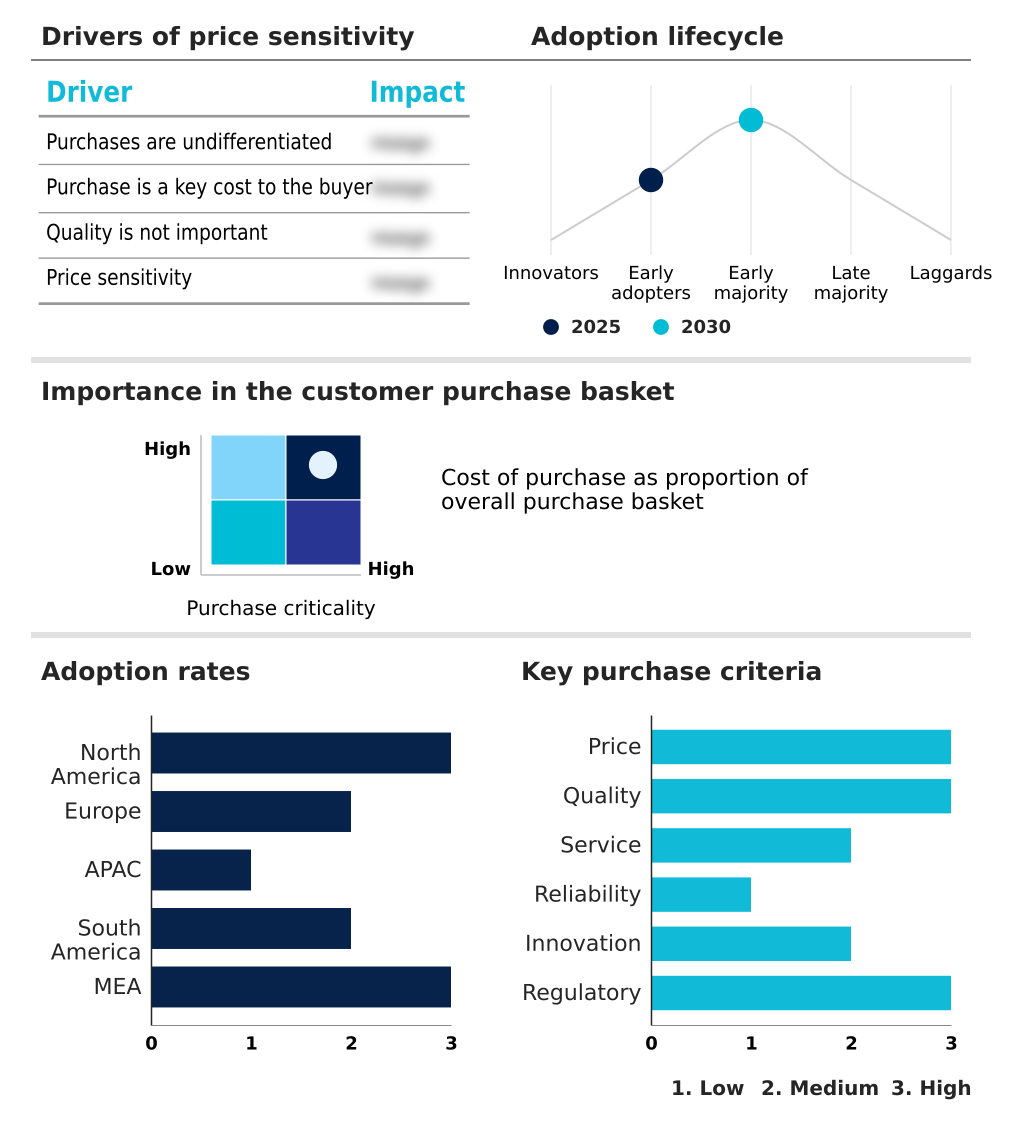
Exclusive Technavio Analysis on Customer Landscape
The data center it equipment market forecasting report includes the adoption lifecycle of the market, covering from the innovator’s stage to the laggard’s stage. It focuses on adoption rates in different regions based on penetration. Furthermore, the data center it equipment market report also includes key purchase criteria and drivers of price sensitivity to help companies evaluate and develop their market growth analysis strategies.
Customer Landscape of Data Center IT Equipment Industry
Competitive Landscape
Companies are implementing various strategies, such as strategic alliances, data center it equipment market forecast, partnerships, mergers and acquisitions, geographical expansion, and product/service launches, to enhance their presence in the industry.
Advanced Micro Devices Inc. - Key offerings encompass high-performance compute, accelerated networking, and scalable storage solutions, forming the backbone of modern digital infrastructure and enabling data-driven insights across industries.
The industry research and growth report includes detailed analyses of the competitive landscape of the market and information about key companies, including:
- Advanced Micro Devices Inc.
- Cisco Systems Inc.
- Dell Technologies Inc.
- Fujitsu Ltd.
- Hewlett Packard Enterprise Co.
- Huawei Technologies Co. Ltd.
- Intel Corp.
- Lenovo Group Ltd.
- NetApp Inc.
- NVIDIA Corp.
- Panduit Corp.
- Pure Storage Inc.
- Rittal GmbH and Co. KG
- Schneider Electric SE
- Seagate Technology LLC
- Super Micro Computer Inc.
- Telefonaktiebolaget Ericsson
- Vertiv Holdings Co.
- Western Digital Corp.
- ZTE Corp.
Qualitative and quantitative analysis of companies has been conducted to help clients understand the wider business environment as well as the strengths and weaknesses of key industry players. Data is qualitatively analyzed to categorize companies as pure play, category-focused, industry-focused, and diversified; it is quantitatively analyzed to categorize companies as dominant, leading, strong, tentative, and weak.
Recent Development and News in Data center it equipment market
- In March 2025, NVIDIA Corp. revealed a new high-performance computing platform integrating its latest graphics processing units with high-speed networking to accelerate scientific discovery in the pharmaceutical industry.
- In March 2025, Pure Storage Inc. announced an expansion of its hardware-as-a-service program, providing enterprises with more flexible consumption-based models to modernize their on-premises storage infrastructure.
- In February 2025, NetApp Inc. introduced a new series of all-flash storage arrays designed specifically for on-premises enterprise environments that require ultra-low latency for mission-critical databases.
- In November 2024, Dell Technologies Inc. launched a new series of edge-optimized servers designed to handle complex analytics and real-time data processing at the network edge while minimizing power consumption.
Dive into Technavio’s robust research methodology, blending expert interviews, extensive data synthesis, and validated models for unparalleled Data Center IT Equipment Market insights. See full methodology.
| Market Scope | |
|---|---|
| Page number | 315 |
| Base year | 2025 |
| Historic period | 2020-2024 |
| Forecast period | 2026-2030 |
| Growth momentum & CAGR | Accelerate at a CAGR of 9.6% |
| Market growth 2026-2030 | USD 88751.7 million |
| Market structure | Fragmented |
| YoY growth 2025-2026(%) | 8.8% |
| Key countries | US, Canada, Mexico, Germany, UK, France, Italy, The Netherlands, Spain, China, Australia, Japan, India, Indonesia, South Korea, Brazil, Chile, Argentina, Saudi Arabia, UAE, South Africa, Turkey and Israel |
| Competitive landscape | Leading Companies, Market Positioning of Companies, Competitive Strategies, and Industry Risks |
Research Analyst Overview
- The data center IT equipment market is defined by a relentless drive for performance and efficiency, compelling a rapid evolution in hardware design. The core of this transformation lies in the shift toward accelerated computing platforms, which integrate high-performance computing clusters, enterprise servers, and enterprise storage with specialized accelerators to handle AI workloads.
- This trend toward high-density computing has rendered traditional cooling methods inadequate, leading to the widespread adoption of advanced thermal management systems like direct-to-chip cooling and immersion cooling.
- For boardroom-level decisions, this shift directly impacts capital budgeting; investing in liquid cooling, which supports rack densities over 50 kilowatts compared to the 15-kilowatt limit of air cooling, has become a strategic necessity for future-proofing facilities. This transition is further supported by innovations in power distribution units and uninterruptible power supplies, which are critical for maintaining uptime.
- As a result, the market is characterized by a complex interplay between server equipment, storage equipment, and network equipment, all advancing to meet the demands of a data-intensive world.
What are the Key Data Covered in this Data Center IT Equipment Market Research and Growth Report?
-
What is the expected growth of the Data Center IT Equipment Market between 2026 and 2030?
-
USD 88.75 billion, at a CAGR of 9.6%
-
-
What segmentation does the market report cover?
-
The report is segmented by Product (Server equipment, Storage equipment, Network equipment, and Others), End-user (IT and telecommunication, BFSI, Government and public, Healthcare, and Others), Deployment (On-premises, Cloud, and Colocation) and Geography (North America, Europe, APAC, South America, Middle East and Africa)
-
-
Which regions are analyzed in the report?
-
North America, Europe, APAC, South America and Middle East and Africa
-
-
What are the key growth drivers and market challenges?
-
Expansion hyperscale cloud service infrastructure, Power grid capacity infrastructure constraints
-
-
Who are the major players in the Data Center IT Equipment Market?
-
Advanced Micro Devices Inc., Cisco Systems Inc., Dell Technologies Inc., Fujitsu Ltd., Hewlett Packard Enterprise Co., Huawei Technologies Co. Ltd., Intel Corp., Lenovo Group Ltd., NetApp Inc., NVIDIA Corp., Panduit Corp., Pure Storage Inc., Rittal GmbH and Co. KG, Schneider Electric SE, Seagate Technology LLC, Super Micro Computer Inc., Telefonaktiebolaget Ericsson, Vertiv Holdings Co., Western Digital Corp. and ZTE Corp.
-
Market Research Insights
- Market dynamics are shaped by a convergence of technological innovation and operational constraints, driving a rapid technology refresh cycle. The push for data-driven insights and low-latency connectivity fuels investments in data center modernization. However, this growth is tempered by real-world limitations.
- For example, edge computing deployments are expanding at a rate of 30% annually, yet this decentralization strains existing IT infrastructure management. Concurrently, rising energy costs, with electricity prices in some hubs increasing by over 15%, are forcing operators to prioritize efficiency.
- Organizations are shifting toward operational expenditure models to manage high capital costs and navigate supply chain volatility, creating a complex landscape where performance gains must be weighed against economic and logistical challenges.
We can help! Our analysts can customize this data center it equipment market research report to meet your requirements.
 RIA -
RIA - 
