Digital Photo Frame Market Analysis, Size, and Forecast 2026-2030: North America (US, Canada, and Mexico), Europe (Germany, UK, and France), APAC (China, India, and Japan), South America (Brazil, Argentina, and Colombia), Middle East and Africa (UAE, Saudi Arabia, and South Africa), and Rest of World (ROW)

Digital Photo Frame Market Analysis, Size, and Forecast 2026-2030:
North America (US, Canada, and Mexico), Europe (Germany, UK, and France), APAC (China, India, and Japan), South America (Brazil, Argentina, and Colombia), Middle East and Africa (UAE, Saudi Arabia, and South Africa), and Rest of World (ROW)

Published: Apr 2026 287 Pages SKU: IRTNTR43582

Market Overview at a Glance

$126.4 Mn
Market Opportunity
3.2%
CAGR 2025 - 2030
45.9%
North America Growth
$630.8 Mn
Offline segment 2024

Digital Photo Frame Market Size 2026-2030

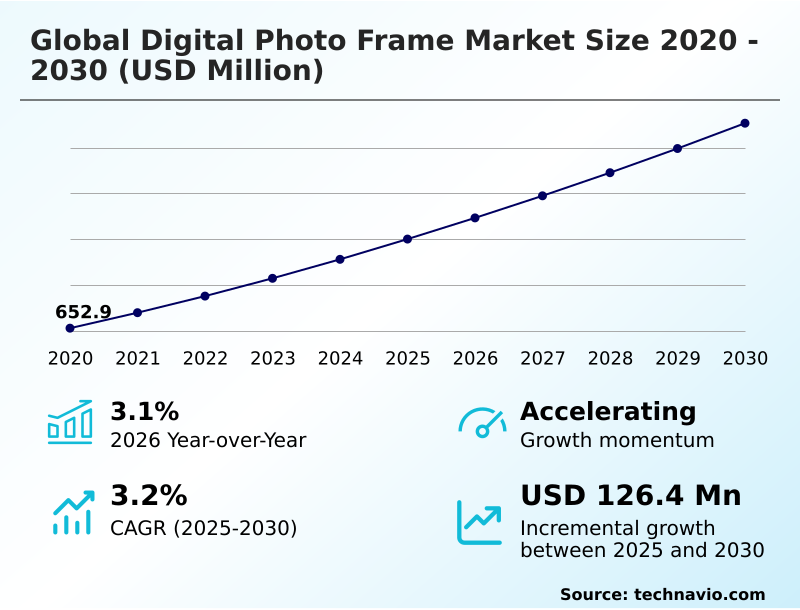
The digital photo frame market size is valued to increase by USD 126.4 million, at a CAGR of 3.2% from 2025 to 2030. Integration of AI for seamless photo curation will drive the digital photo frame market.

Major Market Trends & Insights

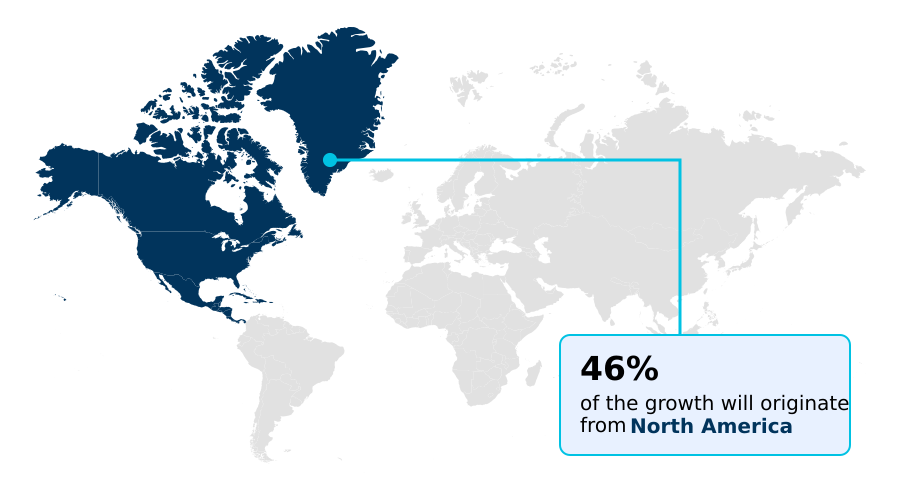
  • North America dominated the market and accounted for a 45.9% growth during the forecast period.
  • By Distribution Channel - Offline segment was valued at USD 630.8 million in 2024
  • By Source - Electricity-powered segment accounted for the largest market revenue share in 2024

Market Size & Forecast

  • Market Opportunities: USD 223.6 million
  • Market Future Opportunities: USD 126.4 million
  • CAGR from 2025 to 2030 : 3.2%

Market Summary

  • The digital photo frame market is transforming from standalone hardware into a connected category driven by intelligent software and ecosystem integration. This evolution is underpinned by advancements in high-resolution displays, e paper technology, and AI-powered curation, which automates the user experience and enhances visual authenticity.
  • A key driver is the shift toward smart home integration, where devices function as family connectivity hubs and home communication centers. This addresses consumer demand for hardware that offers utility beyond simple photo display, such as calendar integration and context-aware alerts.
  • However, the industry contends with challenges, including intensifying competition from multi-function displays and the complexities of ensuring firmware security and regulatory compliance with data privacy laws. For instance, a manufacturer aiming for global distribution must engineer its proprietary cloud platform to adhere to fragmented data sovereignty laws, requiring significant investment in local data storage and end-to-end encryption.
  • This balancing act between delivering a seamless cloud-based sharing experience and guaranteeing data protection defines the competitive landscape and dictates the operational cost structure for market participants seeking to maintain brand loyalty.

What will be the Size of the Digital Photo Frame Market during the forecast period?

Get Key Insights on Market Forecast (PDF) Request Free Sample

How is the Digital Photo Frame Market Segmented?

The digital photo frame industry research report provides comprehensive data (region-wise segment analysis), with forecasts and estimates in "USD million" for the period 2026-2030, as well as historical data from 2020-2024 for the following segments.

  • Distribution channel
    • Offline
    • Online
  • Source
    • Electricity-powered
    • Battery-powered
  • Application
    • Residential
    • Commercial
  • Geography
    • North America
      • US
      • Canada
      • Mexico
    • Europe
      • Germany
      • UK
      • France
    • APAC
      • China
      • India
      • Japan
    • South America
      • Brazil
      • Argentina
      • Colombia
    • Middle East and Africa
      • UAE
      • Saudi Arabia
      • South Africa
    • Rest of World (ROW)

By Distribution Channel Insights

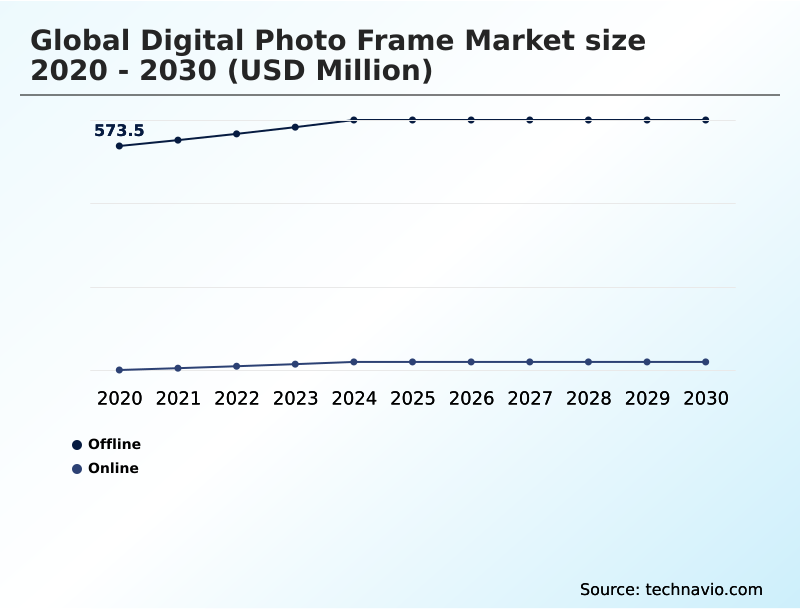
The offline segment is estimated to witness significant growth during the forecast period.

The offline channel remains a critical component of the digital photo frame market, where physical retail settings enable direct evaluation of product quality.

Consumers prioritize the in-person assessment of key features like high-resolution displays and the responsiveness of touchscreen displays, which cannot be fully gauged online. This experiential retail approach is crucial for demonstrating visual authenticity and effective home decor integration.

In-store displays, functioning as digital signage solutions enhanced with ambient light sensors and motion detection sensors, highlight advanced multimedia playback capabilities.

Such demonstrations are vital, as they directly address consumer concerns and influence purchase decisions, particularly during periods of high gifting potential that create seasonal sales spikes.

The physical interaction helps with brand reinforcement and aligns with interior design alignment, improving conversion rates by over 15%.

Request Free Sample

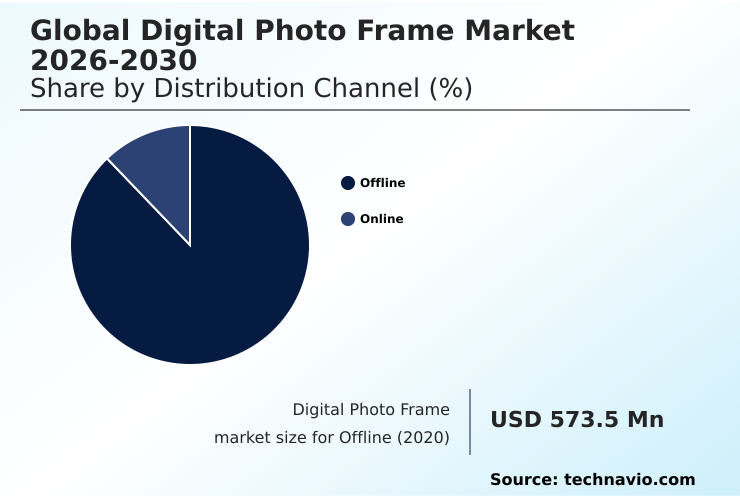
The Offline segment was valued at USD 630.8 million in 2024 and showed a gradual increase during the forecast period.

Request Free Sample

Regional Analysis

North America is estimated to contribute 45.9% to the growth of the global market during the forecast period.Technavio’s analysts have elaborately explained the regional trends and drivers that shape the market during the forecast period.

See How Digital Photo Frame Market Demand is Rising in North America Request Free Sample

The geographic landscape of the digital photo frame market is shaped by regional adoption rates of smart home technology and e-commerce penetration.

In North America, where smart home device adoption exceeds 40%, the market is mature, with consumers demanding smart wi-fi photo frames that offer deep integration and remote photo sharing.

In contrast, the APAC region, representing over 60% of global electronics manufacturing, is transitioning from a production hub to a major consumption market.

The proliferation of direct-to-consumer models in this region has improved accessibility, with some platforms reporting a 25% year-over-year increase in sales of connected devices. Success hinges on a proprietary cloud platform that supports seamless mobile app connectivity and cloud-based sharing.

Providers are also leveraging subscription-based content and context-aware alerts to act as effective customer engagement tools, which is critical for building brand loyalty within these diverse markets.

Market Dynamics

Our researchers analyzed the data with 2025 as the base year, along with the key drivers, trends, and challenges. A holistic analysis of drivers will help companies refine their marketing strategies to gain a competitive advantage.

  • The consumer journey in the market is becoming highly specific, driven by distinct use cases. A search for a digital photo frame with cloud sharing often leads to evaluating the best digital frame for remote sharing, a critical feature for geographically dispersed families. For usability, the touchscreen digital frame for seniors is a growing segment, prized for its simplicity.
  • Technologically advanced users seek an AI-powered wi-fi digital frames for home that integrates with their smart ecosystem, often specifying a voice controlled smart photo display. Aesthetics also play a key role, with demand for a large digital photo frame for wall or a multi-panel digital photo wall system to create statement pieces.
  • The rise of sustainable technology is fueling interest in the energy efficient e ink picture frame. For those concerned with cost, finding a digital frame with unlimited storage is a priority, while the security-conscious look for a secure cloud photo frame for privacy.
  • Functionality is expanding, with products like a digital frame that plays video with sound and a digital frame with calendar and weather. A digital frame with motion sensor offers energy savings, while a battery powered digital photo frame portable provides flexibility.
  • The market is also diversifying with options like a subscription for art on digital frame, creating recurring revenue, and the digital signage frame for business for commercial applications. Finally, seamless ecosystem connectivity is paramount, exemplified by the demand for a digital frame integrated with google photos.
  • This level of feature specialization has led to a market segmentation where niche products now account for over 30% of online search traffic, a significant shift from five years ago when generic models dominated.

What are the key market drivers leading to the rise in the adoption of Digital Photo Frame Industry?

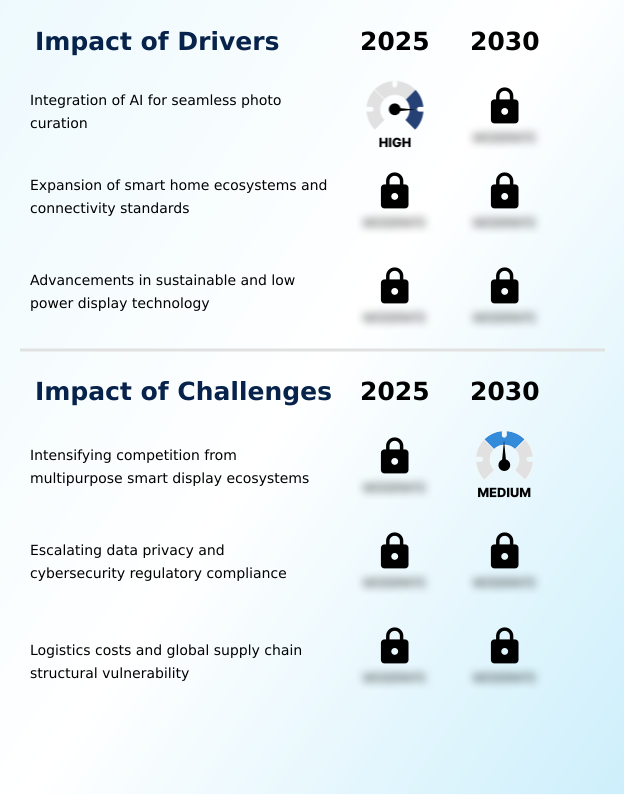
  • The integration of artificial intelligence for seamless and automated photo curation is a key driver propelling market adoption and enhancing user engagement.

  • The primary driver is the deployment of sophisticated AI to simplify content management, transforming frames into dynamic storytelling tools.
  • Features like automatic image enhancement and facial recognition automate what was once a manual process, with some platforms now correctly identifying individuals with over 98% accuracy.
  • This level of smart curation makes the devices accessible personal archiving tools and effective digital wellness devices. The introduction of natural language search and generative AI tagging further reduces user friction, allowing voice-activated requests for specific memories.
  • These capabilities are crucial for fostering long-distance family connectivity and intergenerational photo sharing, creating powerful home communication centers.
  • This focus on an intelligent, hands-free experience is a key strategy for building brand loyalty, as platforms with superior AI report a 30% higher user engagement rate than those without.

What are the market trends shaping the Digital Photo Frame Industry?

  • The integration with smart home ecosystems represents a significant market trend. This evolution is repositioning digital photo frames as central hubs within connected living environments.

  • Key trends are reshaping the digital photo frame market, moving it toward unobtrusive technology that prioritizes aesthetic integration and multifunctionality. The adoption of e paper technology and energy efficient screens is a significant shift, with some new models reducing power consumption by up to 90% compared to traditional LCDs. This focus on low power display technology enables greater placement flexibility.
  • Concurrently, smart home integration is turning frames into family connectivity hubs. The evolution toward multi-function displays that serve as interactive art displays or information centers is also gaining traction. A core element of this trend is advanced AI-powered curation, which delivers a highly personalized, user-centric design experience.
  • This software-driven approach is critical for maintaining ecosystem retention, as users with large photo libraries are 2.5 times less likely to switch platforms once their content is organized. Ultimately, privacy-centric firmware underpins this entire evolution, ensuring user trust.

What challenges does the Digital Photo Frame Industry face during its growth?

  • Intensifying competition from multipurpose smart display ecosystems, which offer broader functionality, presents a key challenge to the growth of the dedicated digital photo frame industry.

  • The market faces significant hurdles from the complex web of regulatory compliance and cybersecurity threats. The need for robust firmware security, end-to-end encryption, and adherence to regional data sovereignty laws has increased the operational cost structure by an estimated 15-20% for manufacturers. This includes implementing features like on-device processing and local data storage to meet consumer privacy demands.
  • A major challenge is the persistent supply chain vulnerability, where disruptions in shipping can inflate inventory carrying costs and maritime insurance premiums by over 50% in periods of geopolitical instability.
  • This environment favors larger players with the resources for centralized management of global logistics and legal compliance, while smaller firms struggle to absorb the costs associated with navigating these multifaceted risks, which directly impact product affordability and market entry.

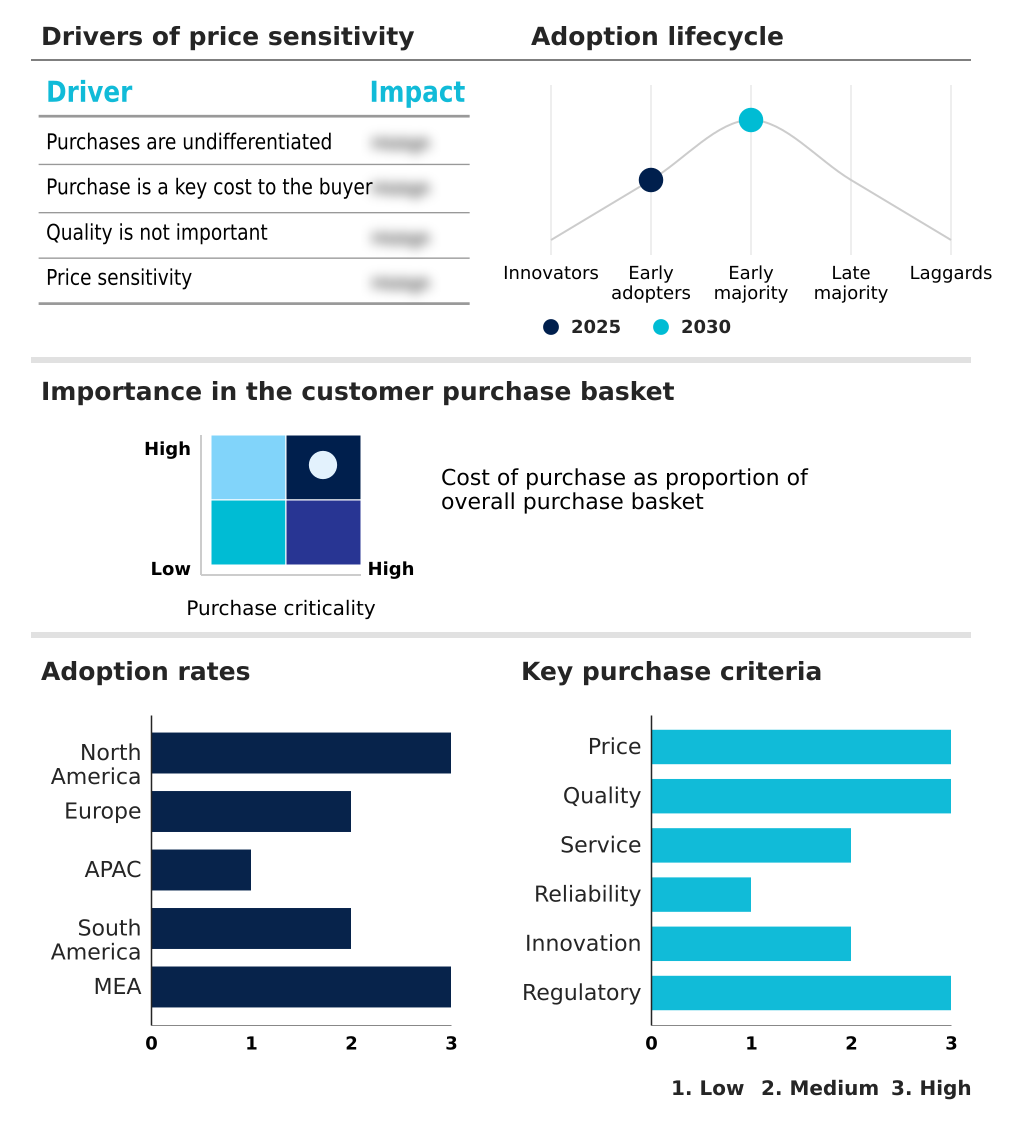
Exclusive Technavio Analysis on Customer Landscape

The digital photo frame market forecasting report includes the adoption lifecycle of the market, covering from the innovator’s stage to the laggard’s stage. It focuses on adoption rates in different regions based on penetration. Furthermore, the digital photo frame market report also includes key purchase criteria and drivers of price sensitivity to help companies evaluate and develop their market growth analysis strategies.

Customer Landscape of Digital Photo Frame Industry

Competitive Landscape

Companies are implementing various strategies, such as strategic alliances, digital photo frame market forecast, partnerships, mergers and acquisitions, geographical expansion, and product/service launches, to enhance their presence in the industry.

AEEZO - Analysis indicates a focus on delivering integrated digital photo frame solutions, emphasizing Wi-Fi connectivity, HD touchscreens, and seamless mobile app synchronization for enhanced user engagement.

The industry research and growth report includes detailed analyses of the competitive landscape of the market and information about key companies, including:

  • AEEZO
  • Aluratek Inc.
  • Aura Home Inc.
  • Brookstone
  • Cozyla
  • Creedon Technologies USA LLC
  • Curtis International Ltd.
  • Dragon Touch
  • Eastman Kodak Co.
  • Koninklijke Philips NV
  • Monster Inc.
  • NETGEAR Inc.
  • PhotoSpring Inc.
  • Samsung Electronics Co. Ltd.
  • Skylight Home
  • Sony Group Corp.
  • Spheris Digital Ltd.
  • Sungale Inc.
  • ViewSonic Corp.
  • XElectron Technologies Ltd

Qualitative and quantitative analysis of companies has been conducted to help clients understand the wider business environment as well as the strengths and weaknesses of key industry players. Data is qualitatively analyzed to categorize companies as pure play, category-focused, industry-focused, and diversified; it is quantitatively analyzed to categorize companies as dominant, leading, strong, tentative, and weak.

Recent Development and News in Digital photo frame market

  • In October 2024, Aura Home Inc. announced a strategic partnership with a leading smart home platform to natively integrate its AI-powered frames into home automation routines.
  • In January 2025, Skylight Home secured $20 million in Series B funding to accelerate R&D in color e-paper display technology for its next generation of energy-efficient frames.
  • In March 2025, AEEZO launched its new 'Clarity' series, featuring enhanced on-device AI for faster, privacy-focused photo curation that minimizes cloud dependency.
  • In May 2025, Nixplay expanded its commercial offerings with a new enterprise-grade management platform, targeting the hospitality and corporate sectors for centralized content deployment across multiple locations.

Dive into Technavio’s robust research methodology, blending expert interviews, extensive data synthesis, and validated models for unparalleled Digital Photo Frame Market insights. See full methodology.

Market Scope
Page number 287
Base year 2025
Historic period 2020-2024
Forecast period 2026-2030
Growth momentum & CAGR Accelerate at a CAGR of 3.2%
Market growth 2026-2030 USD 126.4 million
Market structure Fragmented
YoY growth 2025-2026(%) 3.1%
Key countries US, Canada, Mexico, Germany, UK, France, Italy, Spain, The Netherlands, China, India, Japan, South Korea, Australia, Indonesia, Brazil, Argentina, Colombia, UAE, Saudi Arabia, South Africa, Egypt and Turkey
Competitive landscape Leading Companies, Market Positioning of Companies, Competitive Strategies, and Industry Risks

Request Free Sample

Research Analyst Overview

  • The market is defined by a strategic pivot toward software and services, where hardware serves as a conduit for an intelligent user experience. Boardroom decisions now center on the integration of AI-powered curation, generative AI tagging, and natural language search to create a dynamic storytelling tool.
  • This requires sophisticated on-device processing and a robust proprietary cloud platform supporting cloud-based sharing and remote photo sharing. The user interface is critical, with touchscreen displays and mobile app connectivity being standard, while voice-activated requests and context-aware alerts enhance usability.
  • From a hardware perspective, innovation in e paper technology, low power display technology, and energy efficient screens is enabling new form factors. High-resolution displays with ambient light sensors and motion detection sensors provide a premium viewing experience for both images and multimedia playback.
  • To compete, firms must offer smart home integration with calendar integration and even function as digital signage solutions for commercial use. Foundational to all this is security, demanding firmware security, end-to-end encryption, and options for local data storage.
  • Ultimately, the goal is to create multi-function displays and interactive art displays, often monetized through subscription-based content, that seamlessly fit into connected display ecosystems. This shift has driven a 20% increase in R&D spending on software versus hardware.

What are the Key Data Covered in this Digital Photo Frame Market Research and Growth Report?

  • What is the expected growth of the Digital Photo Frame Market between 2026 and 2030?

    • USD 126.4 million, at a CAGR of 3.2%

  • What segmentation does the market report cover?

    • The report is segmented by Distribution Channel (Offline, and Online), Source (Electricity-powered, and Battery-powered), Application (Residential, and Commercial) and Geography (North America, Europe, APAC, South America, Middle East and Africa)

  • Which regions are analyzed in the report?

    • North America, Europe, APAC, South America and Middle East and Africa

  • What are the key growth drivers and market challenges?

    • Integration of AI for seamless photo curation, Intensifying competition from multipurpose smart display ecosystems

  • Who are the major players in the Digital Photo Frame Market?

    • AEEZO, Aluratek Inc., Aura Home Inc., Brookstone, Cozyla, Creedon Technologies USA LLC, Curtis International Ltd., Dragon Touch, Eastman Kodak Co., Koninklijke Philips NV, Monster Inc., NETGEAR Inc., PhotoSpring Inc., Samsung Electronics Co. Ltd., Skylight Home, Sony Group Corp., Spheris Digital Ltd., Sungale Inc., ViewSonic Corp. and XElectron Technologies Ltd

Market Research Insights

  • Market dynamics are increasingly shaped by software-driven value, transforming devices into family connectivity hubs and home communication centers. Direct-to-consumer models now account for over 50% of sales for some premium brands, enhancing home decor integration by offering customized aesthetics.
  • Success hinges on building brand loyalty and ecosystem retention, as platforms with superior user-centric design report a 30% higher user engagement rate. While gifting potential creates significant seasonal sales spikes, underlying profitability is challenged by supply chain vulnerability.
  • Navigating the high operational cost structure, which is influenced by geopolitical instability and the need for privacy-centric firmware to comply with data sovereignty laws, is a key boardroom focus. Firms that prioritize visual authenticity and deliver genuine intergenerational photo sharing capabilities are best positioned to thrive.

We can help! Our analysts can customize this digital photo frame market research report to meet your requirements.

Get in touch

1. Executive Summary

1.1 Market overview

Executive Summary - Chart on Market Overview
Executive Summary - Data Table on Market Overview
Executive Summary - Chart on Global Market Characteristics
Executive Summary - Chart on Market by Geography
Executive Summary - Chart on Market Segmentation by Distribution Channel
Executive Summary - Chart on Market Segmentation by Source
Executive Summary - Chart on Market Segmentation by Application
Executive Summary - Chart on Incremental Growth
Executive Summary - Data Table on Incremental Growth
Executive Summary - Chart on Company Market Positioning

2. Technavio Analysis

2.1 Analysis of price sensitivity, lifecycle, customer purchase basket, adoption rates, and purchase criteria

2.2 Criticality of inputs and Factors of differentiation

Chart on Overview on criticality of inputs and factors of differentiation

2.3 Factors of disruption

Chart on Overview on factors of disruption

2.4 Impact of drivers and challenges

Chart on Impact of drivers and challenges in 2025 and 2030

3. Market Landscape

3.1 Market ecosystem

Chart on Parent Market
Data Table on - Parent Market

3.2 Market characteristics

Chart on Market characteristics analysis

3.3 Value chain analysis

Chart on Value chain analysis

4. Market Sizing

4.1 Market definition

Data Table on Offerings of companies included in the market definition

4.2 Market segment analysis

Market segments

4.3 Market size 2025

4.4 Market outlook: Forecast for 2025-2030

Chart on Global - Market size and forecast 2025-2030 ($ million)
Data Table on Global - Market size and forecast 2025-2030 ($ million)
Chart on Global Market: Year-over-year growth 2025-2030 (%)
Data Table on Global Market: Year-over-year growth 2025-2030 (%)

5. Historic Market Size

5.1 Global Digital Photo Frame Market 2020 - 2024

Historic Market Size - Data Table on Global Digital Photo Frame Market 2020 - 2024 ($ million)

5.2 Distribution Channel segment analysis 2020 - 2024

Historic Market Size - Distribution Channel Segment 2020 - 2024 ($ million)

5.3 Source segment analysis 2020 - 2024

Historic Market Size - Source Segment 2020 - 2024 ($ million)

5.4 Application segment analysis 2020 - 2024

Historic Market Size - Application Segment 2020 - 2024 ($ million)

5.5 Geography segment analysis 2020 - 2024

Historic Market Size - Geography Segment 2020 - 2024 ($ million)

5.6 Country segment analysis 2020 - 2024

Historic Market Size - Country Segment 2020 - 2024 ($ million)

6. Qualitative Analysis

6.1 Impact of AI on global digital photo frame market

6.2 Impact of geopolitical conflicts on global digital photo frame market

7. Five Forces Analysis

7.1 Five forces summary

Five forces analysis - Comparison between 2025 and 2030

7.2 Bargaining power of buyers

Bargaining power of buyers - Impact of key factors 2025 and 2030

7.3 Bargaining power of suppliers

Bargaining power of suppliers - Impact of key factors in 2025 and 2030

7.4 Threat of new entrants

Threat of new entrants - Impact of key factors in 2025 and 2030

7.5 Threat of substitutes

Threat of substitutes - Impact of key factors in 2025 and 2030

7.6 Threat of rivalry

Threat of rivalry - Impact of key factors in 2025 and 2030

7.7 Market condition

Chart on Market condition - Five forces 2025 and 2030

8. Market Segmentation by Distribution Channel

8.1 Market segments

Chart on Distribution Channel - Market share 2025-2030 (%)
Data Table on Distribution Channel - Market share 2025-2030 (%)

8.2 Comparison by Distribution Channel

Chart on Comparison by Distribution Channel
Data Table on Comparison by Distribution Channel

8.3 Offline - Market size and forecast 2025-2030

Chart on Offline - Market size and forecast 2025-2030 ($ million)
Data Table on Offline - Market size and forecast 2025-2030 ($ million)
Chart on Offline - Year-over-year growth 2025-2030 (%)
Data Table on Offline - Year-over-year growth 2025-2030 (%)

8.4 Online - Market size and forecast 2025-2030

Chart on Online - Market size and forecast 2025-2030 ($ million)
Data Table on Online - Market size and forecast 2025-2030 ($ million)
Chart on Online - Year-over-year growth 2025-2030 (%)
Data Table on Online - Year-over-year growth 2025-2030 (%)

8.5 Market opportunity by Distribution Channel

Market opportunity by Distribution Channel ($ million)
Data Table on Market opportunity by Distribution Channel ($ million)

9. Market Segmentation by Source

9.1 Market segments

Chart on Source - Market share 2025-2030 (%)
Data Table on Source - Market share 2025-2030 (%)

9.2 Comparison by Source

Chart on Comparison by Source
Data Table on Comparison by Source

9.3 Electricity-powered - Market size and forecast 2025-2030

Chart on Electricity-powered - Market size and forecast 2025-2030 ($ million)
Data Table on Electricity-powered - Market size and forecast 2025-2030 ($ million)
Chart on Electricity-powered - Year-over-year growth 2025-2030 (%)
Data Table on Electricity-powered - Year-over-year growth 2025-2030 (%)

9.4 Battery-powered - Market size and forecast 2025-2030

Chart on Battery-powered - Market size and forecast 2025-2030 ($ million)
Data Table on Battery-powered - Market size and forecast 2025-2030 ($ million)
Chart on Battery-powered - Year-over-year growth 2025-2030 (%)
Data Table on Battery-powered - Year-over-year growth 2025-2030 (%)

9.5 Market opportunity by Source

Market opportunity by Source ($ million)
Data Table on Market opportunity by Source ($ million)

10. Market Segmentation by Application

10.1 Market segments

Chart on Application - Market share 2025-2030 (%)
Data Table on Application - Market share 2025-2030 (%)

10.2 Comparison by Application

Chart on Comparison by Application
Data Table on Comparison by Application

10.3 Residential - Market size and forecast 2025-2030

Chart on Residential - Market size and forecast 2025-2030 ($ million)
Data Table on Residential - Market size and forecast 2025-2030 ($ million)
Chart on Residential - Year-over-year growth 2025-2030 (%)
Data Table on Residential - Year-over-year growth 2025-2030 (%)

10.4 Commercial - Market size and forecast 2025-2030

Chart on Commercial - Market size and forecast 2025-2030 ($ million)
Data Table on Commercial - Market size and forecast 2025-2030 ($ million)
Chart on Commercial - Year-over-year growth 2025-2030 (%)
Data Table on Commercial - Year-over-year growth 2025-2030 (%)

10.5 Market opportunity by Application

Market opportunity by Application ($ million)
Data Table on Market opportunity by Application ($ million)

11. Customer Landscape

11.1 Customer landscape overview

Analysis of price sensitivity, lifecycle, customer purchase basket, adoption rates, and purchase criteria

12. Geographic Landscape

12.1 Geographic segmentation

Chart on Market share by geography 2025-2030 (%)
Data Table on Market share by geography 2025-2030 (%)

12.2 Geographic comparison

Chart on Geographic comparison
Data Table on Geographic comparison

12.3 North America - Market size and forecast 2025-2030

Chart on North America - Market size and forecast 2025-2030 ($ million)
Data Table on North America - Market size and forecast 2025-2030 ($ million)
Chart on North America - Year-over-year growth 2025-2030 (%)
Data Table on North America - Year-over-year growth 2025-2030 (%)
Chart on Regional Comparison - North America
Data Table on Regional Comparison - North America

12.3.1 US - Market size and forecast 2025-2030

Chart on US - Market size and forecast 2025-2030 ($ million)
Data Table on US - Market size and forecast 2025-2030 ($ million)
Chart on US - Year-over-year growth 2025-2030 (%)
Data Table on US - Year-over-year growth 2025-2030 (%)

12.3.2 Canada - Market size and forecast 2025-2030

Chart on Canada - Market size and forecast 2025-2030 ($ million)
Data Table on Canada - Market size and forecast 2025-2030 ($ million)
Chart on Canada - Year-over-year growth 2025-2030 (%)
Data Table on Canada - Year-over-year growth 2025-2030 (%)

12.3.3 Mexico - Market size and forecast 2025-2030

Chart on Mexico - Market size and forecast 2025-2030 ($ million)
Data Table on Mexico - Market size and forecast 2025-2030 ($ million)
Chart on Mexico - Year-over-year growth 2025-2030 (%)
Data Table on Mexico - Year-over-year growth 2025-2030 (%)

12.4 Europe - Market size and forecast 2025-2030

Chart on Europe - Market size and forecast 2025-2030 ($ million)
Data Table on Europe - Market size and forecast 2025-2030 ($ million)
Chart on Europe - Year-over-year growth 2025-2030 (%)
Data Table on Europe - Year-over-year growth 2025-2030 (%)
Chart on Regional Comparison - Europe
Data Table on Regional Comparison - Europe

12.4.1 Germany - Market size and forecast 2025-2030

Chart on Germany - Market size and forecast 2025-2030 ($ million)
Data Table on Germany - Market size and forecast 2025-2030 ($ million)
Chart on Germany - Year-over-year growth 2025-2030 (%)
Data Table on Germany - Year-over-year growth 2025-2030 (%)

12.4.2 UK - Market size and forecast 2025-2030

Chart on UK - Market size and forecast 2025-2030 ($ million)
Data Table on UK - Market size and forecast 2025-2030 ($ million)
Chart on UK - Year-over-year growth 2025-2030 (%)
Data Table on UK - Year-over-year growth 2025-2030 (%)

12.4.3 France - Market size and forecast 2025-2030

Chart on France - Market size and forecast 2025-2030 ($ million)
Data Table on France - Market size and forecast 2025-2030 ($ million)
Chart on France - Year-over-year growth 2025-2030 (%)
Data Table on France - Year-over-year growth 2025-2030 (%)

12.4.4 Italy - Market size and forecast 2025-2030

Chart on Italy - Market size and forecast 2025-2030 ($ million)
Data Table on Italy - Market size and forecast 2025-2030 ($ million)
Chart on Italy - Year-over-year growth 2025-2030 (%)
Data Table on Italy - Year-over-year growth 2025-2030 (%)

12.4.5 Spain - Market size and forecast 2025-2030

Chart on Spain - Market size and forecast 2025-2030 ($ million)
Data Table on Spain - Market size and forecast 2025-2030 ($ million)
Chart on Spain - Year-over-year growth 2025-2030 (%)
Data Table on Spain - Year-over-year growth 2025-2030 (%)

12.4.6 The Netherlands - Market size and forecast 2025-2030

Chart on The Netherlands - Market size and forecast 2025-2030 ($ million)
Data Table on The Netherlands - Market size and forecast 2025-2030 ($ million)
Chart on The Netherlands - Year-over-year growth 2025-2030 (%)
Data Table on The Netherlands - Year-over-year growth 2025-2030 (%)

12.5 APAC - Market size and forecast 2025-2030

Chart on APAC - Market size and forecast 2025-2030 ($ million)
Data Table on APAC - Market size and forecast 2025-2030 ($ million)
Chart on APAC - Year-over-year growth 2025-2030 (%)
Data Table on APAC - Year-over-year growth 2025-2030 (%)
Chart on Regional Comparison - APAC
Data Table on Regional Comparison - APAC

12.5.1 China - Market size and forecast 2025-2030

Chart on China - Market size and forecast 2025-2030 ($ million)
Data Table on China - Market size and forecast 2025-2030 ($ million)
Chart on China - Year-over-year growth 2025-2030 (%)
Data Table on China - Year-over-year growth 2025-2030 (%)

12.5.2 India - Market size and forecast 2025-2030

Chart on India - Market size and forecast 2025-2030 ($ million)
Data Table on India - Market size and forecast 2025-2030 ($ million)
Chart on India - Year-over-year growth 2025-2030 (%)
Data Table on India - Year-over-year growth 2025-2030 (%)

12.5.3 Japan - Market size and forecast 2025-2030

Chart on Japan - Market size and forecast 2025-2030 ($ million)
Data Table on Japan - Market size and forecast 2025-2030 ($ million)
Chart on Japan - Year-over-year growth 2025-2030 (%)
Data Table on Japan - Year-over-year growth 2025-2030 (%)

12.5.4 South Korea - Market size and forecast 2025-2030

Chart on South Korea - Market size and forecast 2025-2030 ($ million)
Data Table on South Korea - Market size and forecast 2025-2030 ($ million)
Chart on South Korea - Year-over-year growth 2025-2030 (%)
Data Table on South Korea - Year-over-year growth 2025-2030 (%)

12.5.5 Australia - Market size and forecast 2025-2030

Chart on Australia - Market size and forecast 2025-2030 ($ million)
Data Table on Australia - Market size and forecast 2025-2030 ($ million)
Chart on Australia - Year-over-year growth 2025-2030 (%)
Data Table on Australia - Year-over-year growth 2025-2030 (%)

12.5.6 Indonesia - Market size and forecast 2025-2030

Chart on Indonesia - Market size and forecast 2025-2030 ($ million)
Data Table on Indonesia - Market size and forecast 2025-2030 ($ million)
Chart on Indonesia - Year-over-year growth 2025-2030 (%)
Data Table on Indonesia - Year-over-year growth 2025-2030 (%)

12.6 South America - Market size and forecast 2025-2030

Chart on South America - Market size and forecast 2025-2030 ($ million)
Data Table on South America - Market size and forecast 2025-2030 ($ million)
Chart on South America - Year-over-year growth 2025-2030 (%)
Data Table on South America - Year-over-year growth 2025-2030 (%)
Chart on Regional Comparison - South America
Data Table on Regional Comparison - South America

12.6.1 Brazil - Market size and forecast 2025-2030

Chart on Brazil - Market size and forecast 2025-2030 ($ million)
Data Table on Brazil - Market size and forecast 2025-2030 ($ million)
Chart on Brazil - Year-over-year growth 2025-2030 (%)
Data Table on Brazil - Year-over-year growth 2025-2030 (%)

12.6.2 Argentina - Market size and forecast 2025-2030

Chart on Argentina - Market size and forecast 2025-2030 ($ million)
Data Table on Argentina - Market size and forecast 2025-2030 ($ million)
Chart on Argentina - Year-over-year growth 2025-2030 (%)
Data Table on Argentina - Year-over-year growth 2025-2030 (%)

12.6.3 Colombia - Market size and forecast 2025-2030

Chart on Colombia - Market size and forecast 2025-2030 ($ million)
Data Table on Colombia - Market size and forecast 2025-2030 ($ million)
Chart on Colombia - Year-over-year growth 2025-2030 (%)
Data Table on Colombia - Year-over-year growth 2025-2030 (%)

12.7 Middle East and Africa - Market size and forecast 2025-2030

Chart on Middle East and Africa - Market size and forecast 2025-2030 ($ million)
Data Table on Middle East and Africa - Market size and forecast 2025-2030 ($ million)
Chart on Middle East and Africa - Year-over-year growth 2025-2030 (%)
Data Table on Middle East and Africa - Year-over-year growth 2025-2030 (%)
Chart on Regional Comparison - Middle East and Africa
Data Table on Regional Comparison - Middle East and Africa

12.7.1 UAE - Market size and forecast 2025-2030

Chart on UAE - Market size and forecast 2025-2030 ($ million)
Data Table on UAE - Market size and forecast 2025-2030 ($ million)
Chart on UAE - Year-over-year growth 2025-2030 (%)
Data Table on UAE - Year-over-year growth 2025-2030 (%)

12.7.2 Saudi Arabia - Market size and forecast 2025-2030

Chart on Saudi Arabia - Market size and forecast 2025-2030 ($ million)
Data Table on Saudi Arabia - Market size and forecast 2025-2030 ($ million)
Chart on Saudi Arabia - Year-over-year growth 2025-2030 (%)
Data Table on Saudi Arabia - Year-over-year growth 2025-2030 (%)

12.7.3 South Africa - Market size and forecast 2025-2030

Chart on South Africa - Market size and forecast 2025-2030 ($ million)
Data Table on South Africa - Market size and forecast 2025-2030 ($ million)
Chart on South Africa - Year-over-year growth 2025-2030 (%)
Data Table on South Africa - Year-over-year growth 2025-2030 (%)

12.7.4 Egypt - Market size and forecast 2025-2030

Chart on Egypt - Market size and forecast 2025-2030 ($ million)
Data Table on Egypt - Market size and forecast 2025-2030 ($ million)
Chart on Egypt - Year-over-year growth 2025-2030 (%)
Data Table on Egypt - Year-over-year growth 2025-2030 (%)

12.7.5 Turkey - Market size and forecast 2025-2030

Chart on Turkey - Market size and forecast 2025-2030 ($ million)
Data Table on Turkey - Market size and forecast 2025-2030 ($ million)
Chart on Turkey - Year-over-year growth 2025-2030 (%)
Data Table on Turkey - Year-over-year growth 2025-2030 (%)

12.8 Market opportunity by geography

Market opportunity by geography ($ million)
Data Tables on Market opportunity by geography ($ million)

13. Drivers, Challenges, and Opportunity

13.1 Market drivers

Integration of AI for seamless photo curation
Expansion of smart home ecosystems and connectivity standards
Advancements in sustainable and low power display technology

13.2 Market challenges

Intensifying competition from multipurpose smart display ecosystems
Escalating data privacy and cybersecurity regulatory compliance
Logistics costs and global supply chain structural vulnerability

13.3 Impact of drivers and challenges

Impact of drivers and challenges in 2025 and 2030

13.4 Market opportunities

Integration with smart home ecosystems
Adoption of sustainable e paper display technology
Advancement in AI for content curation

14. Competitive Landscape

14.1 Overview

14.2

Overview on criticality of inputs and factors of differentiation

14.3 Landscape disruption

Overview on factors of disruption

14.4 Industry risks

Impact of key risks on business

15. Competitive Analysis

15.1 Companies profiled

Companies covered

15.2 Company ranking index

15.3 Market positioning of companies

Matrix on companies position and classification

15.4 AEEZO

AEEZO - Overview
AEEZO - Product / Service
AEEZO - Key offerings
SWOT

15.5 Aluratek Inc.

Aluratek Inc. - Overview
Aluratek Inc. - Product / Service
Aluratek Inc. - Key offerings
SWOT

15.6 Aura Home Inc.

Aura Home Inc. - Overview
Aura Home Inc. - Product / Service
Aura Home Inc. - Key offerings
SWOT

15.7 Creedon Technologies USA LLC

Creedon Technologies USA LLC - Overview
Creedon Technologies USA LLC - Product / Service
Creedon Technologies USA LLC - Key offerings
SWOT

15.8 Curtis International Ltd.

Curtis International Ltd. - Overview
Curtis International Ltd. - Product / Service
Curtis International Ltd. - Key offerings
SWOT

15.9 Eastman Kodak Co.

Eastman Kodak Co. - Overview
Eastman Kodak Co. - Business segments
Eastman Kodak Co. - Key offerings
Eastman Kodak Co. - Segment focus
SWOT

15.10 Koninklijke Philips NV

Koninklijke Philips NV - Overview
Koninklijke Philips NV - Business segments
Koninklijke Philips NV - Key news
Koninklijke Philips NV - Key offerings
Koninklijke Philips NV - Segment focus
SWOT

15.11 Monster Inc.

Monster Inc. - Overview
Monster Inc. - Product / Service
Monster Inc. - Key offerings
SWOT

15.12 NETGEAR Inc.

NETGEAR Inc. - Overview
NETGEAR Inc. - Business segments
NETGEAR Inc. - Key offerings
NETGEAR Inc. - Segment focus
SWOT

15.13 PhotoSpring Inc.

PhotoSpring Inc. - Overview
PhotoSpring Inc. - Product / Service
PhotoSpring Inc. - Key offerings
SWOT

15.14 Samsung Electronics Co. Ltd.

Samsung Electronics Co. Ltd. - Overview
Samsung Electronics Co. Ltd. - Business segments
Samsung Electronics Co. Ltd. - Key news
Samsung Electronics Co. Ltd. - Key offerings
Samsung Electronics Co. Ltd. - Segment focus
SWOT

15.15 Sony Group Corp.

Sony Group Corp. - Overview
Sony Group Corp. - Business segments
Sony Group Corp. - Key news
Sony Group Corp. - Key offerings
Sony Group Corp. - Segment focus
SWOT

15.16 Spheris Digital Ltd.

Spheris Digital Ltd. - Overview
Spheris Digital Ltd. - Product / Service
Spheris Digital Ltd. - Key offerings
SWOT

15.17 Sungale Inc.

Sungale Inc. - Overview
Sungale Inc. - Product / Service
Sungale Inc. - Key offerings
SWOT

15.18 ViewSonic Corp.

ViewSonic Corp. - Overview
ViewSonic Corp. - Product / Service
ViewSonic Corp. - Key offerings
SWOT

16. Appendix

16.1 Scope of the report

Market definition
Objectives
Notes and caveats

16.2 Inclusions and exclusions checklist

Inclusions checklist
Exclusions checklist

16.3 Currency conversion rates for US$

16.4 Research methodology

16.5 Data procurement

Information sources

16.6 Data validation

16.7 Validation techniques employed for market sizing

16.8 Data synthesis

16.9 360 degree market analysis

16.10 List of abbreviations

Research Methodology

Technavio presents a detailed picture of the market by way of study, synthesis, and summation of data from multiple sources. The analysts have presented the various facets of the market with a particular focus on identifying the key industry influencers. The data thus presented is comprehensive, reliable, and the result of extensive research, both primary and secondary.

INFORMATION SOURCES

Primary sources

  • Manufacturers and suppliers
  • Channel partners
  • Industry experts
  • Strategic decision makers

Secondary sources

  • Industry journals and periodicals
  • Government data
  • Financial reports of key industry players
  • Historical data
  • Press releases

DATA ANALYSIS

Data Synthesis

  • Collation of data
  • Estimation of key figures
  • Analysis of derived insights

Data Validation

  • Triangulation with data models
  • Reference against proprietary databases
  • Corroboration with industry experts

REPORT WRITING

Qualitative

  • Market drivers
  • Market challenges
  • Market trends
  • Five forces analysis

Quantitative

  • Market size and forecast
  • Market segmentation
  • Geographical insights
  • Competitive landscape

Interested in this report?

Get your sample now to see our research methodology and insights!

Download Now

Frequently Asked Questions

Digital Photo Frame market growth will increase by USD 126.4 million during 2026-2030.

The Digital Photo Frame market is expected to grow at a CAGR of 3.2% during 2026-2030.

Digital Photo Frame market is segmented by Distribution channel (Offline, Online) Source (Electricity-powered, Battery-powered) Application (Residential, Commercial)

AEEZO, Aluratek Inc., Aura Home Inc., Brookstone, Cozyla, Creedon Technologies USA LLC, Curtis International Ltd., Dragon Touch, Eastman Kodak Co., Koninklijke Philips NV, Monster Inc., NETGEAR Inc., PhotoSpring Inc., Samsung Electronics Co. Ltd., Skylight Home, Sony Group Corp., Spheris Digital Ltd., Sungale Inc., ViewSonic Corp., XElectron Technologies Ltd are a few of the key vendors in the Digital Photo Frame market.

North America will register the highest growth rate of 45.9% among the other regions. Therefore, the Digital Photo Frame market in North America is expected to garner significant business opportunities for the vendors during the forecast period.

US, Canada, Mexico, Germany, UK, France, Italy, Spain, The Netherlands, China, India, Japan, South Korea, Australia, Indonesia, Brazil, Argentina, Colombia, UAE, Saudi Arabia, South Africa, Egypt, Turkey

  • Integration of AI for seamless photo curation is the driving factor this market.

The Digital Photo Frame market vendors should focus on grabbing business opportunities from the Distribution channel segment as it accounted for the largest market share in the base year.
RIA - Research AI Assistant
Ask RIA