Enterprise App Store Market Analysis, Size, and Forecast 2026-2030: North America (US, Canada, and Mexico), Europe (Germany, UK, and France), APAC (China, India, and Japan), South America (Brazil, Argentina, and Colombia), Middle East and Africa (Saudi Arabia, UAE, and South Africa), and Rest of World (ROW)

Enterprise App Store Market Analysis, Size, and Forecast 2026-2030:
North America (US, Canada, and Mexico), Europe (Germany, UK, and France), APAC (China, India, and Japan), South America (Brazil, Argentina, and Colombia), Middle East and Africa (Saudi Arabia, UAE, and South Africa), and Rest of World (ROW)

Published: May 2026 282 Pages SKU: IRTNTR74475

Market Overview at a Glance

$8.22 B
Market Opportunity
22.5%
CAGR 2025 - 2030
36.9%
North America Growth
$3.09 B
Cloud segment 2024

Enterprise App Store Market Size 2026-2030

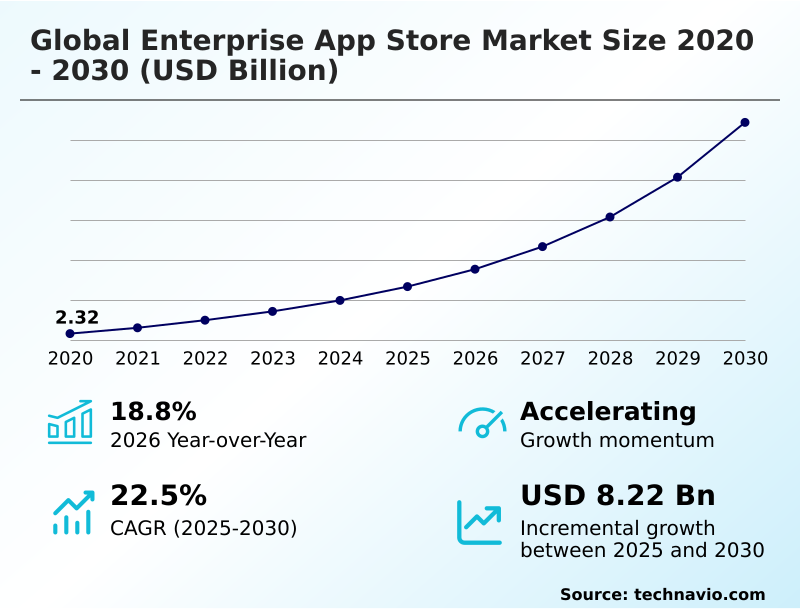
The Enterprise App Store Market size was valued at USD 4.67 billion in 2025, growing at a CAGR of 22.5% during the forecast period 2026-2030.

Major Market Trends & Insights

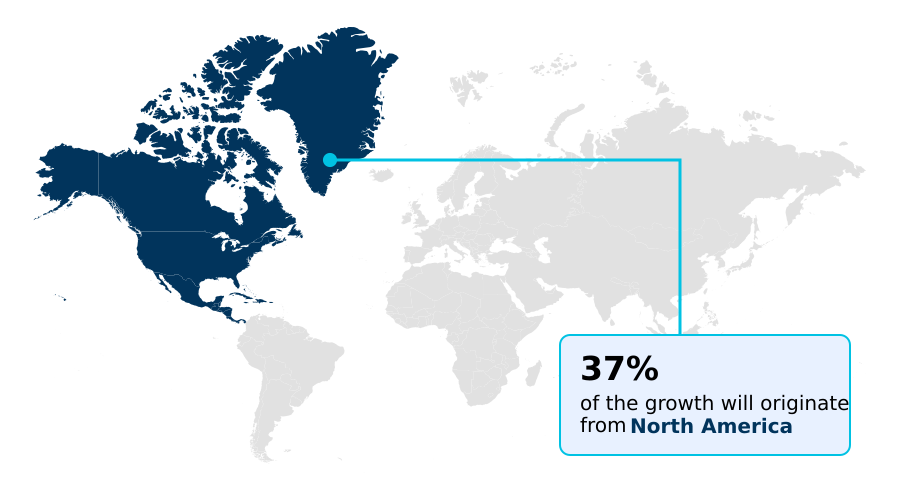
  • North America dominated the market and accounted for a 36.9% growth during the forecast period.
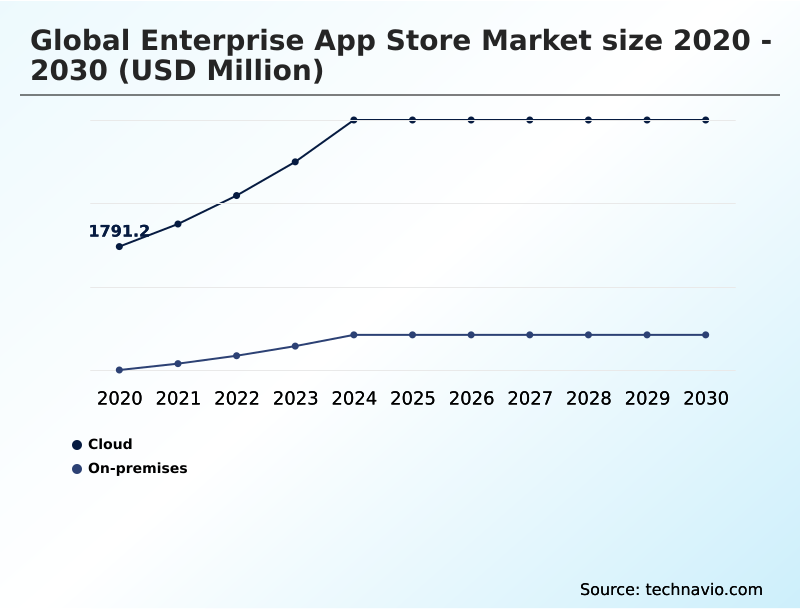
  • By Deployment - Cloud segment was valued at USD 3.09 billion in 2024
  • By Type - Large enterprises segment accounted for the largest market revenue share in 2024

Market Size & Forecast

  • Historic Market Opportunities 2020-2024: USD 10.57 billion
  • Market Future Opportunities 2025-2030: USD 8.22 billion
  • CAGR from 2025 to 2030 : 22.5%

Market Summary

  • The enterprise app store market is expanding at a significant rate, with a year-over-year growth of 18.8%, reflecting its critical role in modern IT governance.
  • In a typical business scenario, a multinational corporation streamlines its software procurement for over 50,000 employees by replacing decentralized purchasing with a single, curated app store, reducing onboarding time by 40% and cutting redundant license costs. This shift is primarily driven by the proliferation of cloud-native infrastructure, which demands centralized management to maintain security and efficiency.
  • However, the market faces a significant challenge from fragmented data sovereignty regulations across regions, which complicates the creation of a unified global application catalog. This regulatory complexity can increase administrative overhead by up to 25%, as organizations must ensure every application complies with local data laws, such as GDPR in Europe.
  • Consequently, the enterprise app store evolves as a strategic tool for balancing employee self-service with stringent corporate control and compliance.

What will be the Size of the Enterprise App Store Market during the forecast period?

Get Key Insights on Market Forecast (PDF) Request Free Sample

How is the Enterprise App Store Market Segmented?

The enterprise app store industry research report provides comprehensive data (region-wise segment analysis), with forecasts and analysis for the period 2026-2030, as well as historical data from 2020-2024 for the following segments.

  • Deployment
    • Cloud
    • On-premises
  • Type
    • Large enterprises
    • SMEs
  • Platform
    • iOS
    • Windows
    • Android
  • Geography
    • North America
      • US
      • Canada
      • Mexico
    • Europe
      • Germany
      • UK
      • France
    • APAC
      • China
      • India
      • Japan
    • South America
      • Brazil
      • Argentina
      • Colombia
    • Middle East and Africa
      • Saudi Arabia
      • UAE
      • South Africa
    • Rest of World (ROW)

How is the Enterprise App Store Market Segmented by Deployment?

The cloud segment is estimated to witness significant growth during the forecast period.

The cloud segment is the largest, representing over 78% of the market by 2026, due to its scalability and lower upfront costs compared to on-premises solutions.

Large enterprises dominate adoption, but SMEs are the fastest-growing segment, leveraging enterprise app stores to access sophisticated tools without large IT teams.

From a platform perspective, effective unified endpoint management and mobile device management are critical, as they form the basis for enforcing security policies.

Functionally, these stores are essential for effective software asset management and license compliance tracking, with role-based access control and single sign-on integration ensuring that users only access approved applications.

This centralized approach to enterprise software procurement streamlines operations and enhances security through granular access controls across infrastructure-as-a-service platforms.

Request Free Sample

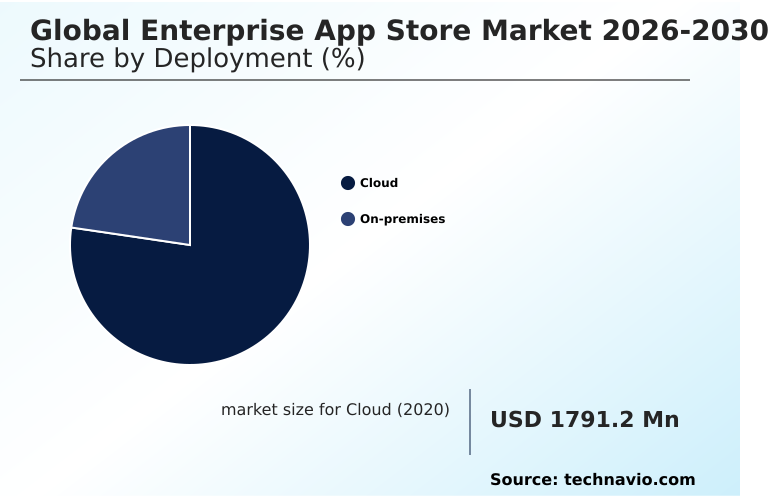
The Cloud segment was valued at USD 3.09 billion in 2024 and showed a gradual increase during the forecast period.

Request Free Sample

How demand for the Enterprise App Store market is rising in the leading region?

North America is estimated to contribute 36.9% to the growth of the global market during the forecast period.Technavio’s analysts have elaborately explained the regional trends and drivers that shape the market during the forecast period.

See How Enterprise App Store Market demand is rising in North America Request Free Sample

North America dominates the market, contributing 36.9% to the incremental growth, a rate approximately 14% higher than APAC's contribution.

This lead is driven by early adoption of cloud infrastructure and a mature enterprise mobility management culture in countries like the United States, which alone accounts for a substantial portion of regional demand.

In contrast, Europe focuses heavily on data privacy, leveraging private cloud marketplaces to ensure compliance.

A key difference is the prevalence of a bring-your-own-device policy in North America, which necessitates a different application lifecycle management strategy compared to regions with stricter corporate device mandates.

The use of a digital workspace platform with cross-platform compatibility and high-assurance applications is becoming standard, supported by a robust identity management framework and public cloud integration.

What are the key Drivers, Trends, and Challenges in the Enterprise App Store Market?

Our researchers analyzed the data with 2025 as the base year, along with the key drivers, trends, and challenges. A holistic analysis of drivers will help companies refine their marketing strategies to gain a competitive advantage.

  • Organizations evaluating the difference between an enterprise app store vs public app store often find the former provides a 50% greater degree of security and control. The primary value lies in creating a secure channel for curated applications, which is essential for enabling secure app distribution for remote workforce models that have seen a 70% increase in adoption.
  • Implementing best practices for enterprise app store governance is no longer optional; it is central to mitigating risks from unvetted software and managing SaaS sprawl. A key component of this governance is measuring ROI of an enterprise app store, where metrics go beyond cost savings to include productivity gains and reduced security incidents.
  • A common challenge involves integrating custom apps into enterprise stores, a process that requires clear API documentation and streamlined workflows to be successful. Without a well-defined strategy for managing these custom applications, companies risk creating isolated data silos, undermining the goal of a unified software ecosystem.
  • Ultimately, a properly managed enterprise store becomes a strategic asset, balancing the flexibility users demand with the security and oversight the organization requires, turning IT from a gatekeeper into an enabler of business agility.

What are the key market drivers leading to the rise in the adoption of Enterprise App Store Industry?

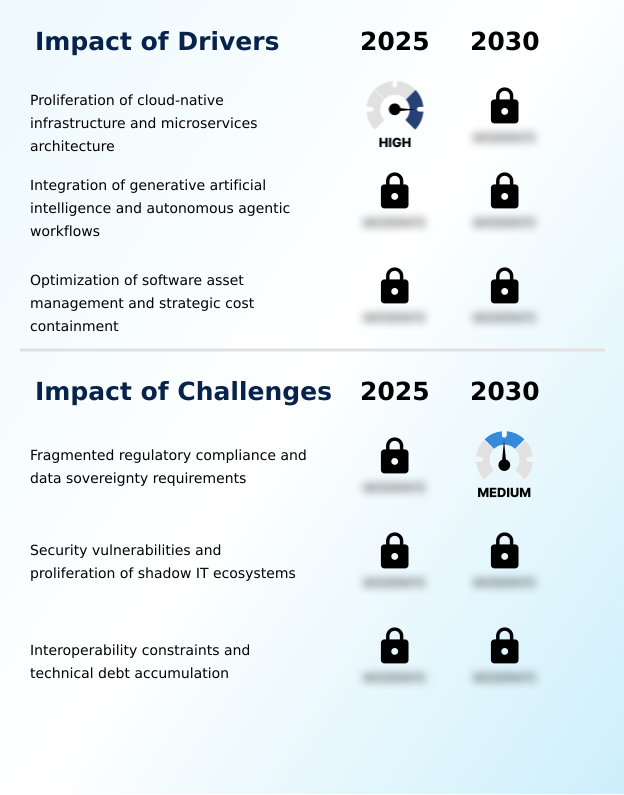
  • The market is primarily driven by the widespread proliferation of cloud-native infrastructure and microservices architecture, which necessitates centralized application management.

  • The primary market driver is the architectural shift to a cloud-native architecture, enabling organizations to achieve 30% faster application deployment times compared to monolithic systems.
  • This move toward microservices-based applications and containerization technology allows for greater agility and scalable software deployment.
  • The integration of generative AI through a sophisticated workflow automation engine is also a major force, with autonomous AI agents automating tasks that previously required significant human intervention, improving operational efficiency by over 20%.
  • This centralized administrative control within a unified digital workspace facilitates API-driven integration and agentic workflow deployment, creating a more cohesive and automated enterprise technology stack.

What are the market trends shaping the Enterprise App Store Industry?

  • A primary market trend is the strategic convergence of FinOps with marketplace procurement governance. This integration positions enterprise app stores as central tools for managing technology expenditures.

  • A dominant trend is the integration of finops principles, which has led to a 15% improvement in budget predictability for early adopters. This strategic procurement governance allows enterprises to align software acquisition with financial objectives, directly addressing challenges of uncontrolled SaaS spending.
  • The democratization of development through a low-code development platform is also reshaping the landscape, with a 25% increase in internally developed applications being distributed through these stores. This empowers non-technical staff to create and share tools, fostering a consumer-grade user experience and accelerating digital transformation initiatives.
  • By leveraging a self-service software portal, companies can manage software-as-a-service environments effectively, optimizing software license optimization and reducing technical debt.

What challenges does the Enterprise App Store Industry face during its growth?

  • A key challenge restraining market growth is the fragmented landscape of regulatory compliance and data sovereignty requirements across different regions.

  • A significant challenge is navigating the complex web of data sovereignty compliance, which can increase app deployment timelines by up to 40% due to varied regional requirements. This necessitates a robust application vetting process and regulatory compliance automation to maintain a resilient cybersecurity posture against evolving threats.
  • The proliferation of shadow IT, often stemming from interoperability constraints between core systems, remains a key vulnerability that a zero trust security model aims to address through secure software distribution. Organizations struggle with mobile application security and aim to avoid vendor lock-in by adopting more flexible platforms.
  • Failure to manage these security and compliance issues can negate the agility benefits that enterprise app stores are designed to provide.

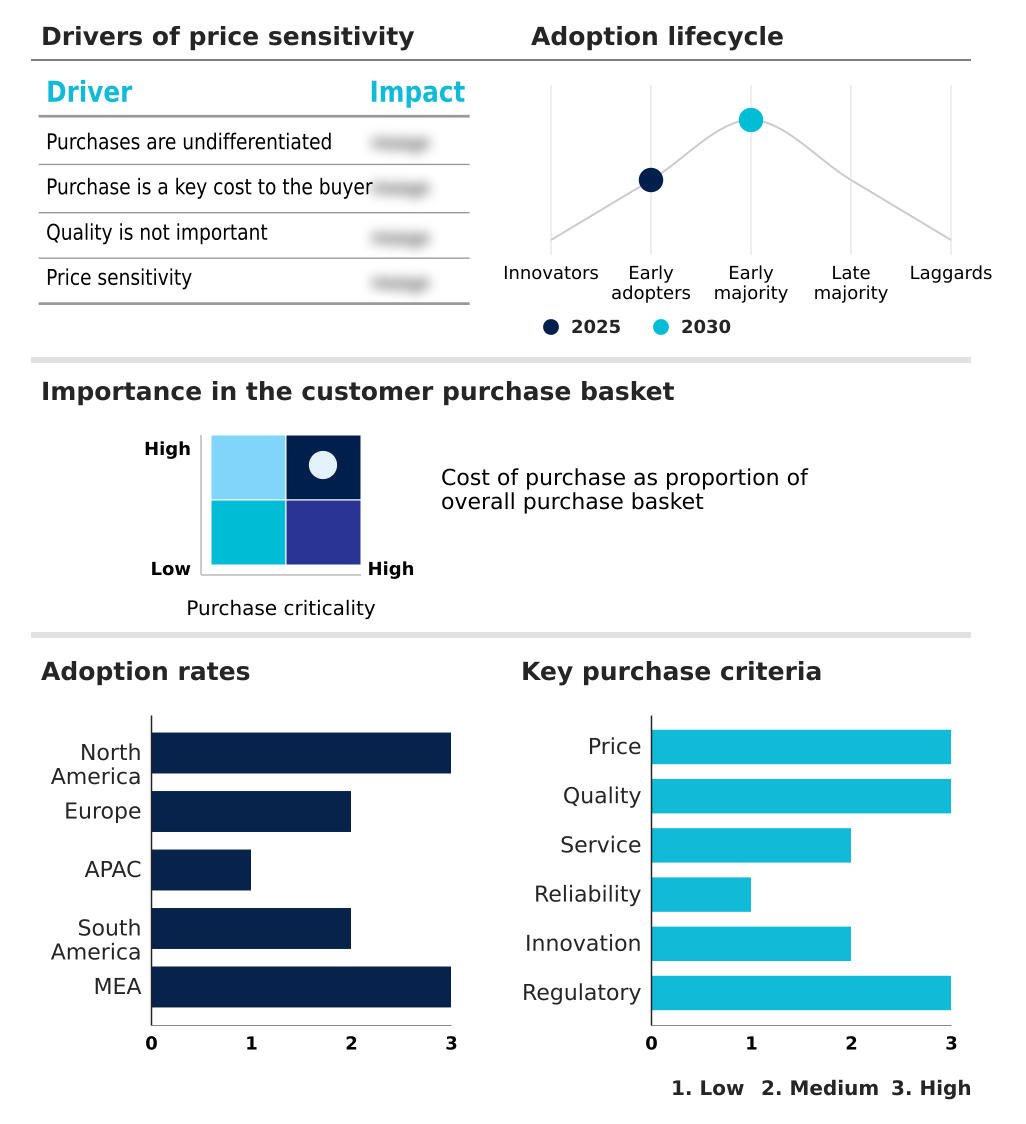
Exclusive Technavio Analysis on Customer Landscape

The enterprise app store market forecasting report includes the adoption lifecycle of the market, covering from the innovator’s stage to the laggard’s stage. It focuses on adoption rates in different regions based on penetration. Furthermore, the enterprise app store market report also includes key purchase criteria and drivers of price sensitivity to help companies evaluate and develop their market growth analysis strategies.

Customer Landscape of Enterprise App Store Industry

Competitive Landscape

Companies are implementing various strategies, such as strategic alliances, enterprise app store market forecast, partnerships, mergers and acquisitions, geographical expansion, and product/service launches, to enhance their presence in the industry.

42Gears Mobility Systems Ltd. - Offerings focus on unified platforms for curated software aggregation, secure application distribution, and centralized lifecycle management within enterprise ecosystems.

The industry research and growth report includes detailed analyses of the competitive landscape of the market and information about key companies, including:

  • 42Gears Mobility Systems Ltd.
  • AppDirect Inc.
  • Appian Corp.
  • BlackBerry Ltd.
  • Broadcom Inc.
  • Citrix Systems Inc.
  • Codeproof Technologies Inc.
  • Esper.io Inc.
  • IBM Corp.
  • Ivanti Software Inc.
  • Matrix42 GmbH
  • Microsoft Corp.
  • Miradore Oy
  • Mitsogo Inc.
  • Oracle Corp.
  • Relution GmbH
  • SAP SE
  • Sophos Group Ltd.
  • SOTI Inc.
  • Zoho Corp. Pvt. Ltd.

Qualitative and quantitative analysis of companies has been conducted to help clients understand the wider business environment as well as the strengths and weaknesses of key industry players. Data is qualitatively analyzed to categorize companies as pure play, category-focused, industry-focused, and diversified; it is quantitatively analyzed to categorize companies as dominant, leading, strong, tentative, and weak.

Market Intelligence Radar: High-Impact Developments & Growth Signals

  • In the Application Software industry, the increasing adoption of cloud-based and subscription-based software delivery models reinforces the role of enterprise app stores as the central management plane for controlling SaaS subscriptions and implementing FinOps strategies.
  • The rising automation of business processes through technologies like RPA and BPM has led to the creation of specialized categories within enterprise app stores for deploying pre-vetted autonomous AI agents and agentic workflow deployment tools.
  • Heightened data security concerns associated with cloud services have positioned enterprise app stores as a critical security layer, providing a single point for a resilient cybersecurity posture and centralized administrative control to mitigate shadow IT risks.
  • The push for advanced analytics in enterprises has driven demand for curated app stores that can securely deliver and manage sophisticated business intelligence tools, ensuring data governance and compliance through a self-service software portal.

Dive into Technavio’s robust research methodology, blending expert interviews, extensive data synthesis, and validated models for unparalleled Enterprise App Store Market insights. See full methodology.

Market Scope
Page number 282
Base year 2025
Historic period 2020-2024
Forecast period 2026-2030
Growth momentum & CAGR Accelerate at a CAGR of 22.5%
Market growth 2026-2030 USD 8217.0 million
Market structure Fragmented
YoY growth 2025-2026(%) 18.8%
Key countries US, Canada, Mexico, Germany, UK, France, Italy, Spain, The Netherlands, China, India, Japan, South Korea, Australia, Indonesia, Brazil, Argentina, Colombia, Saudi Arabia, UAE, South Africa, Egypt and Israel
Competitive landscape Leading Companies, Market Positioning of Companies, Competitive Strategies, and Industry Risks

Request Free Sample

Research Analyst Overview

  • The enterprise app store ecosystem is a complex network where cloud deployments account for over 75% of the market, highlighting a major shift from on-premises solutions. Technology suppliers, including major cloud infrastructure providers and OS developers, provide the foundational platforms.
  • Upon this foundation, solution providers such as unified endpoint management (UEM) specialists and enterprise software vendors like SAP and Oracle build and offer their curated marketplaces. These are distributed through direct sales channels and system integrators to end-users, primarily large enterprises and SMEs.
  • A key interaction involves the rigorous application vetting process, where apps are checked for security and compliance, a function that has reduced security incidents from unvetted software by an average of 30% for adopting firms.
  • Regulatory bodies and standards organizations indirectly influence the ecosystem by setting data privacy and security benchmarks that all stakeholders must adhere to, ensuring a governed, secure environment for software distribution.

What are the Key Data Covered in this Enterprise App Store Market Research and Growth Report?

  • What is the expected growth of the Enterprise App Store Market between 2026 and 2030?

    • The Enterprise App Store Market is expected to grow by USD 8.22 billion during 2026-2030, registering a CAGR of 22.5%. Year-over-year growth in 2026 is estimated at 18.8%%. This acceleration is shaped by proliferation of cloud-native infrastructure and microservices architecture , which is intensifying demand across multiple end-use verticals covered in the report.

  • What segmentation does the market report cover?

    • The report is segmented by Deployment (Cloud, and On-premises), Type (Large enterprises, and SMEs), Platform (iOS, Windows, and Android) and Geography (North America, Europe, APAC, South America, Middle East and Africa). Among these, the Cloud segment is estimated to witness significant growth during the forecast period, driven by rising adoption across key application areas. Each segment includes detailed qualitative and quantitative analysis, along with historical data from 2020-2024 and forecasts through 2030 with year-over-year growth rates.

  • Which regions are analyzed in the report?

    • The report covers North America, Europe, APAC, South America and Middle East and Africa. North America is estimated to contribute 36.9% to market growth during the forecast period. Country-level analysis includes US, Canada, Mexico, Germany, UK, France, Italy, Spain, The Netherlands, China, India, Japan, South Korea, Australia, Indonesia, Brazil, Argentina, Colombia, Saudi Arabia, UAE, South Africa, Egypt and Israel, with dedicated market size tables and year-over-year growth for each.

  • What are the key growth drivers and market challenges?

    • The primary driver is proliferation of cloud-native infrastructure and microservices architecture , which is accelerating investment and industry demand. The main challenge is fragmented regulatory compliance and data sovereignty requirements , creating operational barriers for key market participants. The report quantifies the impact of each driver and challenge across 2026 and 2030 with comparative analysis.

  • Who are the major players in the Enterprise App Store Market?

    • Key vendors include 42Gears Mobility Systems Ltd., AppDirect Inc., Appian Corp., BlackBerry Ltd., Broadcom Inc., Citrix Systems Inc., Codeproof Technologies Inc., Esper.io Inc., IBM Corp., Ivanti Software Inc., Matrix42 GmbH, Microsoft Corp., Miradore Oy, Mitsogo Inc., Oracle Corp., Relution GmbH, SAP SE, Sophos Group Ltd., SOTI Inc. and Zoho Corp. Pvt. Ltd.. The report provides qualitative and quantitative analysis categorizing companies as dominant, leading, strong, tentative, and weak based on their market positioning. Company profiles include business segment analysis, SWOT assessment, key offerings, and recent strategic developments.

Market Research Insights

  • The competitive landscape of the enterprise app store market is defined by platform consolidation, with the top 5 vendors accounting for over 60% of market share. Key players like Microsoft and SAP are enhancing their offerings by embedding AI and automation directly into their marketplaces.
  • For instance, Microsoft's integration of Copilot into its Azure Marketplace enables intelligent application discovery and governance, while SAP Store focuses on providing a curated selection of industry-specific extensions. These developments directly address enterprise demand for greater efficiency and streamlined workflow interoperability, allowing businesses to deploy complex solutions more rapidly. This strategic focus helps organizations manage the proliferation of SaaS tools.
  • However, vendors still face the challenge of navigating complex technical debt within customer environments, which can slow down the adoption of new, integrated platform features.

We can help! Our analysts can customize this enterprise app store market research report to meet your requirements.

Get in touch

1. Executive Summary

1.1 Market overview

Executive Summary - Chart on Market Overview
Executive Summary - Data Table on Market Overview
Executive Summary - Chart on Global Market Characteristics
Executive Summary - Chart on Market by Geography
Executive Summary - Chart on Market Segmentation by Deployment
Executive Summary - Chart on Market Segmentation by Type
Executive Summary - Chart on Market Segmentation by Platform
Executive Summary - Chart on Incremental Growth
Executive Summary - Data Table on Incremental Growth
Executive Summary - Chart on Company Market Positioning

2. Technavio Analysis

2.1 Analysis of price sensitivity, lifecycle, customer purchase basket, adoption rates, and purchase criteria

2.2 Criticality of inputs and Factors of differentiation

Chart on Overview on criticality of inputs and factors of differentiation

2.3 Factors of disruption

Chart on Overview on factors of disruption

2.4 Impact of drivers and challenges

Chart on Impact of drivers and challenges in 2025 and 2030

3. Market Landscape

3.1 Market ecosystem

Chart on Parent Market
Data Table on - Parent Market

3.2 Market characteristics

Chart on Market characteristics analysis

3.3 Value chain analysis

Chart on Value chain analysis

4. Market Sizing

4.1 Market definition

Data Table on Offerings of companies included in the market definition

4.2 Market segment analysis

Market segments

4.3 Market size 2025

4.4 Market outlook: Forecast for 2025-2030

Chart on Global - Market size and forecast 2025-2030 ($ million)
Data Table on Global - Market size and forecast 2025-2030 ($ million)
Chart on Global Market: Year-over-year growth 2025-2030 (%)
Data Table on Global Market: Year-over-year growth 2025-2030 (%)

5. Historic Market Size

5.1 Global Enterprise App Store Market 2020 - 2024

Historic Market Size - Data Table on Global Enterprise App Store Market 2020 - 2024 ($ million)

5.2 Deployment segment analysis 2020 - 2024

Historic Market Size - Deployment Segment 2020 - 2024 ($ million)

5.3 Type segment analysis 2020 - 2024

Historic Market Size - Type Segment 2020 - 2024 ($ million)

5.4 Platform segment analysis 2020 - 2024

Historic Market Size - Platform Segment 2020 - 2024 ($ million)

5.5 Geography segment analysis 2020 - 2024

Historic Market Size - Geography Segment 2020 - 2024 ($ million)

5.6 Country segment analysis 2020 - 2024

Historic Market Size - Country Segment 2020 - 2024 ($ million)

6. Qualitative Analysis

6.1 Impact of AI on Global Enterprise App Store Market

6.2 Impact of geopolitical conflicts on Global Enterprise App Store Market

7. Five Forces Analysis

7.1 Five forces summary

Five forces analysis - Comparison between 2025 and 2030

7.2 Bargaining power of buyers

Bargaining power of buyers - Impact of key factors 2025 and 2030

7.3 Bargaining power of suppliers

Bargaining power of suppliers - Impact of key factors in 2025 and 2030

7.4 Threat of new entrants

Threat of new entrants - Impact of key factors in 2025 and 2030

7.5 Threat of substitutes

Threat of substitutes - Impact of key factors in 2025 and 2030

7.6 Threat of rivalry

Threat of rivalry - Impact of key factors in 2025 and 2030

7.7 Market condition

Chart on Market condition - Five forces 2025 and 2030

8. Market Segmentation by Deployment

8.1 Market segments

Chart on Deployment - Market share 2025-2030 (%)
Data Table on Deployment - Market share 2025-2030 (%)

8.2 Comparison by Deployment

Chart on Comparison by Deployment
Data Table on Comparison by Deployment

8.3 Cloud - Market size and forecast 2025-2030

Chart on Cloud - Market size and forecast 2025-2030 ($ million)
Data Table on Cloud - Market size and forecast 2025-2030 ($ million)
Chart on Cloud - Year-over-year growth 2025-2030 (%)
Data Table on Cloud - Year-over-year growth 2025-2030 (%)

8.4 On-premises - Market size and forecast 2025-2030

Chart on On-premises - Market size and forecast 2025-2030 ($ million)
Data Table on On-premises - Market size and forecast 2025-2030 ($ million)
Chart on On-premises - Year-over-year growth 2025-2030 (%)
Data Table on On-premises - Year-over-year growth 2025-2030 (%)

8.5 Market opportunity by Deployment

Market opportunity by Deployment ($ million)
Data Table on Market opportunity by Deployment ($ million)

9. Market Segmentation by Type

9.1 Market segments

Chart on Type - Market share 2025-2030 (%)
Data Table on Type - Market share 2025-2030 (%)

9.2 Comparison by Type

Chart on Comparison by Type
Data Table on Comparison by Type

9.3 Large enterprises - Market size and forecast 2025-2030

Chart on Large enterprises - Market size and forecast 2025-2030 ($ million)
Data Table on Large enterprises - Market size and forecast 2025-2030 ($ million)
Chart on Large enterprises - Year-over-year growth 2025-2030 (%)
Data Table on Large enterprises - Year-over-year growth 2025-2030 (%)

9.4 SMEs - Market size and forecast 2025-2030

Chart on SMEs - Market size and forecast 2025-2030 ($ million)
Data Table on SMEs - Market size and forecast 2025-2030 ($ million)
Chart on SMEs - Year-over-year growth 2025-2030 (%)
Data Table on SMEs - Year-over-year growth 2025-2030 (%)

9.5 Market opportunity by Type

Market opportunity by Type ($ million)
Data Table on Market opportunity by Type ($ million)

10. Market Segmentation by Platform

10.1 Market segments

Chart on Platform - Market share 2025-2030 (%)
Data Table on Platform - Market share 2025-2030 (%)

10.2 Comparison by Platform

Chart on Comparison by Platform
Data Table on Comparison by Platform

10.3 iOS - Market size and forecast 2025-2030

Chart on iOS - Market size and forecast 2025-2030 ($ million)
Data Table on iOS - Market size and forecast 2025-2030 ($ million)
Chart on iOS - Year-over-year growth 2025-2030 (%)
Data Table on iOS - Year-over-year growth 2025-2030 (%)

10.4 Windows - Market size and forecast 2025-2030

Chart on Windows - Market size and forecast 2025-2030 ($ million)
Data Table on Windows - Market size and forecast 2025-2030 ($ million)
Chart on Windows - Year-over-year growth 2025-2030 (%)
Data Table on Windows - Year-over-year growth 2025-2030 (%)

10.5 Android - Market size and forecast 2025-2030

Chart on Android - Market size and forecast 2025-2030 ($ million)
Data Table on Android - Market size and forecast 2025-2030 ($ million)
Chart on Android - Year-over-year growth 2025-2030 (%)
Data Table on Android - Year-over-year growth 2025-2030 (%)

10.6 Market opportunity by Platform

Market opportunity by Platform ($ million)
Data Table on Market opportunity by Platform ($ million)

11. Customer Landscape

11.1 Customer landscape overview

Analysis of price sensitivity, lifecycle, customer purchase basket, adoption rates, and purchase criteria

12. Geographic Landscape

12.1 Geographic segmentation

Chart on Market share by geography 2025-2030 (%)
Data Table on Market share by geography 2025-2030 (%)

12.2 Geographic comparison

Chart on Geographic comparison
Data Table on Geographic comparison

12.3 North America - Market size and forecast 2025-2030

Chart on North America - Market size and forecast 2025-2030 ($ million)
Data Table on North America - Market size and forecast 2025-2030 ($ million)
Chart on North America - Year-over-year growth 2025-2030 (%)
Data Table on North America - Year-over-year growth 2025-2030 (%)
Chart on Regional Comparison - North America
Data Table on Regional Comparison - North America

12.3.1 US - Market size and forecast 2025-2030

Chart on US - Market size and forecast 2025-2030 ($ million)
Data Table on US - Market size and forecast 2025-2030 ($ million)
Chart on US - Year-over-year growth 2025-2030 (%)
Data Table on US - Year-over-year growth 2025-2030 (%)

12.3.2 Canada - Market size and forecast 2025-2030

Chart on Canada - Market size and forecast 2025-2030 ($ million)
Data Table on Canada - Market size and forecast 2025-2030 ($ million)
Chart on Canada - Year-over-year growth 2025-2030 (%)
Data Table on Canada - Year-over-year growth 2025-2030 (%)

12.3.3 Mexico - Market size and forecast 2025-2030

Chart on Mexico - Market size and forecast 2025-2030 ($ million)
Data Table on Mexico - Market size and forecast 2025-2030 ($ million)
Chart on Mexico - Year-over-year growth 2025-2030 (%)
Data Table on Mexico - Year-over-year growth 2025-2030 (%)

12.4 Europe - Market size and forecast 2025-2030

Chart on Europe - Market size and forecast 2025-2030 ($ million)
Data Table on Europe - Market size and forecast 2025-2030 ($ million)
Chart on Europe - Year-over-year growth 2025-2030 (%)
Data Table on Europe - Year-over-year growth 2025-2030 (%)
Chart on Regional Comparison - Europe
Data Table on Regional Comparison - Europe

12.4.1 Germany - Market size and forecast 2025-2030

Chart on Germany - Market size and forecast 2025-2030 ($ million)
Data Table on Germany - Market size and forecast 2025-2030 ($ million)
Chart on Germany - Year-over-year growth 2025-2030 (%)
Data Table on Germany - Year-over-year growth 2025-2030 (%)

12.4.2 UK - Market size and forecast 2025-2030

Chart on UK - Market size and forecast 2025-2030 ($ million)
Data Table on UK - Market size and forecast 2025-2030 ($ million)
Chart on UK - Year-over-year growth 2025-2030 (%)
Data Table on UK - Year-over-year growth 2025-2030 (%)

12.4.3 France - Market size and forecast 2025-2030

Chart on France - Market size and forecast 2025-2030 ($ million)
Data Table on France - Market size and forecast 2025-2030 ($ million)
Chart on France - Year-over-year growth 2025-2030 (%)
Data Table on France - Year-over-year growth 2025-2030 (%)

12.4.4 Italy - Market size and forecast 2025-2030

Chart on Italy - Market size and forecast 2025-2030 ($ million)
Data Table on Italy - Market size and forecast 2025-2030 ($ million)
Chart on Italy - Year-over-year growth 2025-2030 (%)
Data Table on Italy - Year-over-year growth 2025-2030 (%)

12.4.5 Spain - Market size and forecast 2025-2030

Chart on Spain - Market size and forecast 2025-2030 ($ million)
Data Table on Spain - Market size and forecast 2025-2030 ($ million)
Chart on Spain - Year-over-year growth 2025-2030 (%)
Data Table on Spain - Year-over-year growth 2025-2030 (%)

12.4.6 The Netherlands - Market size and forecast 2025-2030

Chart on The Netherlands - Market size and forecast 2025-2030 ($ million)
Data Table on The Netherlands - Market size and forecast 2025-2030 ($ million)
Chart on The Netherlands - Year-over-year growth 2025-2030 (%)
Data Table on The Netherlands - Year-over-year growth 2025-2030 (%)

12.5 APAC - Market size and forecast 2025-2030

Chart on APAC - Market size and forecast 2025-2030 ($ million)
Data Table on APAC - Market size and forecast 2025-2030 ($ million)
Chart on APAC - Year-over-year growth 2025-2030 (%)
Data Table on APAC - Year-over-year growth 2025-2030 (%)
Chart on Regional Comparison - APAC
Data Table on Regional Comparison - APAC

12.5.1 China - Market size and forecast 2025-2030

Chart on China - Market size and forecast 2025-2030 ($ million)
Data Table on China - Market size and forecast 2025-2030 ($ million)
Chart on China - Year-over-year growth 2025-2030 (%)
Data Table on China - Year-over-year growth 2025-2030 (%)

12.5.2 India - Market size and forecast 2025-2030

Chart on India - Market size and forecast 2025-2030 ($ million)
Data Table on India - Market size and forecast 2025-2030 ($ million)
Chart on India - Year-over-year growth 2025-2030 (%)
Data Table on India - Year-over-year growth 2025-2030 (%)

12.5.3 Japan - Market size and forecast 2025-2030

Chart on Japan - Market size and forecast 2025-2030 ($ million)
Data Table on Japan - Market size and forecast 2025-2030 ($ million)
Chart on Japan - Year-over-year growth 2025-2030 (%)
Data Table on Japan - Year-over-year growth 2025-2030 (%)

12.5.4 South Korea - Market size and forecast 2025-2030

Chart on South Korea - Market size and forecast 2025-2030 ($ million)
Data Table on South Korea - Market size and forecast 2025-2030 ($ million)
Chart on South Korea - Year-over-year growth 2025-2030 (%)
Data Table on South Korea - Year-over-year growth 2025-2030 (%)

12.5.5 Australia - Market size and forecast 2025-2030

Chart on Australia - Market size and forecast 2025-2030 ($ million)
Data Table on Australia - Market size and forecast 2025-2030 ($ million)
Chart on Australia - Year-over-year growth 2025-2030 (%)
Data Table on Australia - Year-over-year growth 2025-2030 (%)

12.5.6 Indonesia - Market size and forecast 2025-2030

Chart on Indonesia - Market size and forecast 2025-2030 ($ million)
Data Table on Indonesia - Market size and forecast 2025-2030 ($ million)
Chart on Indonesia - Year-over-year growth 2025-2030 (%)
Data Table on Indonesia - Year-over-year growth 2025-2030 (%)

12.6 South America - Market size and forecast 2025-2030

Chart on South America - Market size and forecast 2025-2030 ($ million)
Data Table on South America - Market size and forecast 2025-2030 ($ million)
Chart on South America - Year-over-year growth 2025-2030 (%)
Data Table on South America - Year-over-year growth 2025-2030 (%)
Chart on Regional Comparison - South America
Data Table on Regional Comparison - South America

12.6.1 Brazil - Market size and forecast 2025-2030

Chart on Brazil - Market size and forecast 2025-2030 ($ million)
Data Table on Brazil - Market size and forecast 2025-2030 ($ million)
Chart on Brazil - Year-over-year growth 2025-2030 (%)
Data Table on Brazil - Year-over-year growth 2025-2030 (%)

12.6.2 Argentina - Market size and forecast 2025-2030

Chart on Argentina - Market size and forecast 2025-2030 ($ million)
Data Table on Argentina - Market size and forecast 2025-2030 ($ million)
Chart on Argentina - Year-over-year growth 2025-2030 (%)
Data Table on Argentina - Year-over-year growth 2025-2030 (%)

12.6.3 Colombia - Market size and forecast 2025-2030

Chart on Colombia - Market size and forecast 2025-2030 ($ million)
Data Table on Colombia - Market size and forecast 2025-2030 ($ million)
Chart on Colombia - Year-over-year growth 2025-2030 (%)
Data Table on Colombia - Year-over-year growth 2025-2030 (%)

12.7 Middle East and Africa - Market size and forecast 2025-2030

Chart on Middle East and Africa - Market size and forecast 2025-2030 ($ million)
Data Table on Middle East and Africa - Market size and forecast 2025-2030 ($ million)
Chart on Middle East and Africa - Year-over-year growth 2025-2030 (%)
Data Table on Middle East and Africa - Year-over-year growth 2025-2030 (%)
Chart on Regional Comparison - Middle East and Africa
Data Table on Regional Comparison - Middle East and Africa

12.7.1 Saudi Arabia - Market size and forecast 2025-2030

Chart on Saudi Arabia - Market size and forecast 2025-2030 ($ million)
Data Table on Saudi Arabia - Market size and forecast 2025-2030 ($ million)
Chart on Saudi Arabia - Year-over-year growth 2025-2030 (%)
Data Table on Saudi Arabia - Year-over-year growth 2025-2030 (%)

12.7.2 UAE - Market size and forecast 2025-2030

Chart on UAE - Market size and forecast 2025-2030 ($ million)
Data Table on UAE - Market size and forecast 2025-2030 ($ million)
Chart on UAE - Year-over-year growth 2025-2030 (%)
Data Table on UAE - Year-over-year growth 2025-2030 (%)

12.7.3 South Africa - Market size and forecast 2025-2030

Chart on South Africa - Market size and forecast 2025-2030 ($ million)
Data Table on South Africa - Market size and forecast 2025-2030 ($ million)
Chart on South Africa - Year-over-year growth 2025-2030 (%)
Data Table on South Africa - Year-over-year growth 2025-2030 (%)

12.7.4 Egypt - Market size and forecast 2025-2030

Chart on Egypt - Market size and forecast 2025-2030 ($ million)
Data Table on Egypt - Market size and forecast 2025-2030 ($ million)
Chart on Egypt - Year-over-year growth 2025-2030 (%)
Data Table on Egypt - Year-over-year growth 2025-2030 (%)

12.7.5 Israel - Market size and forecast 2025-2030

Chart on Israel - Market size and forecast 2025-2030 ($ million)
Data Table on Israel - Market size and forecast 2025-2030 ($ million)
Chart on Israel - Year-over-year growth 2025-2030 (%)
Data Table on Israel - Year-over-year growth 2025-2030 (%)

12.8 Market opportunity by geography

Market opportunity by geography ($ million)
Data Tables on Market opportunity by geography ($ million)

13. Drivers, Challenges, and Opportunity

13.1 Market drivers

Proliferation of cloud-native infrastructure and microservices architecture
Integration of generative artificial intelligence and autonomous agentic workflows
Optimization of software asset management and strategic cost containment

13.2 Market challenges

Fragmented regulatory compliance and data sovereignty requirements
Security vulnerabilities and proliferation of shadow IT ecosystems
Interoperability constraints and technical debt accumulation

13.3 Impact of drivers and challenges

Impact of drivers and challenges in 2025 and 2030

13.4 Market opportunities

Strategic convergence of finops and marketplace procurement governance
Democratization of software creation via low-code and no-code distribution
Focus on employee experience and consumerization of enterprise technology

14. Competitive Landscape

14.1 Overview

14.2

Overview on criticality of inputs and factors of differentiation

14.3 Landscape disruption

Overview on factors of disruption

14.4 Industry risks

Impact of key risks on business

15. Competitive Analysis

15.1 Companies profiled

Companies covered

15.2 Company ranking index

15.3 Market positioning of companies

Matrix on companies position and classification

15.4 AppDirect Inc.

AppDirect Inc. - Overview
AppDirect Inc. - Product / Service
AppDirect Inc. - Key offerings
SWOT

15.5 Appian Corp.

Appian Corp. - Overview
Appian Corp. - Business segments
Appian Corp. - Key offerings
Appian Corp. - Segment focus
SWOT

15.6 BlackBerry Ltd.

BlackBerry Ltd. - Overview
BlackBerry Ltd. - Business segments
BlackBerry Ltd. - Key offerings
BlackBerry Ltd. - Segment focus
SWOT

15.7 Broadcom Inc.

Broadcom Inc. - Overview
Broadcom Inc. - Business segments
Broadcom Inc. - Key offerings
Broadcom Inc. - Segment focus
SWOT

15.8 Citrix Systems Inc.

Citrix Systems Inc. - Overview
Citrix Systems Inc. - Product / Service
Citrix Systems Inc. - Key offerings
SWOT

15.9 Esper.io Inc.

Esper.io Inc. - Overview
Esper.io Inc. - Product / Service
Esper.io Inc. - Key offerings
SWOT

15.10 IBM Corp.

IBM Corp. - Overview
IBM Corp. - Business segments
IBM Corp. - Key news
IBM Corp. - Key offerings
IBM Corp. - Segment focus
SWOT

15.11 Ivanti Software Inc.

Ivanti Software Inc. - Overview
Ivanti Software Inc. - Product / Service
Ivanti Software Inc. - Key offerings
SWOT

15.12 Matrix42 GmbH

Matrix42 GmbH - Overview
Matrix42 GmbH - Product / Service
Matrix42 GmbH - Key offerings
SWOT

15.13 Microsoft Corp.

Microsoft Corp. - Overview
Microsoft Corp. - Business segments
Microsoft Corp. - Key news
Microsoft Corp. - Key offerings
Microsoft Corp. - Segment focus
SWOT

15.14 Oracle Corp.

Oracle Corp. - Overview
Oracle Corp. - Business segments
Oracle Corp. - Key news
Oracle Corp. - Key offerings
Oracle Corp. - Segment focus
SWOT

15.15 SAP SE

SAP SE - Overview
SAP SE - Business segments
SAP SE - Key news
SAP SE - Key offerings
SAP SE - Segment focus
SWOT

15.16 Sophos Group Ltd.

Sophos Group Ltd. - Overview
Sophos Group Ltd. - Product / Service
Sophos Group Ltd. - Key offerings
SWOT

15.17 SOTI Inc.

SOTI Inc. - Overview
SOTI Inc. - Product / Service
SOTI Inc. - Key offerings
SWOT

15.18 Zoho Corp. Pvt. Ltd.

Zoho Corp. Pvt. Ltd. - Overview
Zoho Corp. Pvt. Ltd. - Product / Service
Zoho Corp. Pvt. Ltd. - Key offerings
SWOT

16. Appendix

16.1 Scope of the report

Market definition
Objectives
Notes and caveats

16.2 Inclusions and exclusions checklist

Inclusions checklist
Exclusions checklist

16.3 Currency conversion rates for US$

16.4 Research methodology

16.5 Data procurement

Information sources

16.6 Data validation

16.7 Validation techniques employed for market sizing

16.8 Data synthesis

16.9 360 degree market analysis

16.10 List of abbreviations

Research Methodology

Technavio presents a detailed picture of the market by way of study, synthesis, and summation of data from multiple sources. The analysts have presented the various facets of the market with a particular focus on identifying the key industry influencers. The data thus presented is comprehensive, reliable, and the result of extensive research, both primary and secondary.

INFORMATION SOURCES

Primary sources

  • Manufacturers and suppliers
  • Channel partners
  • Industry experts
  • Strategic decision makers

Secondary sources

  • Industry journals and periodicals
  • Government data
  • Financial reports of key industry players
  • Historical data
  • Press releases

DATA ANALYSIS

Data Synthesis

  • Collation of data
  • Estimation of key figures
  • Analysis of derived insights

Data Validation

  • Triangulation with data models
  • Reference against proprietary databases
  • Corroboration with industry experts

REPORT WRITING

Qualitative

  • Market drivers
  • Market challenges
  • Market trends
  • Five forces analysis

Quantitative

  • Market size and forecast
  • Market segmentation
  • Geographical insights
  • Competitive landscape

Interested in this report?

Get your sample now to see our research methodology and insights!

Download Now

Frequently Asked Questions

Enterprise App Store market growth will increase by USD 8217.0 million during 2026-2030.

The Enterprise App Store market is expected to grow at a CAGR of 22.5% during 2026-2030.

Enterprise App Store market is segmented by Deployment (Cloud, On-premises) Type (Large enterprises, SMEs) Platform (iOS, Windows, Android)

42Gears Mobility Systems Ltd., AppDirect Inc., Appian Corp., BlackBerry Ltd., Broadcom Inc., Citrix Systems Inc., Codeproof Technologies Inc., Esper.io Inc., IBM Corp., Ivanti Software Inc., Matrix42 GmbH, Microsoft Corp., Miradore Oy, Mitsogo Inc., Oracle Corp., Relution GmbH, SAP SE, Sophos Group Ltd., SOTI Inc., Zoho Corp. Pvt. Ltd. are a few of the key vendors in the Enterprise App Store market.

North America will register the highest growth rate of 36.9% among the other regions. Therefore, the Enterprise App Store market in North America is expected to garner significant business opportunities for the vendors during the forecast period.

US, Canada, Mexico, Germany, UK, France, Italy, Spain, The Netherlands, China, India, Japan, South Korea, Australia, Indonesia, Brazil, Argentina, Colombia, Saudi Arabia, UAE, South Africa, Egypt, Israel

  • Proliferation of cloud-native infrastructure and microservices architecture is the driving factor this market.

The Enterprise App Store market vendors should focus on grabbing business opportunities from the Deployment segment as it accounted for the largest market share in the base year.
RIA - Research AI Assistant
Ask RIA