US Fast Casual Restaurants Market Size 2026-2030
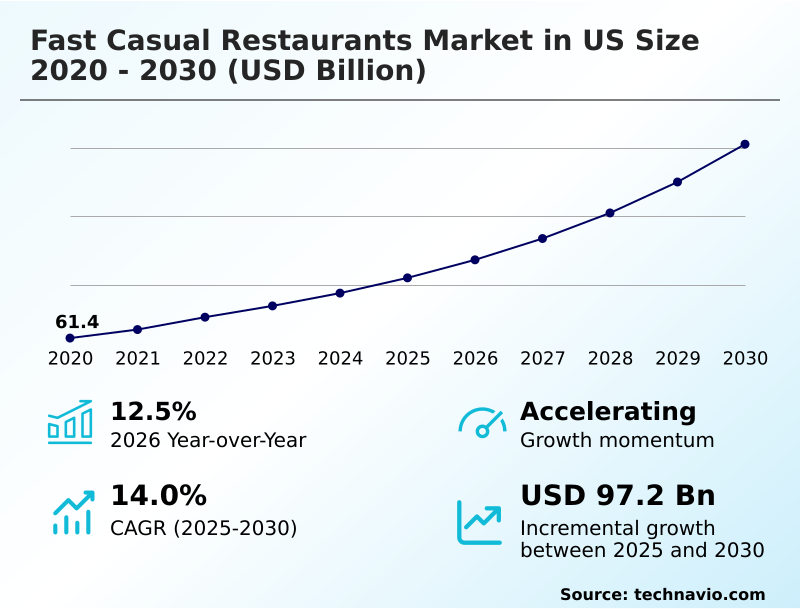
The us fast casual restaurants market size is valued to increase by USD 97.2 billion, at a CAGR of 14% from 2025 to 2030. Increasing consumer demand for health-conscious and nutritionally transparent offerings will drive the us fast casual restaurants market.
Major Market Trends & Insights
- By Channel - Dine-in segment was valued at USD 63.1 billion in 2024
- By Product - North American segment accounted for the largest market revenue share in 2024
Market Size & Forecast
- Market Opportunities: USD 141 billion
- Market Future Opportunities: USD 97.2 billion
- CAGR from 2025 to 2030 : 14%
Market Summary
- The fast casual restaurants market in us continues to evolve, driven by a fundamental consumer demand for meals that balance quality, convenience, and value. This sector's growth is propelled by the integration of digital ecosystems that streamline operations and enhance the customer experience. A key business scenario involves leveraging a unified commerce platform to manage a surge in off-premise dining.
- By integrating mobile orders, third-party delivery services, and in-store pickups, an operator can use predictive analytics to optimize kitchen workflows, reducing wait times by over 20% and improving order accuracy. This technological adoption is critical for managing challenges such as market saturation and labor volatility.
- Furthermore, the emphasis on premiumization and health-conscious consumption, featuring high-quality proteins and plant-forward menus, allows brands to command higher price points. Success in this landscape requires a dual focus on operational efficiency through back-of-house innovation and brand differentiation through culinary excellence and hyper-personalization, all while ensuring supply chain transparency to meet demands for sustainable sourcing.
What will be the Size of the US Fast Casual Restaurants Market during the forecast period?
Get Key Insights on Market Forecast (PDF) Get Free Sample
How is the US Fast Casual Restaurants Market Segmented?
The us fast casual restaurants industry research report provides comprehensive data (region-wise segment analysis), with forecasts and estimates in "USD billion" for the period 2026-2030, as well as historical data from 2020-2024 for the following segments.
- Channel
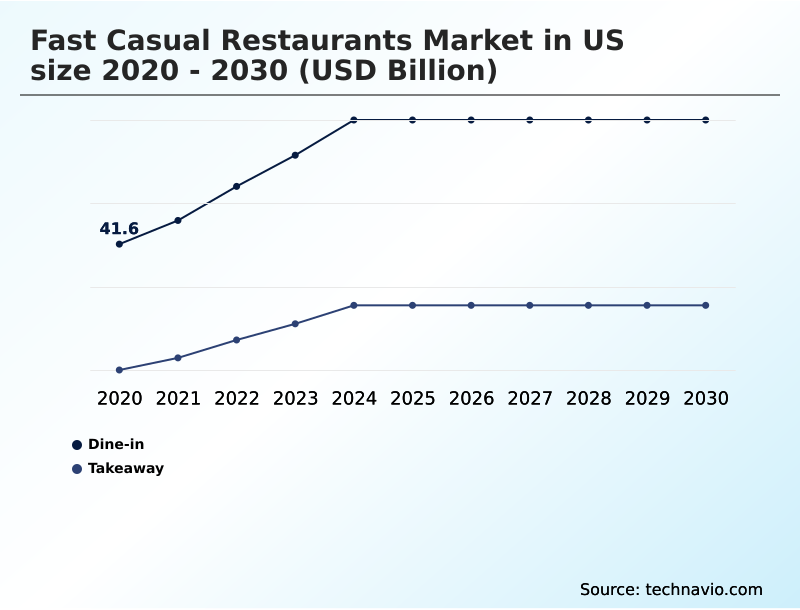
- Dine-in
- Takeaway
- Product
- North American
- Italian
- Mexican
- Others
- Application
- Franchised
- Standalone
- Geography
- North America
- US
- North America
By Channel Insights
The dine-in segment is estimated to witness significant growth during the forecast period.
The dine-in segment is foundational, providing a controlled environment for brand immersion. It leverages a counter service system focused on made-to-order preparations and culinary innovation. Success hinges on optimizing throughput rate during peak hours while maintaining high order accuracy.
The integration of data-driven loyalty programs facilitates hyper-personalization, using predictive analytics to power dynamic digital menu boards with personalized menu recommendations. This strategy directly impacts customer lifetime value.
For instance, operators using such analytics have seen a 15% improvement in marketing campaign effectiveness.
This focus on a technologically enhanced, efficient, and customized experience, including offerings like gluten-free grains and adherence to energy-efficient restaurant design, defines the modern dine-in channel's competitive edge in the market.
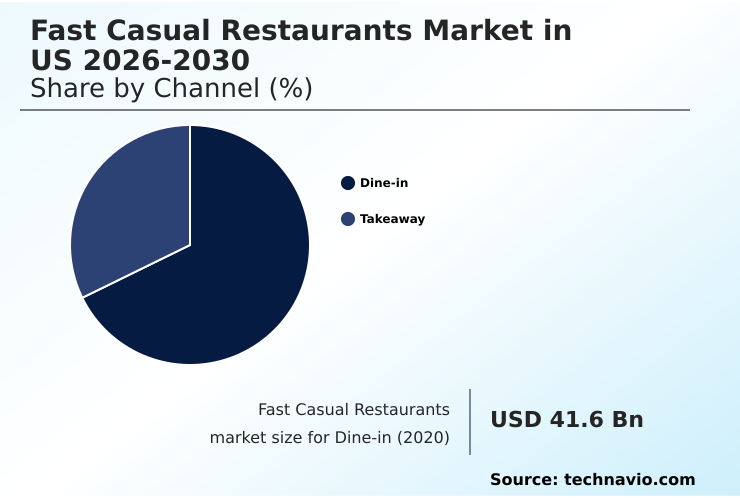
The Dine-in segment was valued at USD 63.1 billion in 2024 and showed a gradual increase during the forecast period.
Market Dynamics
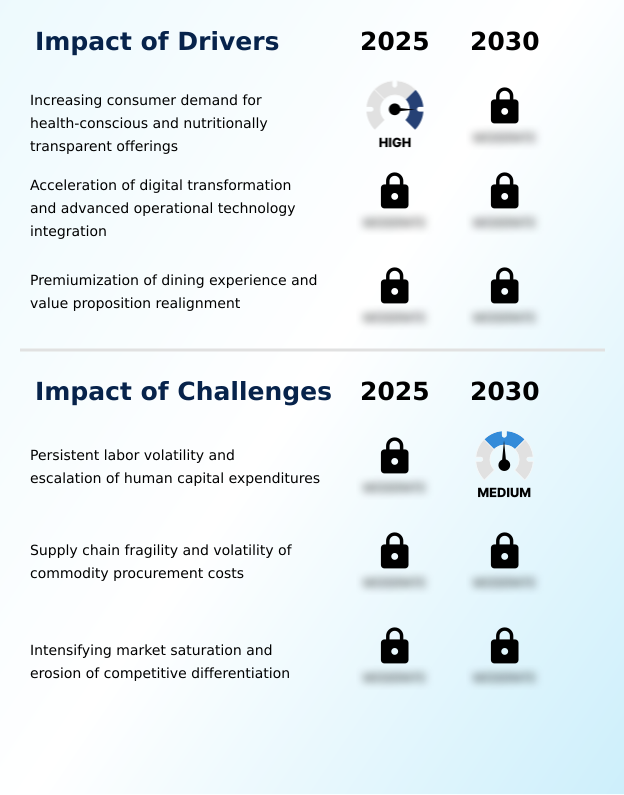
Our researchers analyzed the data with 2025 as the base year, along with the key drivers, trends, and challenges. A holistic analysis of drivers will help companies refine their marketing strategies to gain a competitive advantage.
- Successfully navigating the fast casual restaurants market in US 2026-2030 requires a multi-faceted approach. A primary focus is optimizing throughput for peak hours, which directly connects to balancing quality with speed of service. The customization impact on operational efficiency must be managed, often through technology adoption in franchised models and digital transformation for back-of-house operations.
- Integrating mobile apps with loyalty programs is crucial for enhancing customer experience with personalization and using customer data for menu engineering. This data-driven health-conscious menu development strategy is vital for differentiation. Another key area is improving order accuracy in off-premise dining, which is complicated by the impact of food delivery aggregators.
- Operators must navigate third-party delivery platform costs while ensuring a seamless experience. On the supply side, managing supply chain commodity volatility and reducing food waste with analytics are paramount. This includes implementing sustainable packaging solutions. For human resources, developing effective strategies for employee retention and training is essential to combat market pressures.
- Finally, strategic initiatives like leveraging geofencing for order timing, understanding the premiumization impact on check size, and developing methods for differentiating brands in a saturated market are critical for sustained growth. Firms that master these interconnected strategies are better positioned to thrive.
What are the key market drivers leading to the rise in the adoption of US Fast Casual Restaurants Industry?
- Increasing consumer demand for health-conscious food options and complete nutritional transparency serves as a key driver of market growth.
- Market growth is significantly driven by a dual focus on premiumization and health-conscious consumption. This value proposition realignment is attracting consumers willing to pay more for an elevated dining atmosphere and superior ingredients like high-quality proteins and artisanal breads.
- The rise of plant-based proteins and a general plant-forward menu strategy allows for greater dietary lifestyle accommodation. Brands are leveraging chef-driven collaborations to create excitement and differentiate their offerings, with limited-time offers driving traffic increases of over 15%.
- The ability to provide customizable meal options with clear nutritional transparency is crucial.
- AI-driven loyalty programs and predictive customer behavior modeling are enabling a new level of engagement, offering personalized menu recommendations that have been shown to increase average check size by 10%.
- This focus on convenient premium meals that align with modern wellness values continues to be a powerful catalyst for expansion in the fast casual sector.
What are the market trends shaping the US Fast Casual Restaurants Industry?
- The evolution toward omni-channel accessibility and a frictionless service architecture is a significant market trend, prioritizing a cohesive customer journey across both physical and digital restaurant environments.
- Key market trends are converging around sustainability and technology to create a more efficient and transparent operational model. The push for sustainable operational standards is leading to the adoption of circular economy principles, with some operators achieving near-zero-waste kitchen protocols through advanced data analytics for demand.
- This commitment extends to the supply chain, where blockchain for supply chain traceability provides unprecedented supply chain transparency. The integration of an omni-channel service architecture is creating hybrid restaurant formats that seamlessly blend physical and digital experiences, featuring digital-only pickup lanes and real-time order tracking.
- Technology such as geofencing technology is being used to synchronize meal readiness with customer arrival, improving food quality and reducing wait times by up to 35%. Furthermore, the move toward compostable packaging is now a baseline expectation, with 9 out of 10 consumers preferring brands with visible sustainability commitments.
- These trends are supported by unified commerce platforms that provide a holistic view of operations.
What challenges does the US Fast Casual Restaurants Industry face during its growth?
- Persistent labor market volatility and the corresponding escalation of human capital expenditures represent a primary challenge affecting industry growth.
- The market faces significant structural challenges, primarily labor volatility and high human capital expenditures, which are forcing a reevaluation of operational models. The persistent struggle for competitive differentiation in a landscape experiencing market saturation is another major hurdle.
- As off-premise dining growth continues, the complexities of third-party delivery integration and its impact on margins present an ongoing issue, with associated fees reducing profitability by up to 20% on delivery orders.
- Furthermore, supply chain fragility and volatile commodity procurement costs threaten menu stability, particularly for concepts reliant on specific global ingredients for offerings like build-your-own pasta bowls, fast-fired pizzas, poke bowls, and fast casual ramen. Effective customer journey mapping reveals that any disruption in these areas can lead to a significant decline in satisfaction.
- Operators must innovate to maintain quality and value amidst these pressures, as failure to do so can quickly erode brand loyalty in a highly competitive environment.
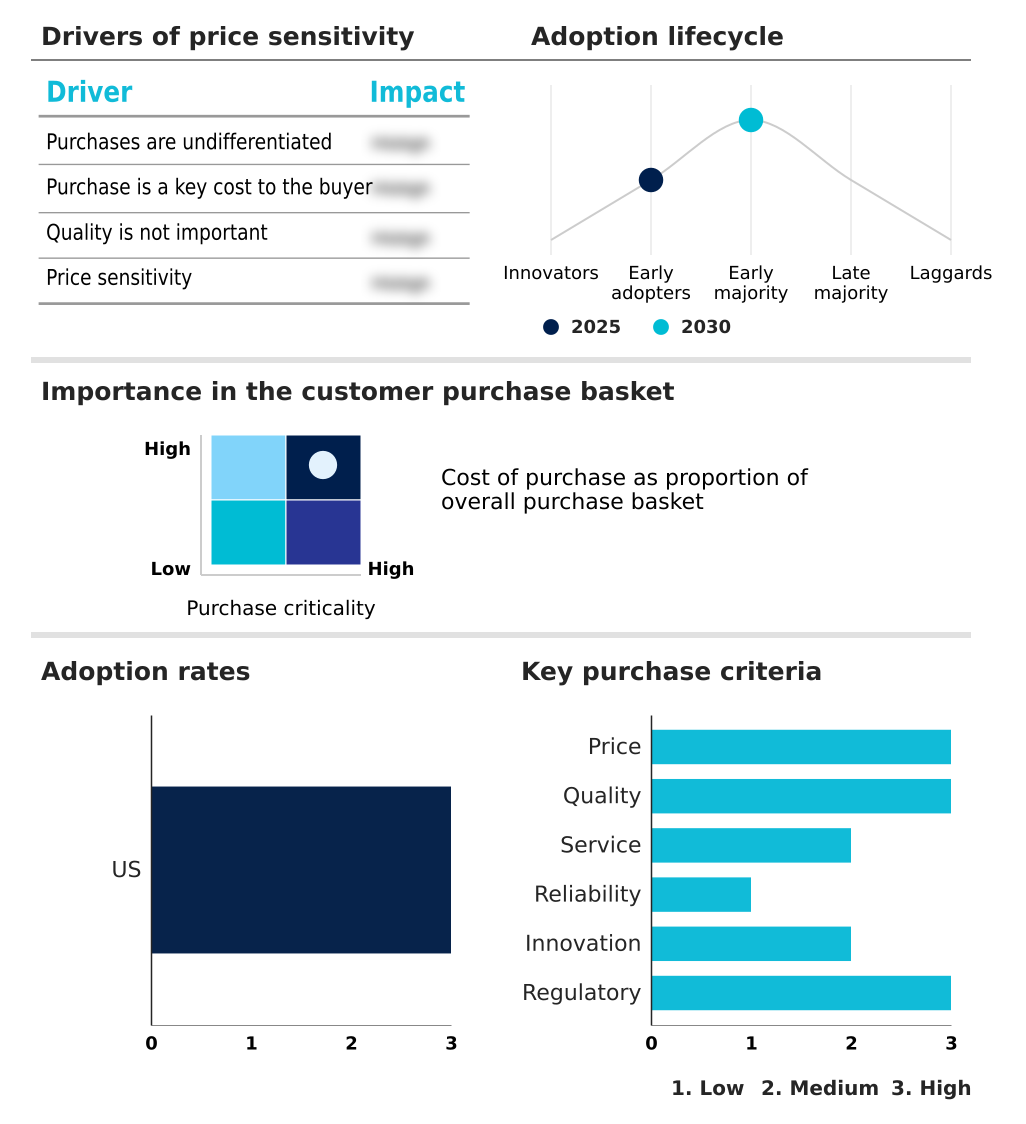
Exclusive Technavio Analysis on Customer Landscape
The us fast casual restaurants market forecasting report includes the adoption lifecycle of the market, covering from the innovator’s stage to the laggard’s stage. It focuses on adoption rates in different regions based on penetration. Furthermore, the us fast casual restaurants market report also includes key purchase criteria and drivers of price sensitivity to help companies evaluate and develop their market growth analysis strategies.
Customer Landscape of US Fast Casual Restaurants Industry
Competitive Landscape
Companies are implementing various strategies, such as strategic alliances, us fast casual restaurants market forecast, partnerships, mergers and acquisitions, geographical expansion, and product/service launches, to enhance their presence in the industry.
American Dairy Queen Corp. - Delivers customizable Mexican-inspired cuisine, including burritos and bowls, focusing on fresh ingredients within a fast-casual service framework.
The industry research and growth report includes detailed analyses of the competitive landscape of the market and information about key companies, including:
- American Dairy Queen Corp.
- Arbys IP Holder LLC
- Chick fil A Inc.
- Chipotle Mexican Grill Inc.
- Culvers Franchising System LLC
- Dig Inn
- Five Guys Enterprises LLC
- Honeygrow LLC
- Hungry Howie Pizza and Subs
- Inspire Brands Inc.
- Little Caesar Enterprises Inc.
- Mendocino Farms
- MOD Super Fast Pizza LLC
- Noodles and Co.
- Papa Johns International Inc.
- Potbelly Corp.
- Restaurant Brands Inc.
- Shake Shack Inc.
- The Wendys Co.
- Wingstop Inc.
Qualitative and quantitative analysis of companies has been conducted to help clients understand the wider business environment as well as the strengths and weaknesses of key industry players. Data is qualitatively analyzed to categorize companies as pure play, category-focused, industry-focused, and diversified; it is quantitatively analyzed to categorize companies as dominant, leading, strong, tentative, and weak.
Recent Development and News in Us fast casual restaurants market
- In November 2024, Chipotle Mexican Grill Inc. initiated its Recipe for Growth strategy, focusing on enhancing operational throughput and marketing effectiveness, which included the successful reintroduction of its Chicken al Pastor as a limited-time offering.
- In January 2025, Panera Bread advanced its Panera RISE transformation by launching Salad Stuffers, a new product category designed for portability, and appointed Patrick Coelho as Chief Development Officer to oversee portfolio modernization.
- In March 2025, Shake Shack Inc. announced a long-term strategic goal of operating 1,500 company-operated locations, supported by new construction processes that have reduced build costs by approximately 20%.
- In April 2025, Wingstop Inc. announced a partnership with a leading technology firm to deploy an AI-powered demand forecasting and inventory management system across its franchise network, aiming to optimize supply chain efficiency.
Dive into Technavio’s robust research methodology, blending expert interviews, extensive data synthesis, and validated models for unparalleled US Fast Casual Restaurants Market insights. See full methodology.
| Market Scope | |
|---|---|
| Page number | 179 |
| Base year | 2025 |
| Historic period | 2020-2024 |
| Forecast period | 2026-2030 |
| Growth momentum & CAGR | Accelerate at a CAGR of 14% |
| Market growth 2026-2030 | USD 97.2 billion |
| Market structure | Fragmented |
| YoY growth 2025-2026(%) | 12.5% |
| Key countries | US |
| Competitive landscape | Leading Companies, Market Positioning of Companies, Competitive Strategies, and Industry Risks |
Research Analyst Overview
- The fast casual restaurants market in us is defined by intense competition and rapid operational evolution, where success is dictated by a firm's ability to integrate advanced technology with superior culinary offerings.
- A core boardroom decision revolves around capital allocation for a complete technology overhaul, encompassing a unified commerce platform with branded mobile applications and self-service kiosks to enable omni-channel accessibility. This ecosystem must support frictionless service, from made-to-order preparations to digital order pickup and off-premise fulfillment, using geofencing technology for precision.
- Operationally, back-of-house automation through kitchen display systems and automated prep tools is critical for managing throughput rate and order accuracy, directly impacting customer lifetime value. Supply chain management has also become a focal point, with blockchain for supply chain traceability enabling carbon-neutral supply chains and sourcing of organic produce and high-quality proteins.
- This supports menu premiumization with offerings like artisanal breads, poke bowls, fast casual ramen, and wok-fired dishes. Simultaneously, predictive analytics and machine learning algorithms power hyper-personalization and data-driven loyalty programs, mitigating challenges like market saturation, labor volatility, and rising human capital expenditures. Firms that have adopted these integrated systems report a 25% reduction in commodity procurement waste.
What are the Key Data Covered in this US Fast Casual Restaurants Market Research and Growth Report?
-
What is the expected growth of the US Fast Casual Restaurants Market between 2026 and 2030?
-
USD 97.2 billion, at a CAGR of 14%
-
-
What segmentation does the market report cover?
-
The report is segmented by Channel (Dine-in, and Takeaway), Product (North American, Italian, Mexican, and Others), Application (Franchised, and Standalone) and Geography (North America)
-
-
Which regions are analyzed in the report?
-
North America
-
-
What are the key growth drivers and market challenges?
-
Increasing consumer demand for health-conscious and nutritionally transparent offerings, Persistent labor volatility and escalation of human capital expenditures
-
-
Who are the major players in the US Fast Casual Restaurants Market?
-
American Dairy Queen Corp., Arbys IP Holder LLC, Chick fil A Inc., Chipotle Mexican Grill Inc., Culvers Franchising System LLC, Dig Inn, Five Guys Enterprises LLC, Honeygrow LLC, Hungry Howie Pizza and Subs, Inspire Brands Inc., Little Caesar Enterprises Inc., Mendocino Farms, MOD Super Fast Pizza LLC, Noodles and Co., Papa Johns International Inc., Potbelly Corp., Restaurant Brands Inc., Shake Shack Inc., The Wendys Co. and Wingstop Inc.
-
Market Research Insights
- The market's dynamic nature is shaped by the strategic implementation of a sophisticated digital ecosystem. Effective customer journey mapping is now essential, with leading operators reporting a 25% increase in customer retention after optimizing digital touchpoints. The adoption of an omni-channel service architecture, integrating frictionless payment and real-time order tracking, has become a competitive necessity.
- This is particularly true given the off-premise dining growth, which requires seamless third-party delivery integration. Businesses that deploy hybrid restaurant formats with digital-only pickup lanes are seeing throughput improvements of up to 30% during peak hours.
- By leveraging data analytics for demand, operators can refine everything from staffing to inventory, creating a more resilient and profitable business model in a rapidly changing consumer landscape.
We can help! Our analysts can customize this us fast casual restaurants market research report to meet your requirements.
 RIA -
RIA - 
