Firewall As A Service Market Analysis North America, Europe, APAC, South America, Middle East and Africa - US, China, Germany, UK, Canada, Japan, France, UAE, India, Brazil - Size and Forecast 2024-2028

Firewall As A Service Market Analysis North America, Europe, APAC, South America, Middle East and Africa - US, China, Germany, UK, Canada, Japan, France, UAE, India, Brazil - Size and Forecast 2024-2028

Published: Nov 2024 166 Pages SKU: IRTNTR74270

Market Overview at a Glance

$3.10 B
Market Opportunity
31.8%
CAGR
23.7
YoY growth 2023-2024(%)

Firewall As A Service Market Size 2024-2028 

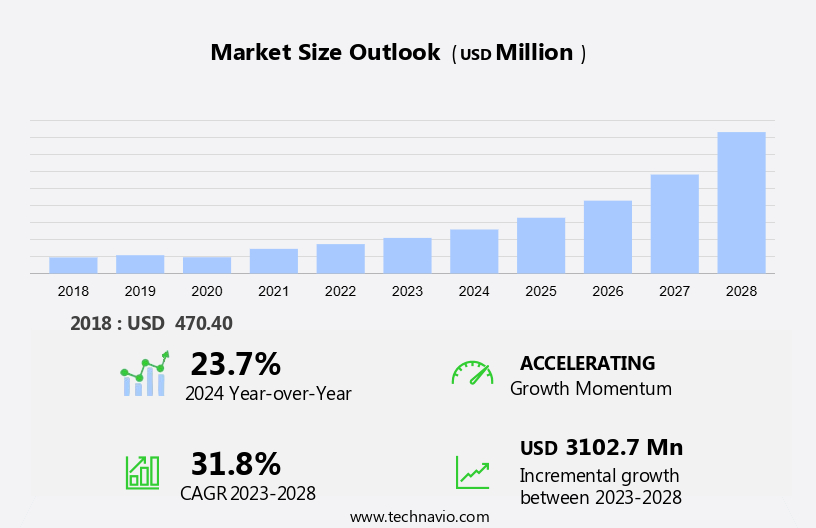
The firewall as a service market size is forecast to increase by USD 3.1 billion at a CAGR of 31.8% between 2023 and 2028.

  • In the digital business landscape, Enterprises are increasingly relying on Cloud environment and remote working models, leading to a surging demand for Network protection solutions. Traditional Physical firewalls are no longer sufficient to secure networks in this dynamic environment. Instead, Scalable and flexible Firewall as a Service (FwaaS) solutions are gaining traction. The adoption of cloud-based security services is on the rise due to their ease of deployment and ability to provide real-time threat detection. Moreover, the availability of open-source and free-of-cost security firewalls is further fueling the market growth. FwaaS offers enterprises the advantage of seamless integration with existing infrastructure, easy customization, and automatic updates, making it an ideal choice for securing networks in the cloud and hybrid environments. The market is expected to witness significant growth in the coming years, driven by these trends and the need for robust Network security solutions.

What will be the Size of the Market During the Forecast Period?

Firewall As A Service Market Size

 Request Free Sample

  • The market has emerged as a critical solution for enterprises seeking to fortify their network security in today's complex and dynamic IT landscape. With the increasing adoption of cloud environments, remote working models, and dispersed networks, traditional firewall solutions are no longer sufficient to protect against unauthorized strikes and network vulnerabilities. FwaaS offers several advantages over physical firewalls, including simplified installation, centralized policy management, and automation and orchestration capabilities. These features enable enterprises to deploy scalable solutions that adapt to their evolving network security needs.
  • In the cloud environment, FwaaS plays a pivotal role in securing Infrastructure as a Service (IaaS) and Platform as a Service (PaaS) offerings. Next-generation firewalls (NGFW) integrated with FwaaS provide advanced security features such as intrusion prevention, application control, and threat intelligence, ensuring robust protection against cyber threats. Enterprises benefit from FwaaS through various service models, including managed services and professional services. Managed services offer ongoing monitoring, management, and maintenance of the firewall infrastructure, while professional services provide consultation, design, and implementation support. FwaaS is particularly relevant for enterprises operating in a cloud computing era, where network security is a top priority.

How is this market segmented and which is the largest segment?

The market research report provides comprehensive data (region-wise segment analysis), with forecasts and estimates in "USD million" for the period 2024-2028, as well as historical data from 2018-2022 for the following segments.

  • End-user
    • BFSI
    • Healthcare
    • Retail
    • Education
    • Others
  • Geography
    • North America
      • Canada
      • US
    • Europe
      • Germany
      • UK
      • France
    • APAC
      • China
      • India
      • Japan
    • South America
      • Brazil
    • Middle East and Africa

By End-user Insights

  • The BFSI segment is estimated to witness significant growth during the forecast period.

The Firewall as a Service (FaaS) market in the banking, financial services, and insurance (BFSI) sector is experiencing significant growth due to the heightened importance of safeguarding customer data confidentiality. With the surge in online transactions, the risk of data breaches, phishing attacks, and other cyber threats has escalated. In response, the BFSI sector is strengthening its internal security and embracing FaaS solutions to counteract these threats. The proliferation of mobile devices and the increasing popularity of mobile banking among end-users further amplify the need for robust cybersecurity measures. FaaS solutions offer corporate flexibility, enabling organizations to adapt to the demands of dispersed networks and remote work environments.

Cloud computing technology powers these services, allowing for customizable solutions that can be easily integrated into existing network equipment. The future of network security lies in the adoption of advanced technologies like Artificial Intelligence (AI) to enhance threat detection and response capabilities. FaaS solutions provide an effective and scalable response to the evolving cybersecurity landscape.

Firewall As A Service Market Size

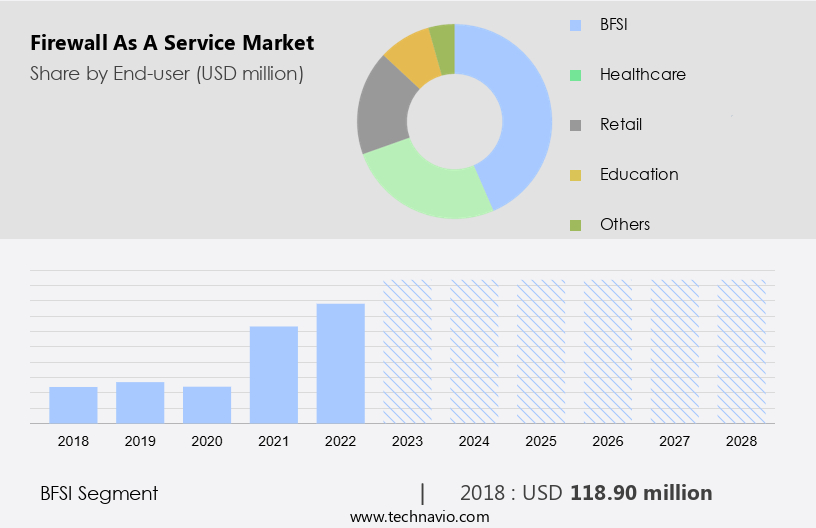
Get a glance at the market report of share of various segments Request Free Sample

The BFSI segment was valued at USD 118.90 million in 2018 and showed a gradual increase during the forecast period.

Regional Analysis

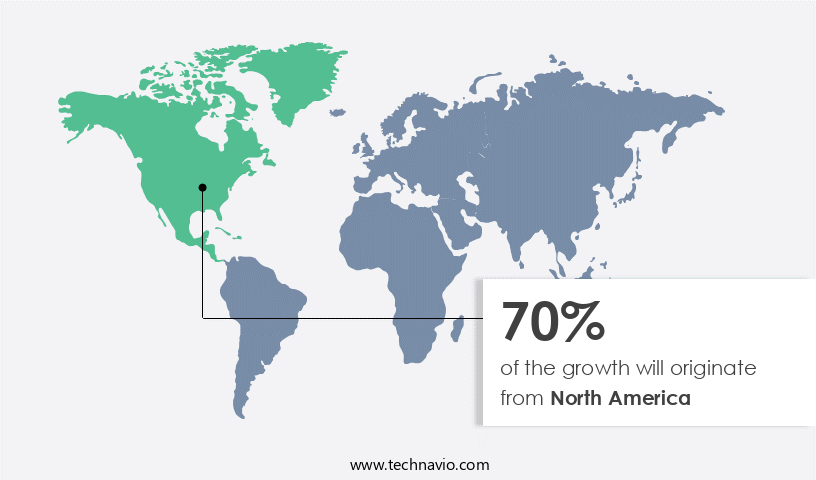
  • North America is estimated to contribute 70% to the growth of the global market during the forecast period.

Technavio's analysts have elaborately explained the regional trends and drivers that shape the market during the forecast period.

Firewall As A Service Market Share by Geography

For more insights on the market share of various regions Request Free Sample

In North America, the Firewall as a Service (FaaS) market is poised for continuous expansion due to the escalating need for cybersecurity solutions and the expanding use of bring-your-own-device (BYOD) policies and Internet of Things (IoT) devices. The proliferation of IoT in industries such as utilities, healthcare, and automotive is intensifying security concerns among end-users. In the US, the consumer electronics and wearables sectors, particularly in gaming, healthcare, and entertainment, are significant drivers of the FaaS market growth. Given the increasing reliance on efficient and dependable communication networks for business processes, all industries are striving for the Internet of Everything (IoE) integration.

Market Dynamics

Our researchers analyzed the data with 2023 as the base year, along with the key drivers, trends, and challenges. A holistic analysis of drivers will help companies refine their marketing strategies to gain a competitive advantage.

What are the key market drivers leading to the rise in adoption of Firewall As A Service Market?

Growing need for network security and privacy is the key driver of the market.

  • In today's digital landscape, enterprises across various sectors, including finance, healthcare, retail, telecommunications, and manufacturing, are integrating technologies such as IoT and big data analytics to enhance productivity and streamline operations. The adoption of cloud solutions and the increasing use of digital sensors in production and manufacturing facilities have led to significant advancements. However, these technological innovations also introduce new security challenges. Threats like distributed denial-of-service (DDoS) attacks and malicious controllers and applications pose a significant risk to enterprise networks. To mitigate these risks, businesses are prioritizing network security and data privacy. Firewall as a Service (FaaS) is an attractive solution for enterprises seeking simplified installation, automation, and orchestration of security management.

    Managed and professional services offerings from leading providers enable enterprises to choose the most suitable service models based on their unique requirements. Infrastructure as a Service (IaaS) and Platform as a Service (PaaS) are popular deployment options for FaaS, allowing enterprises to scale their security solutions as needed. By partnering with trusted managed security service providers, enterprises can ensure their network remains secure and their data remains private, enabling them to focus on their core business objectives.

What are the market trends shaping the Firewall As A Service Market?

Adoption of cloud-based services is the upcoming trend in the market.

  • In today's business landscape, enterprises are increasingly relying on cloud-based security services to safeguard their network in various deployment models. With the rise of remote working models, the need for secure network protection has become more critical than ever. Cloud environments offer scalable solutions that cater to the varying security needs of businesses, making them an attractive option for network security. As more and more establishments, such as financial institutions and healthcare providers, move their sensitive data to the cloud, securing this information from unauthorized access becomes paramount. Cloud-based security services provide a cost-effective solution for small and medium-sized enterprises (SMEs) as they do not require on-premises infrastructure for implementation.

    The flexibility and adaptability of cloud-based security solutions enable them to accommodate the evolving security requirements of consumers. Moreover, the adoption of cloud-based services for business functions like customer relationship management (CRM), payroll, and enterprise communication ensures seamless remote access to data. In conclusion, the shift towards cloud-based services for network security is a trend that is here to stay. The benefits of cost-effectiveness, flexibility, and scalability make cloud-based security solutions an indispensable component of an organization's security strategy.

What challenges does Firewall As A Service Market face during the growth?

Availability of open-source and free-of-cost security firewalls is a key challenge affecting the market growth.

  • Firewalls as a Service (FaaS) is a security solution offered through Software as a Service (SaaS) model, which allows businesses to protect their data and infrastructure in Public, Private, and Hybrid cloud environments. The monthly subscription cost for FaaS ranges from USD 150 to USD 300. While this expense is higher than traditional security solutions, it's essential for enterprises to secure their digital assets against cyber threats, including malware and ransomware attacks. However, smaller entities and individual customers with budget constraints prefer free or open-source firewalls. These solutions, developed and distributed by organizations or communities, pose a challenge to the expansion of the FaaS market.

    To cater to diverse business requirements, FaaS providers offer customizable solutions, ensuring optimal security for various industries such as Energy and Utilities, Retail and eCommerce, Telecommunication, IT and ITES, and Remote location access.

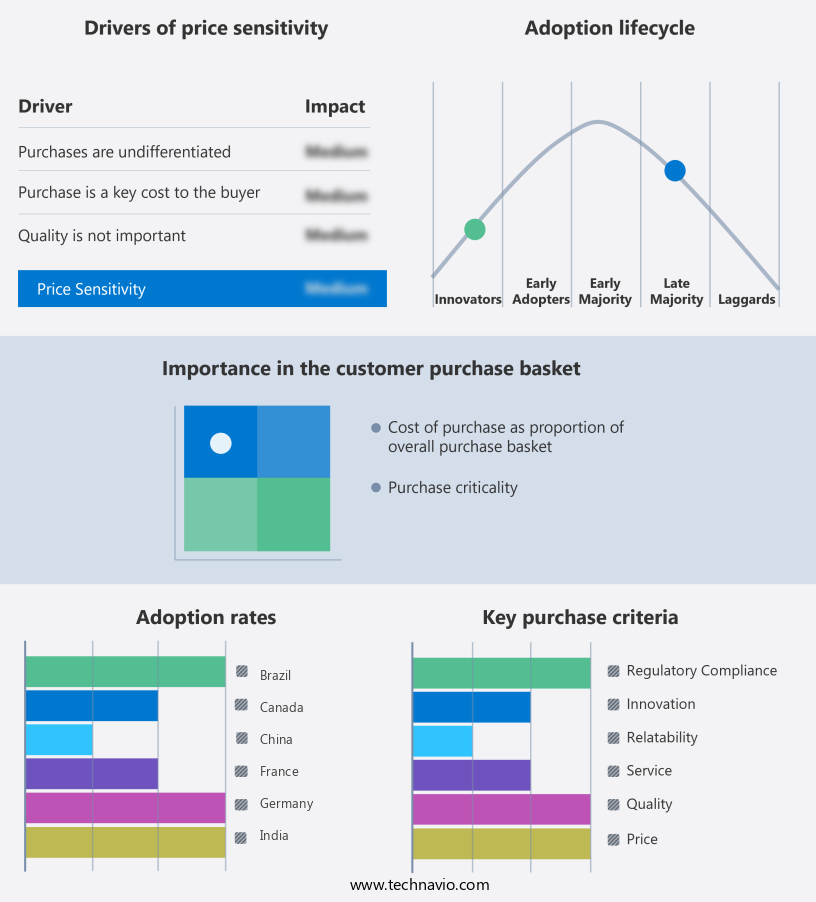
Exclusive Customer Landscape

The market forecasting report includes the adoption lifecycle of the market, covering from the innovator's stage to the laggard's stage. It focuses on adoption rates in different regions based on penetration. Furthermore, the market report also includes key purchase criteria and drivers of price sensitivity to help companies evaluate and develop their market growth analysis strategies.

Firewall As A Service Market Share by Geography

 Customer Landscape

Key Companies & Market Insights

Companies are implementing various strategies, such as strategic alliances, market forecast, partnerships, mergers and acquisitions, geographical expansion, and product/service launches, to enhance their presence in the market.

The market research and growth report includes detailed analyses of the competitive landscape of the market and information about key companies, including:

  • AlgoSec Inc.
  • Barracuda Networks Inc.
  • Cato Networks Ltd.
  • Check Point Software Technologies Ltd.
  • Cisco Systems Inc.
  • F5 Inc.
  • FireMon LLC
  • Forcepoint LLC
  • Fortinet Inc.
  • Juniper Networks Inc.
  • Palo Alto Networks Inc.
  • Skybox Security Inc.
  • SonicWall Inc.
  • Sophos Ltd.
  • Spitfire Technology Group
  • WatchGuard Technologies Inc.
  • Zscaler Inc.

Qualitative and quantitative analysis of companies has been conducted to help clients understand the wider business environment as well as the strengths and weaknesses of key market players. Data is qualitatively analyzed to categorize companies as pure play, category-focused, industry-focused, and diversified; it is quantitatively analyzed to categorize companies as dominant, leading, strong, tentative, and weak.

Research Analyst Overview

Firewalls as a Service (FaaS) is a cloud-based network security solution that offers enterprises simplified installation, automation, and orchestration for their security management needs. In today's digital landscape, enterprises require scalable solutions for network protection in various deployment models, including Infrastructure-as-a-Service (IaaS), Platform-as-a-Service (PaaS), and Software-as-a-Service (SaaS). FaaS caters to enterprises operating in diverse industry verticals such as retail and ecommerce, telecommunications, IT and ITes, energy and utilities, healthcare, and more. FaaS provides advanced threat protection against cyberattacks, ransomware, fraudulent activities, and other malicious threats in public, private, and hybrid cloud environments. It offers customizable solutions that cater to the unique needs of large enterprises, enabling them to secure their dispersed networks and remote location access. FaaS integrates seamlessly with network equipment and operating systems, providing traffic control and identity management features. Furthermore, it leverages artificial intelligence (AI) and machine learning algorithms to enhance security services and ensure corporate flexibility in remote work models.

Market Scope

Report Coverage

Details

Page number

166

Base year

2023

Historic period

2018-2022

Forecast period

2024-2028

Growth momentum & CAGR

Accelerate at a CAGR of 31.8%

Market growth 2024-2028

USD 3.10 billion

Market structure

Fragmented

YoY growth 2023-2024(%)

23.7

Key countries

US, China, Germany, UK, Canada, Japan, France, UAE, India, and Brazil

Competitive landscape

Leading Companies, Market Positioning of Companies, Competitive Strategies, and Industry Risks

Request Free Sample

What are the Key Data Covered in this Market Research and Growth Report?

  • CAGR of the market during the forecast period
  • Detailed information on factors that will drive the market growth and forecasting between 2024 and 2028
  • Precise estimation of the size of the market  and its contribution of the market in focus to the parent market
  • Accurate predictions about upcoming market growth and trends and changes in consumer behaviour
  • Growth of the market across North America, Europe, APAC, South America, and Middle East and Africa
  • Thorough analysis of the market's competitive landscape and detailed information about companies
  • Comprehensive analysis of factors that will challenge the growth of market companies

We can help! Our analysts can customize this market research report to meet your requirements. Get in touch

1 Executive Summary

  • 1.1 Market overview
    • Executive Summary - Chart on Market Overview
    • Executive Summary - Data Table on Market Overview
    • Executive Summary - Chart on Global Market Characteristics
    • Executive Summary - Chart on Market by Geography
    • Executive Summary - Chart on Market Segmentation by End-user
    • Executive Summary - Chart on Incremental Growth
    • Executive Summary - Data Table on Incremental Growth
    • Executive Summary - Chart on Company Market Positioning

2 Technavio Analysis

  • 2.1 Analysis of price sensitivity, lifecycle, customer purchase basket, adoption rates, and purchase criteria
    • Analysis of price sensitivity, lifecycle, customer purchase basket, adoption rates, and purchase criteria
  • 2.2 Criticality of inputs and Factors of differentiation
    • Overview on criticality of inputs and factors of differentiation
  • 2.3 Factors of disruption
    • Overview on factors of disruption
  • 2.4 Impact of drivers and challenges
    • Impact of drivers and challenges in 2023 and 2028

3 Market Landscape

  • 3.1 Market ecosystem
    • Parent Market
    • Data Table on - Parent Market
  • 3.2 Market characteristics
    • Market characteristics analysis
  • 3.3 Value chain analysis
    • Value Chain Analysis

4 Market Sizing

  • 4.1 Market definition
    • Offerings of companies included in the market definition
  • 4.2 Market segment analysis
    • Market segments
  • 4.3 Market size 2023
    • 4.4 Market outlook: Forecast for 2023-2028
      • Chart on Global - Market size and forecast 2023-2028 ($ million)
      • Data Table on Global - Market size and forecast 2023-2028 ($ million)
      • Chart on Global Market: Year-over-year growth 2023-2028 (%)
      • Data Table on Global Market: Year-over-year growth 2023-2028 (%)

    5 Historic Market Size

    • 5.1 Global Firewall As A Service Market 2018 - 2022
      • Historic Market Size - Data Table on Global Firewall As A Service Market 2018 - 2022 ($ million)
    • 5.2 End-user segment analysis 2018 - 2022
      • Historic Market Size - End-user Segment 2018 - 2022 ($ million)
    • 5.3 Geography segment analysis 2018 - 2022
      • Historic Market Size - Geography Segment 2018 - 2022 ($ million)
    • 5.4 Country segment analysis 2018 - 2022
      • Historic Market Size - Country Segment 2018 - 2022 ($ million)

    6 Qualitative Analysis

    • 6.1 Impact of AI on the global Firewall as a Service Market

      7 Five Forces Analysis

      • 7.1 Five forces summary
        • Five forces analysis - Comparison between 2023 and 2028
      • 7.2 Bargaining power of buyers
        • Bargaining power of buyers - Impact of key factors 2023 and 2028
      • 7.3 Bargaining power of suppliers
        • Bargaining power of suppliers - Impact of key factors in 2023 and 2028
      • 7.4 Threat of new entrants
        • Threat of new entrants - Impact of key factors in 2023 and 2028
      • 7.5 Threat of substitutes
        • Threat of substitutes - Impact of key factors in 2023 and 2028
      • 7.6 Threat of rivalry
        • Threat of rivalry - Impact of key factors in 2023 and 2028
      • 7.7 Market condition
        • Chart on Market condition - Five forces 2023 and 2028

      8 Market Segmentation by End-user

      • 8.1 Market segments
        • Chart on End-user - Market share 2023-2028 (%)
        • Data Table on End-user - Market share 2023-2028 (%)
      • 8.2 Comparison by End-user
        • Chart on Comparison by End-user
        • Data Table on Comparison by End-user
      • 8.3 BFSI - Market size and forecast 2023-2028
        • Chart on BFSI - Market size and forecast 2023-2028 ($ million)
        • Data Table on BFSI - Market size and forecast 2023-2028 ($ million)
        • Chart on BFSI - Year-over-year growth 2023-2028 (%)
        • Data Table on BFSI - Year-over-year growth 2023-2028 (%)
      • 8.4 Healthcare - Market size and forecast 2023-2028
        • Chart on Healthcare - Market size and forecast 2023-2028 ($ million)
        • Data Table on Healthcare - Market size and forecast 2023-2028 ($ million)
        • Chart on Healthcare - Year-over-year growth 2023-2028 (%)
        • Data Table on Healthcare - Year-over-year growth 2023-2028 (%)
      • 8.5 Retail - Market size and forecast 2023-2028
        • Chart on Retail - Market size and forecast 2023-2028 ($ million)
        • Data Table on Retail - Market size and forecast 2023-2028 ($ million)
        • Chart on Retail - Year-over-year growth 2023-2028 (%)
        • Data Table on Retail - Year-over-year growth 2023-2028 (%)
      • 8.6 Education - Market size and forecast 2023-2028
        • Chart on Education - Market size and forecast 2023-2028 ($ million)
        • Data Table on Education - Market size and forecast 2023-2028 ($ million)
        • Chart on Education - Year-over-year growth 2023-2028 (%)
        • Data Table on Education - Year-over-year growth 2023-2028 (%)
      • 8.7 Others - Market size and forecast 2023-2028
        • Chart on Others - Market size and forecast 2023-2028 ($ million)
        • Data Table on Others - Market size and forecast 2023-2028 ($ million)
        • Chart on Others - Year-over-year growth 2023-2028 (%)
        • Data Table on Others - Year-over-year growth 2023-2028 (%)
      • 8.8 Market opportunity by End-user
        • Market opportunity by End-user ($ million)
        • Data Table on Market opportunity by End-user ($ million)

      9 Customer Landscape

      • 9.1 Customer landscape overview
        • Analysis of price sensitivity, lifecycle, customer purchase basket, adoption rates, and purchase criteria

      10 Geographic Landscape

      • 10.1 Geographic segmentation
        • Chart on Market share by geography 2023-2028 (%)
        • Data Table on Market share by geography 2023-2028 (%)
      • 10.2 Geographic comparison
        • Chart on Geographic comparison
        • Data Table on Geographic comparison
      • 10.3 North America - Market size and forecast 2023-2028
        • Chart on North America - Market size and forecast 2023-2028 ($ million)
        • Data Table on North America - Market size and forecast 2023-2028 ($ million)
        • Chart on North America - Year-over-year growth 2023-2028 (%)
        • Data Table on North America - Year-over-year growth 2023-2028 (%)
      • 10.4 Europe - Market size and forecast 2023-2028
        • Chart on Europe - Market size and forecast 2023-2028 ($ million)
        • Data Table on Europe - Market size and forecast 2023-2028 ($ million)
        • Chart on Europe - Year-over-year growth 2023-2028 (%)
        • Data Table on Europe - Year-over-year growth 2023-2028 (%)
      • 10.5 APAC - Market size and forecast 2023-2028
        • Chart on APAC - Market size and forecast 2023-2028 ($ million)
        • Data Table on APAC - Market size and forecast 2023-2028 ($ million)
        • Chart on APAC - Year-over-year growth 2023-2028 (%)
        • Data Table on APAC - Year-over-year growth 2023-2028 (%)
      • 10.6 South America - Market size and forecast 2023-2028
        • Chart on South America - Market size and forecast 2023-2028 ($ million)
        • Data Table on South America - Market size and forecast 2023-2028 ($ million)
        • Chart on South America - Year-over-year growth 2023-2028 (%)
        • Data Table on South America - Year-over-year growth 2023-2028 (%)
      • 10.7 Middle East and Africa - Market size and forecast 2023-2028
        • Chart on Middle East and Africa - Market size and forecast 2023-2028 ($ million)
        • Data Table on Middle East and Africa - Market size and forecast 2023-2028 ($ million)
        • Chart on Middle East and Africa - Year-over-year growth 2023-2028 (%)
        • Data Table on Middle East and Africa - Year-over-year growth 2023-2028 (%)
      • 10.8 US - Market size and forecast 2023-2028
        • Chart on US - Market size and forecast 2023-2028 ($ million)
        • Data Table on US - Market size and forecast 2023-2028 ($ million)
        • Chart on US - Year-over-year growth 2023-2028 (%)
        • Data Table on US - Year-over-year growth 2023-2028 (%)
      • 10.9 China - Market size and forecast 2023-2028
        • Chart on China - Market size and forecast 2023-2028 ($ million)
        • Data Table on China - Market size and forecast 2023-2028 ($ million)
        • Chart on China - Year-over-year growth 2023-2028 (%)
        • Data Table on China - Year-over-year growth 2023-2028 (%)
      • 10.10 Germany - Market size and forecast 2023-2028
        • Chart on Germany - Market size and forecast 2023-2028 ($ million)
        • Data Table on Germany - Market size and forecast 2023-2028 ($ million)
        • Chart on Germany - Year-over-year growth 2023-2028 (%)
        • Data Table on Germany - Year-over-year growth 2023-2028 (%)
      • 10.11 UK - Market size and forecast 2023-2028
        • Chart on UK - Market size and forecast 2023-2028 ($ million)
        • Data Table on UK - Market size and forecast 2023-2028 ($ million)
        • Chart on UK - Year-over-year growth 2023-2028 (%)
        • Data Table on UK - Year-over-year growth 2023-2028 (%)
      • 10.12 Japan - Market size and forecast 2023-2028
        • Chart on Japan - Market size and forecast 2023-2028 ($ million)
        • Data Table on Japan - Market size and forecast 2023-2028 ($ million)
        • Chart on Japan - Year-over-year growth 2023-2028 (%)
        • Data Table on Japan - Year-over-year growth 2023-2028 (%)
      • 10.13 Canada - Market size and forecast 2023-2028
        • Chart on Canada - Market size and forecast 2023-2028 ($ million)
        • Data Table on Canada - Market size and forecast 2023-2028 ($ million)
        • Chart on Canada - Year-over-year growth 2023-2028 (%)
        • Data Table on Canada - Year-over-year growth 2023-2028 (%)
      • 10.14 France - Market size and forecast 2023-2028
        • Chart on France - Market size and forecast 2023-2028 ($ million)
        • Data Table on France - Market size and forecast 2023-2028 ($ million)
        • Chart on France - Year-over-year growth 2023-2028 (%)
        • Data Table on France - Year-over-year growth 2023-2028 (%)
      • 10.15 UAE - Market size and forecast 2023-2028
        • Chart on UAE - Market size and forecast 2023-2028 ($ million)
        • Data Table on UAE - Market size and forecast 2023-2028 ($ million)
        • Chart on UAE - Year-over-year growth 2023-2028 (%)
        • Data Table on UAE - Year-over-year growth 2023-2028 (%)
      • 10.16 India - Market size and forecast 2023-2028
        • Chart on India - Market size and forecast 2023-2028 ($ million)
        • Data Table on India - Market size and forecast 2023-2028 ($ million)
        • Chart on India - Year-over-year growth 2023-2028 (%)
        • Data Table on India - Year-over-year growth 2023-2028 (%)
      • 10.17 Brazil - Market size and forecast 2023-2028
        • Chart on Brazil - Market size and forecast 2023-2028 ($ million)
        • Data Table on Brazil - Market size and forecast 2023-2028 ($ million)
        • Chart on Brazil - Year-over-year growth 2023-2028 (%)
        • Data Table on Brazil - Year-over-year growth 2023-2028 (%)
      • 10.18 Market opportunity by geography
        • Market opportunity by geography ($ million)
        • Data Tables on Market opportunity by geography ($ million)

      11 Drivers, Challenges, and Opportunity/Restraints

      • 11.1 Market drivers
        • 11.2 Market challenges
          • 11.3 Impact of drivers and challenges
            • Impact of drivers and challenges in 2023 and 2028
          • 11.4 Market opportunities/restraints

            12 Competitive Landscape

            • 12.1 Overview
              • 12.2 Competitive Landscape
                • Overview on criticality of inputs and factors of differentiation
              • 12.3 Landscape disruption
                • Overview on factors of disruption
              • 12.4 Industry risks
                • Impact of key risks on business

              13 Competitive Analysis

              • 13.1 Companies profiled
                • Companies covered
              • 13.2 Company ranking index
                • Company ranking index
              • 13.3 Market positioning of companies
                • Matrix on companies position and classification
              • 13.4 Barracuda Networks Inc.
                • Barracuda Networks Inc. - Overview
                • Barracuda Networks Inc. - Product / Service
                • Barracuda Networks Inc. - Key news
                • Barracuda Networks Inc. - Key offerings
                • SWOT
              • 13.5 Cato Networks Ltd.
                • Cato Networks Ltd. - Overview
                • Cato Networks Ltd. - Product / Service
                • Cato Networks Ltd. - Key offerings
                • SWOT
              • 13.6 Check Point Software Technologies Ltd.
                • Check Point Software Technologies Ltd. - Overview
                • Check Point Software Technologies Ltd. - Product / Service
                • Check Point Software Technologies Ltd. - Key news
                • Check Point Software Technologies Ltd. - Key offerings
                • SWOT
              • 13.7 Cisco Systems Inc.
                • Cisco Systems Inc. - Overview
                • Cisco Systems Inc. - Business segments
                • Cisco Systems Inc. - Key news
                • Cisco Systems Inc. - Key offerings
                • Cisco Systems Inc. - Segment focus
                • SWOT
              • 13.8 Forcepoint LLC
                • Forcepoint LLC - Overview
                • Forcepoint LLC - Product / Service
                • Forcepoint LLC - Key offerings
                • SWOT
              • 13.9 Fortinet Inc.
                • Fortinet Inc. - Overview
                • Fortinet Inc. - Product / Service
                • Fortinet Inc. - Key news
                • Fortinet Inc. - Key offerings
                • SWOT
              • 13.10 Juniper Networks Inc.
                • Juniper Networks Inc. - Overview
                • Juniper Networks Inc. - Product / Service
                • Juniper Networks Inc. - Key news
                • Juniper Networks Inc. - Key offerings
                • SWOT
              • 13.11 Palo Alto Networks Inc.
                • Palo Alto Networks Inc. - Overview
                • Palo Alto Networks Inc. - Product / Service
                • Palo Alto Networks Inc. - Key news
                • Palo Alto Networks Inc. - Key offerings
                • SWOT
              • 13.12 WatchGuard Technologies Inc.
                • WatchGuard Technologies Inc. - Overview
                • WatchGuard Technologies Inc. - Product / Service
                • WatchGuard Technologies Inc. - Key offerings
                • SWOT
              • 13.13 Zscaler Inc.
                • Zscaler Inc. - Overview
                • Zscaler Inc. - Product / Service
                • Zscaler Inc. - Key offerings
                • SWOT

              14 Appendix

              • 14.1 Scope of the report
                • 14.2 Inclusions and exclusions checklist
                  • Inclusions checklist
                  • Exclusions checklist
                • 14.3 Currency conversion rates for US$
                  • Currency conversion rates for US$
                • 14.4 Research methodology
                  • Research methodology
                • 14.5 Data procurement
                  • Information sources
                • 14.6 Data validation
                  • Data validation
                • 14.7 Validation techniques employed for market sizing
                  • Validation techniques employed for market sizing
                • 14.8 Data synthesis
                  • Data synthesis
                • 14.9 360 degree market analysis
                  • 360 degree market analysis
                • 14.10 List of abbreviations
                  • List of abbreviations

                Research Methodology

                Technavio presents a detailed picture of the market by way of study, synthesis, and summation of data from multiple sources. The analysts have presented the various facets of the market with a particular focus on identifying the key industry influencers. The data thus presented is comprehensive, reliable, and the result of extensive research, both primary and secondary.

                INFORMATION SOURCES

                Primary sources

                • Manufacturers and suppliers
                • Channel partners
                • Industry experts
                • Strategic decision makers

                Secondary sources

                • Industry journals and periodicals
                • Government data
                • Financial reports of key industry players
                • Historical data
                • Press releases

                DATA ANALYSIS

                Data Synthesis

                • Collation of data
                • Estimation of key figures
                • Analysis of derived insights

                Data Validation

                • Triangulation with data models
                • Reference against proprietary databases
                • Corroboration with industry experts

                REPORT WRITING

                Qualitative

                • Market drivers
                • Market challenges
                • Market trends
                • Five forces analysis

                Quantitative

                • Market size and forecast
                • Market segmentation
                • Geographical insights
                • Competitive landscape

                Interested in this report?

                Get your sample now to see our research methodology and insights!

                Download Now

                Frequently Asked Questions

                Firewall As A Service market growth will increase by $ 3102.7 mn during 2024-2028 .

                The Firewall As A Service market is expected to grow at a CAGR of 31.8% during 2024-2028 .

                Firewall As A Service market is segmented by End-user( BFSI, Healthcare, Retail, Education, Others)

                AlgoSec Inc., Barracuda Networks Inc., Cato Networks Ltd., Check Point Software Technologies Ltd., Cisco Systems Inc., F5 Inc., FireMon LLC, Forcepoint LLC, Fortinet Inc., Juniper Networks Inc., Palo Alto Networks Inc., Skybox Security Inc., SonicWall Inc., Sophos Ltd., Spitfire Technology Group, WatchGuard Technologies Inc., Zscaler Inc. are a few of the key vendors in the Firewall As A Service market.

                North America will register the highest growth rate of 70% among the other regions. Therefore, the Firewall As A Service market in North America is expected to garner significant business opportunities for the vendors during the forecast period.

                US, China, Germany, UK, Canada, Japan, France, UAE, India, Brazil

                • Growing need for network security and privacyEnterprises from different industry verticals is the driving factor this market.
                • such as BFSI is the driving factor this market.
                • healthcare is the driving factor this market.
                • retail is the driving factor this market.
                • telecommunications is the driving factor this market.
                • and manufacturing is the driving factor this market.
                • are deploying technologies such as IoT and big data analytics to increase productivity and reduce operational complexities. They are deploying a high number of digital sensors in their production and manufacturing facilities as well as processes to improve their operational processes and make effective decisions. The deployment of advanced technologies is the driving factor this market.
                • such as the cloud and IoT is the driving factor this market.
                • is increasing the risk of cyberattacks. Some security challenges related to the deployment of such technologies include threats like distributed denial-of-service (DDoS) as well as malicious controllers and applications. Hence is the driving factor this market.
                • enterprises are focusing on network security and data privacy. Enterprises are focusing on securing their data at every level is the driving factor this market.
                • owing to concerns over cyberattacks and the imposition of data protection regulations is the driving factor this market.
                • such as the General Data Protection Regulation (GDPR). Recent trends indicate that cyberattacks are planned for long-term gains instead of short-term gains. Enterprises might only realize that their systems and sensitive data have been compromised only after several months or even years.The need for network security and data privacy is the driving factor this market.
                • owing to the risk of cyberattacks is the driving factor this market.
                • is increasing the demand for firewall as a service is the driving factor this market.
                • which will drive the growth of the global firewall as a service market during the forecast period. is the driving factor this market.

                The Firewall As A Service market vendors should focus on grabbing business opportunities from the BFSI segment as it accounted for the largest market share in the base year.