Flavored Powder Drinks Market Size 2025-2029
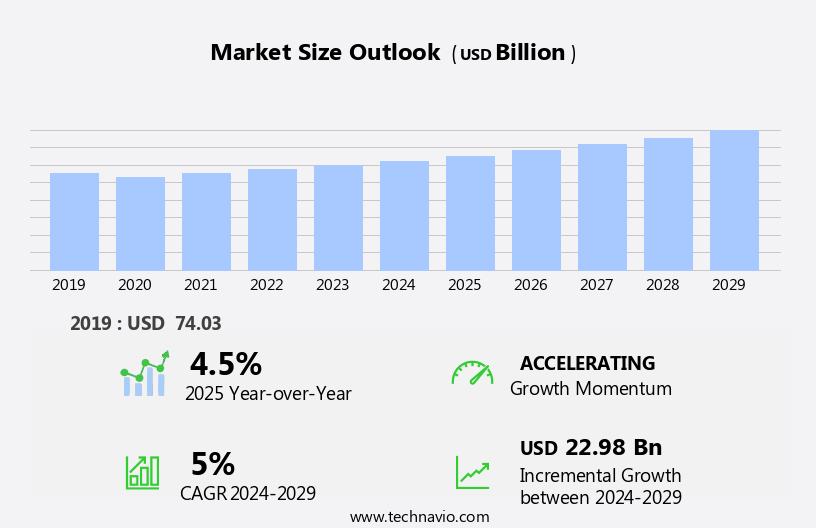
The flavored powder drinks market size is forecast to increase by USD 22.98 billion at a CAGR of 5% between 2024 and 2029.
- The market is experiencing significant growth due to rising consumer awareness regarding the health benefits associated with these beverages. The convenience and portability of flavored powder drinks and healthy snacks, which can be easily mixed with water, have made them a popular choice among health-conscious consumers seeking hydration and essential nutrients. Innovative flavors and ingredients continue to drive market growth, as companies introduce new offerings to cater to diverse consumer preferences. However, the market faces challenges due to fluctuating raw material prices for flavored powder drinks.
- These price fluctuations can impact the profitability of manufacturers and may necessitate price adjustments or cost reduction measures. Companies in the market must closely monitor raw material prices and explore alternative sourcing strategies to mitigate the impact on their business operations. To capitalize on market opportunities and navigate challenges effectively, it is essential for companies to stay informed about consumer trends and raw material market dynamics.
What will be the Size of the Flavored Powder Drinks Market during the forecast period?

Request Free Sample
- The flavored powder drink market continues to evolve, driven by consumer preferences for convenience, on-the-go nutrition, and diverse taste profiles. Powder blending enables customization and flexibility in meeting the demands of active lifestyles and busy professionals. Flavor innovation remains a key focus, with natural ingredients sourced from various regions enhancing product differentiation. Bulk packaging and single-serve packets cater to various retail channels, while brand loyalty is fostered through packaging design and social media marketing. Product innovation extends to low calorie and organic options, ensuring consumer insights are met. Shelf stability and distribution networks are crucial for maintaining product quality and accessibility.
- energy drinks and functional beverages, including protein powders and meal replacements, are popular applications. Sensory analysis and pricing strategies are essential in product development, while product branding and vitamin content further distinguish offerings in the competitive landscape. The market's dynamics continue to unfold, with ongoing product innovation and consumer trends shaping the future of the flavored powder drink industry.
How is this Flavored Powder Drinks Industry segmented?
The flavored powder drinks industry research report provides comprehensive data (region-wise segment analysis), with forecasts and estimates in "USD billion" for the period 2025-2029, as well as historical data from 2019-2023 for the following segments.
- Product Type
- Chocolate-based
- Malt-based flavored powder drinks
- Others
- Distribution Channel
- Supermarkets and hypermarkets
- Convenience stores
- Online
- Independent retailers
- Others
- Packaging
- Geography
- North America
- Europe
- APAC
- South America
- Rest of World (ROW)
By Product Type Insights
The chocolate-based segment is estimated to witness significant growth during the forecast period.
The market experiences continuous growth due to the increasing preference for on-the-go and convenient consumption options. Active lifestyle consumers and fitness enthusiasts seek out these drinks for their nutritional benefits, such as protein powder for muscle recovery and meal replacement options for busy professionals. Flavor innovation plays a significant role in market differentiation, with natural and organic beverage ingredients becoming increasingly popular. Bulk packaging and single-serve packets cater to various consumer needs, while brand loyalty is fostered through effective social media marketing and influencer partnerships. Shelf stability and distribution networks ensure these products remain accessible to consumers, both in retail channels and foodservice industry settings.
Consumer insights drive product innovation, leading to the development of functional beverages, energy drinks, and low-calorie options. Sensory analysis and stability testing are crucial to maintaining product quality and consumer satisfaction. Pricing strategies vary, with some brands focusing on affordability while others emphasize premium positioning. Protein powder, meal replacement, and energy drinks are popular categories within the market, each catering to specific consumer needs. Chocolate-based flavors continue to dominate due to their universal appeal and indulgent taste. Meal replacement drinks offer a convenient solution for those with busy schedules, while protein powder caters to fitness enthusiasts and post-workout recovery.
Energy drinks cater to consumers seeking an energy boost, often containing caffeine and vitamin content. Market research plays a vital role in understanding consumer preferences and identifying trends, enabling companies to adapt and innovate. Product branding and packaging design are essential elements in capturing consumer attention and building brand loyalty. Overall, the market is expected to witness significant growth due to its ability to cater to various consumer needs and preferences.

Request Free Sample
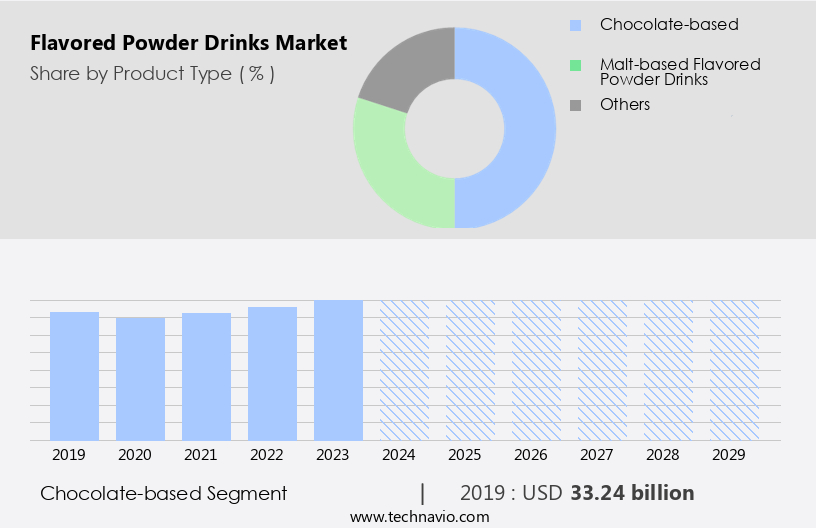
The Chocolate-based segment was valued at USD 33.24 billion in 2019 and showed a gradual increase during the forecast period.
Regional Analysis
APAC is estimated to contribute 49% to the growth of the global market during the forecast period.Technavio's analysts have elaborately explained the regional trends and drivers that shape the market during the forecast period.

Request Free Sample
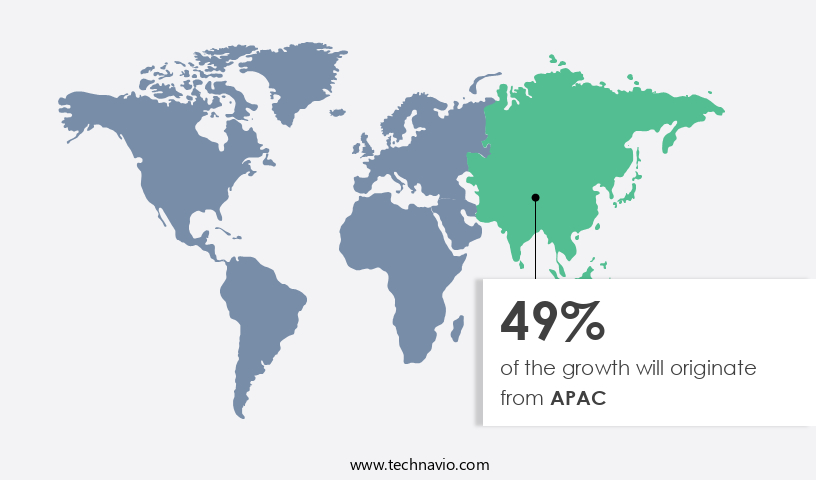
The market in Asia Pacific (APAC) is experiencing significant growth, fueled by the increasing preference for convenient and on-the-go nutrition solutions among active lifestyle consumers. This trend is particularly prominent in developing economies like India and China, where rising disposable income enables consumers to invest in premium products. In 2023, India's GDP grew by 8.2%, and it is projected to expand at a similar rate in 2024. China's economy grew by 5.4% in 2024. To cater to this expanding market, manufacturers are focusing on product innovation, including natural flavors and organic ingredients, to differentiate their offerings. Bulk packaging and single-serve packets are popular choices for busy professionals and on-the-go consumers.
Shelf stability and distribution networks are crucial factors for market success. Social media marketing and influencer collaborations are effective strategies for reaching consumers and building brand loyalty. Energy drinks and sports nutrition products are popular categories, with a growing emphasis on low sugar content and functional benefits. Product innovation, such as meal replacement and protein powder options, is also driving market growth. Sensory analysis and stability testing are essential to ensure product quality and consumer satisfaction. Vitamin content and dissolution rate are key considerations for consumers seeking optimal nutrition. The foodservice industry is another potential growth area, as flavored powder drinks can be easily incorporated into various dishes and beverages. Overall, the market in APAC is a dynamic and competitive landscape, with manufacturers continually seeking to meet the evolving needs and preferences of consumers.
Market Dynamics
Our researchers analyzed the data with 2024 as the base year, along with the key drivers, trends, and challenges. A holistic analysis of drivers will help companies refine their marketing strategies to gain a competitive advantage.
What are the key market drivers leading to the rise in the adoption of Flavored Powder Drinks Industry?
- The significant rise in consumer awareness regarding the potential health advantages of flavored powdered beverages serves as the primary market driver.
- Flavored powder drinks have gained popularity due to their convenience and ability to cater to various taste preferences. The market for these drinks is driven by the increasing number of on-the-go consumers with active lifestyles who seek nutritious and energy-boosting beverages. Powder blending allows for customization of flavors and the addition of essential nutrients, such as protein and meal replacement options. Flavor innovation is a key trend in the market, with companies sourcing high-quality ingredients from around the world to create unique and appealing flavors. Bulk packaging is also a popular choice for consumers to save time and money. The drinks provide a balanced mix of high-quality fats, essential protein, and carbohydrates, along with a wide range of vitamins and minerals.
- The key ingredients in major malt-based powder drinks include Malted Barley, sugar, wheat flour, milk solids, malted wheat, minerals, emulsifier, salt, acidity regulator, protein isolate, vitamins, and natural color.
What are the market trends shaping the Flavored Powder Drinks Industry?
- The current market trend favors innovative flavors and ingredients in food and beverage products.The market is experiencing significant growth due to the continuous introduction of new and innovative flavors, as well as the incorporation of trending ingredients, such as superfoods and natural sweeteners. This trend is attracting an increasing number of consumers, leading to a rise in new product launches by both regional and international players. Manufacturers are utilizing various strategies to increase market share, including innovative distribution networks and technical innovations. Social media marketing and influencer partnerships are also playing a crucial role in driving consumer interest and brand loyalty. However, the sugar content of these drinks remains a concern for health-conscious consumers.
- Shelf stability is another key factor that manufacturers must consider to ensure the longevity and quality of their products. The market is expected to grow steadily during the forecast period, driven by these market dynamics. The introduction of new flavors and ingredients, along with the adoption of innovative strategies, will continue to attract consumers and expand the market. Despite challenges, such as sugar content concerns and competition from other beverage categories, the market is poised for continued growth.
What challenges does the Flavored Powder Drinks Industry face during its growth?
- The unpredictable fluctuations in the prices of raw materials used in producing flavored powdered beverages pose a significant challenge to the industry's growth trajectory.
- The flavored powder drink market is driven by various factors, including the use of natural flavors and the increasing demand for organic ingredients. Retail channels, such as supermarkets and online platforms, dominate the market, requiring manufacturers to focus on product innovation and pricing strategies to remain competitive. Sensory analysis plays a crucial role in ensuring product quality and consumer satisfaction. Manufacturers face challenges in maintaining product stability, particularly with low calorie and high-dissolution rate formulations. The need for product branding and differentiation is also a significant consideration. Raw material costs, particularly for packaging components like aluminum, plastic, and paper, can be volatile and impact profit margins.
- Suppliers of these raw materials hold significant pricing power, necessitating manufacturers to explore cost-effective alternatives. To address these challenges, manufacturers invest in research and development to improve product formulations, packaging, and production processes. This focus on innovation and cost reduction enables them to cater to evolving consumer preferences while maintaining competitive pricing.
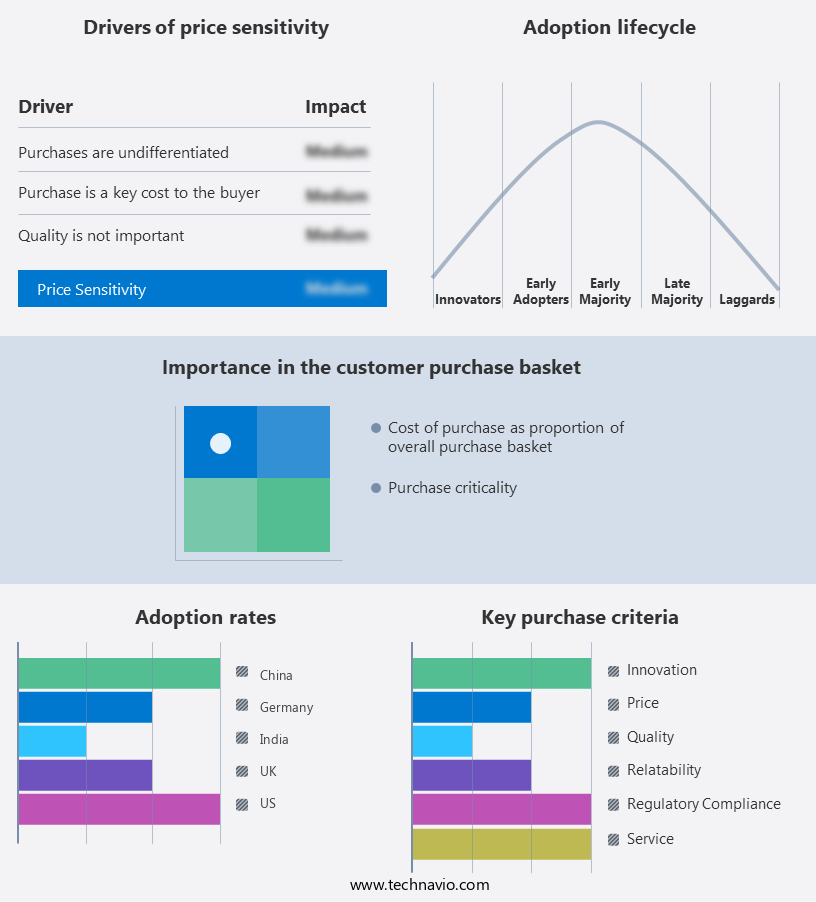
Exclusive Customer Landscape
The flavored powder drinks market forecasting report includes the adoption lifecycle of the market, covering from the innovator's stage to the laggard's stage. It focuses on adoption rates in different regions based on penetration. Furthermore, the flavored powder drinks market report also includes key purchase criteria and drivers of price sensitivity to help companies evaluate and develop their market growth analysis strategies.

Customer Landscape
Key Companies & Market Insights
Companies are implementing various strategies, such as strategic alliances, flavored powder drinks market forecast, partnerships, mergers and acquisitions, geographical expansion, and product/service launches, to enhance their presence in the industry.
Abbott Laboratories - This company provides a range of flavored powdered drink solutions, including Ensure Nutrition Drinks. These fat-free beverages offer a refreshing fruit taste and contain essential nutrients and protein, making them an ideal choice for those seeking convenient, nutritious hydration. With a focus on clear, refreshing flavors, these drinks cater to various dietary needs and preferences, ensuring optimal nutrition intake.
The industry research and growth report includes detailed analyses of the competitive landscape of the market and information about key companies, including:
- Abbott Laboratories
- AriZona Beverages USA LLC
- Cargill Inc.
- Dyla Brands
- Insta Foods
- Kent Corp.
- Kerry Group Plc
- Keurig Dr Pepper Inc.
- Lasco Foods Inc.
- Liquid I.V.
- National Beverage Corp.
- Nestle SA
- PepsiCo Inc.
- Simatek AS
- Sugam Products
- The Coca Cola Co.
- The Kraft Heinz Co.
- TreeHouse Foods Inc.
- True Citrus
- US Foods Holding Corp.
Qualitative and quantitative analysis of companies has been conducted to help clients understand the wider business environment as well as the strengths and weaknesses of key industry players. Data is qualitatively analyzed to categorize companies as pure play, category-focused, industry-focused, and diversified; it is quantitatively analyzed to categorize companies as dominant, leading, strong, tentative, and weak.
Recent Development and News in Flavored Powder Drinks Market
- In February 2024, Nestle, a leading player in the market, introduced a new line of ready-to-drink Nesquik products, expanding its product portfolio and catering to the growing consumer preference for convenience (Nestle Press Release, 2024).
- In May 2025, PepsiCo and Starbucks announced a strategic partnership to launch Starbucks-branded ready-to-drink coffee and tea products using PepsiCo's Tazo brand. This collaboration aimed to capitalize on Starbucks' strong brand recognition in the coffee market and PepsiCo's distribution capabilities (BusinessWire, 2025).
- In October 2024, Unilever completed the acquisition of a leading functional drinks company, adding a significant market share in the flavored powder drinks segment. The acquisition was valued at approximately USD2.5 billion and was expected to strengthen Unilever's presence in the rapidly growing functional drinks market (Reuters, 2024).
- In January 2025, the European Union approved new regulations for the labeling of powdered drinks, requiring manufacturers to list added sugars as a separate item on nutrition labels. This policy change aimed to promote transparency and help consumers make informed choices about their beverage consumption (European Commission Press Release, 2025).
Research Analyst Overview
The flavored powder drink market exhibits dynamic trends, with a focus on extended shelf life and rigorous Microbial Testing to ensure product quality and safety. Brands are catering to diverse target audiences by offering product bundles, personalized recommendations, and subscription models. Sugar substitutes, including artificial sweeteners and natural alternatives like monk fruit, are popular choices for health-conscious consumers. Soy protein and plant-based proteins, such as casein and whey, are gaining traction due to their sustainability and functional benefits. Brands are also embracing sustainable sourcing and organic certification to meet consumer demands.
Consumer and online reviews play a significant role in shaping market dynamics, with preferences shifting towards soluble fiber, insoluble fiber, and functional ingredients. Particle size and water solubility are crucial factors influencing product performance and customer satisfaction. Loyalty programs and customer segmentation strategies are essential tools for brands to retain customers and stay competitive.
Dive into Technavio's robust research methodology, blending expert interviews, extensive data synthesis, and validated models for unparalleled Flavored Powder Drinks Market insights. See full methodology.
Market Scope
|
Report Coverage
|
Details
|
Page number
|
232
|
Base year
|
2024
|
Historic period
|
2019-2023 |
Forecast period
|
2025-2029
|
Growth momentum & CAGR
|
Accelerate at a CAGR of 5%
|
Market growth 2025-2029
|
USD 22.98 billion
|
Market structure
|
Fragmented
|
YoY growth 2024-2025(%)
|
4.5
|
Key countries
|
US, China, UK, Canada, India, Germany, Japan, France, Italy, and Brazil
|
Competitive landscape
|
Leading Companies, Market Positioning of Companies, Competitive Strategies, and Industry Risks
|
Request Free Sample
What are the Key Data Covered in this Flavored Powder Drinks Market Research and Growth Report?
- CAGR of the Flavored Powder Drinks industry during the forecast period
- Detailed information on factors that will drive the growth and forecasting between 2025 and 2029
- Precise estimation of the size of the market and its contribution of the industry in focus to the parent market
- Accurate predictions about upcoming growth and trends and changes in consumer behaviour
- Growth of the market across APAC, North America, Europe, South America, and Middle East and Africa
- Thorough analysis of the market's competitive landscape and detailed information about companies
- Comprehensive analysis of factors that will challenge the flavored powder drinks market growth of industry companies
We can help! Our analysts can customize this flavored powder drinks market research report to meet your requirements.
Get in touch
1 Executive Summary
- 1.1 Market overview
- Executive Summary - Chart on Market Overview
- Executive Summary - Data Table on Market Overview
- Executive Summary - Chart on Global Market Characteristics
- Executive Summary - Chart on Market by Geography
- Executive Summary - Chart on Market Segmentation by Product Type
- Executive Summary - Chart on Market Segmentation by Distribution Channel
- Executive Summary - Chart on Market Segmentation by Packaging
- Executive Summary - Chart on Incremental Growth
- Executive Summary - Data Table on Incremental Growth
- Executive Summary - Chart on Company Market Positioning
2 Technavio Analysis
- 2.1 Analysis of price sensitivity, lifecycle, customer purchase basket, adoption rates, and purchase criteria
- Analysis of price sensitivity, lifecycle, customer purchase basket, adoption rates, and purchase criteria
- 2.2 Criticality of inputs and Factors of differentiation
- Overview on criticality of inputs and factors of differentiation
- 2.3 Factors of disruption
- Overview on factors of disruption
- 2.4 Impact of drivers and challenges
- Impact of drivers and challenges in 2024 and 2029
3 Market Landscape
- 3.1 Market ecosystem
- Parent Market
- Data Table on - Parent Market
- 3.2 Market characteristics
- Market characteristics analysis
4 Market Sizing
- 4.1 Market definition
- Offerings of companies included in the market definition
- 4.2 Market segment analysis
- 4.4 Market outlook: Forecast for 2024-2029
- Chart on Global - Market size and forecast 2024-2029 ($ million)
- Data Table on Global - Market size and forecast 2024-2029 ($ million)
- Chart on Global Market: Year-over-year growth 2024-2029 (%)
- Data Table on Global Market: Year-over-year growth 2024-2029 (%)
5 Historic Market Size
- 5.1 Global Flavored Powder Drinks Market 2019 - 2023
- Historic Market Size - Data Table on Global Flavored Powder Drinks Market 2019 - 2023 ($ million)
- 5.2 Product Type segment analysis 2019 - 2023
- Historic Market Size - Product Type Segment 2019 - 2023 ($ million)
- 5.3 Distribution Channel segment analysis 2019 - 2023
- Historic Market Size - Distribution Channel Segment 2019 - 2023 ($ million)
- 5.4 Packaging segment analysis 2019 - 2023
- Historic Market Size - Packaging Segment 2019 - 2023 ($ million)
- 5.5 Geography segment analysis 2019 - 2023
- Historic Market Size - Geography Segment 2019 - 2023 ($ million)
- 5.6 Country segment analysis 2019 - 2023
- Historic Market Size - Country Segment 2019 - 2023 ($ million)
6 Qualitative Analysis
- 6.1 Impact of AI in global flavored powder drinks market
7 Five Forces Analysis
- 7.1 Five forces summary
- Five forces analysis - Comparison between 2024 and 2029
- 7.2 Bargaining power of buyers
- Bargaining power of buyers - Impact of key factors 2024 and 2029
- 7.3 Bargaining power of suppliers
- Bargaining power of suppliers - Impact of key factors in 2024 and 2029
- 7.4 Threat of new entrants
- Threat of new entrants - Impact of key factors in 2024 and 2029
- 7.5 Threat of substitutes
- Threat of substitutes - Impact of key factors in 2024 and 2029
- 7.6 Threat of rivalry
- Threat of rivalry - Impact of key factors in 2024 and 2029
- 7.7 Market condition
- Chart on Market condition - Five forces 2024 and 2029
8 Market Segmentation by Product Type
- 8.1 Market segments
- Chart on Product Type - Market share (2024-2029) (%)
- Data Table on Product Type - Market share (2024-2029) (%)
- 8.2 Comparison by Product Type
- Chart on Comparison by Product Type
- Data Table on Comparison by Product Type
- 8.3 Chocolate-based - Market size and forecast (2024-2029)
- Chart on Chocolate-based - Market size and forecast (2024-2029) ($ million)
- Data Table on Chocolate-based - Market size and forecast (2024-2029) ($ million)
- Chart on Chocolate-based - Year-over-year growth (2024-2029) (%)
- Data Table on Chocolate-based - Year-over-year growth (2024-2029) (%)
- 8.4 Malt-based flavored powder drinks - Market size and forecast (2024-2029)
- Chart on Malt-based flavored powder drinks - Market size and forecast (2024-2029) ($ million)
- Data Table on Malt-based flavored powder drinks - Market size and forecast (2024-2029) ($ million)
- Chart on Malt-based flavored powder drinks - Year-over-year growth (2024-2029) (%)
- Data Table on Malt-based flavored powder drinks - Year-over-year growth (2024-2029) (%)
- 8.5 Others - Market size and forecast (2024-2029)
- Chart on Others - Market size and forecast (2024-2029) ($ million)
- Data Table on Others - Market size and forecast (2024-2029) ($ million)
- Chart on Others - Year-over-year growth (2024-2029) (%)
- Data Table on Others - Year-over-year growth (2024-2029) (%)
- 8.6 Market opportunity by Product Type
- Market opportunity by Product Type ($ million)
- Data Table on Market opportunity by Product Type ($ million)
9 Market Segmentation by Distribution Channel
- 9.1 Market segments
- Chart on Distribution Channel - Market share (2024-2029) (%)
- Data Table on Distribution Channel - Market share (2024-2029) (%)
- 9.2 Comparison by Distribution Channel
- Chart on Comparison by Distribution Channel
- Data Table on Comparison by Distribution Channel
- 9.3 Supermarkets and hypermarkets - Market size and forecast (2024-2029)
- Chart on Supermarkets and hypermarkets - Market size and forecast (2024-2029) ($ million)
- Data Table on Supermarkets and hypermarkets - Market size and forecast (2024-2029) ($ million)
- Chart on Supermarkets and hypermarkets - Year-over-year growth (2024-2029) (%)
- Data Table on Supermarkets and hypermarkets - Year-over-year growth (2024-2029) (%)
- 9.4 Convenience stores - Market size and forecast (2024-2029)
- Chart on Convenience stores - Market size and forecast (2024-2029) ($ million)
- Data Table on Convenience stores - Market size and forecast (2024-2029) ($ million)
- Chart on Convenience stores - Year-over-year growth (2024-2029) (%)
- Data Table on Convenience stores - Year-over-year growth (2024-2029) (%)
- 9.5 Online - Market size and forecast (2024-2029)
- Chart on Online - Market size and forecast (2024-2029) ($ million)
- Data Table on Online - Market size and forecast (2024-2029) ($ million)
- Chart on Online - Year-over-year growth (2024-2029) (%)
- Data Table on Online - Year-over-year growth (2024-2029) (%)
- 9.6 Independent retailers - Market size and forecast (2024-2029)
- Chart on Independent retailers - Market size and forecast (2024-2029) ($ million)
- Data Table on Independent retailers - Market size and forecast (2024-2029) ($ million)
- Chart on Independent retailers - Year-over-year growth (2024-2029) (%)
- Data Table on Independent retailers - Year-over-year growth (2024-2029) (%)
- 9.7 Others - Market size and forecast (2024-2029)
- Chart on Others - Market size and forecast (2024-2029) ($ million)
- Data Table on Others - Market size and forecast (2024-2029) ($ million)
- Chart on Others - Year-over-year growth (2024-2029) (%)
- Data Table on Others - Year-over-year growth (2024-2029) (%)
- 9.8 Market opportunity by Distribution Channel
- Market opportunity by Distribution Channel ($ million)
- Data Table on Market opportunity by Distribution Channel ($ million)
10 Market Segmentation by Packaging
- 10.1 Market segments
- Chart on Packaging - Market share (2024-2029) (%)
- Data Table on Packaging - Market share (2024-2029) (%)
- 10.2 Comparison by Packaging
- Chart on Comparison by Packaging
- Data Table on Comparison by Packaging
- 10.3 Sachets - Market size and forecast (2024-2029)
- Chart on Sachets - Market size and forecast (2024-2029) ($ million)
- Data Table on Sachets - Market size and forecast (2024-2029) ($ million)
- Chart on Sachets - Year-over-year growth (2024-2029) (%)
- Data Table on Sachets - Year-over-year growth (2024-2029) (%)
- 10.4 Tins - Market size and forecast (2024-2029)
- Chart on Tins - Market size and forecast (2024-2029) ($ million)
- Data Table on Tins - Market size and forecast (2024-2029) ($ million)
- Chart on Tins - Year-over-year growth (2024-2029) (%)
- Data Table on Tins - Year-over-year growth (2024-2029) (%)
- 10.5 Others - Market size and forecast (2024-2029)
- Chart on Others - Market size and forecast (2024-2029) ($ million)
- Data Table on Others - Market size and forecast (2024-2029) ($ million)
- Chart on Others - Year-over-year growth (2024-2029) (%)
- Data Table on Others - Year-over-year growth (2024-2029) (%)
- 10.6 Market opportunity by Packaging
- Market opportunity by Packaging ($ million)
- Data Table on Market opportunity by Packaging ($ million)
11 Market Segmentation by Consumer Segment
- 11.1 Market segments
- Chart on Consumer Segment - Market share (2024-2029) (%)
- Data Table on Consumer Segment - Market share (2024-2029) (%)
- 11.2 Comparison by Consumer Segment
- Chart on Comparison by Consumer Segment
- Data Table on Comparison by Consumer Segment
- 11.3 Children - Market size and forecast (2024-2029)
- Chart on Children - Market size and forecast (2024-2029) ($ million)
- Data Table on Children - Market size and forecast (2024-2029) ($ million)
- Chart on Children - Year-over-year growth (2024-2029) (%)
- Data Table on Children - Year-over-year growth (2024-2029) (%)
- 11.4 Adults - Market size and forecast (2024-2029)
- Chart on Adults - Market size and forecast (2024-2029) ($ million)
- Data Table on Adults - Market size and forecast (2024-2029) ($ million)
- Chart on Adults - Year-over-year growth (2024-2029) (%)
- Data Table on Adults - Year-over-year growth (2024-2029) (%)
- 11.5 Seniors - Market size and forecast (2024-2029)
- Chart on Seniors - Market size and forecast (2024-2029) ($ million)
- Data Table on Seniors - Market size and forecast (2024-2029) ($ million)
- Chart on Seniors - Year-over-year growth (2024-2029) (%)
- Data Table on Seniors - Year-over-year growth (2024-2029) (%)
- 11.6 Market opportunity by Consumer Segment
- Market opportunity by Consumer Segment ($ million)
- Data Table on Market opportunity by Consumer Segment ($ million)
12 Customer Landscape
- 12.1 Customer landscape overview
- Analysis of price sensitivity, lifecycle, customer purchase basket, adoption rates, and purchase criteria
13 Geographic Landscape
- 13.1 Geographic segmentation
- Chart on Market share by geography 2024-2029 (%)
- Data Table on Market share by geography 2024-2029 (%)
- 13.2 Geographic comparison
- Chart on Geographic comparison
- Data Table on Geographic comparison
- 13.3 APAC - Market size and forecast 2024-2029
- Chart on APAC - Market size and forecast 2024-2029 ($ million)
- Data Table on APAC - Market size and forecast 2024-2029 ($ million)
- Chart on APAC - Year-over-year growth 2024-2029 (%)
- Data Table on APAC - Year-over-year growth 2024-2029 (%)
- 13.4 North America - Market size and forecast 2024-2029
- Chart on North America - Market size and forecast 2024-2029 ($ million)
- Data Table on North America - Market size and forecast 2024-2029 ($ million)
- Chart on North America - Year-over-year growth 2024-2029 (%)
- Data Table on North America - Year-over-year growth 2024-2029 (%)
- 13.5 Europe - Market size and forecast 2024-2029
- Chart on Europe - Market size and forecast 2024-2029 ($ million)
- Data Table on Europe - Market size and forecast 2024-2029 ($ million)
- Chart on Europe - Year-over-year growth 2024-2029 (%)
- Data Table on Europe - Year-over-year growth 2024-2029 (%)
- 13.6 South America - Market size and forecast 2024-2029
- Chart on South America - Market size and forecast 2024-2029 ($ million)
- Data Table on South America - Market size and forecast 2024-2029 ($ million)
- Chart on South America - Year-over-year growth 2024-2029 (%)
- Data Table on South America - Year-over-year growth 2024-2029 (%)
- 13.7 Middle East and Africa - Market size and forecast 2024-2029
- Chart on Middle East and Africa - Market size and forecast 2024-2029 ($ million)
- Data Table on Middle East and Africa - Market size and forecast 2024-2029 ($ million)
- Chart on Middle East and Africa - Year-over-year growth 2024-2029 (%)
- Data Table on Middle East and Africa - Year-over-year growth 2024-2029 (%)
- 13.8 US - Market size and forecast 2024-2029
- Chart on US - Market size and forecast 2024-2029 ($ million)
- Data Table on US - Market size and forecast 2024-2029 ($ million)
- Chart on US - Year-over-year growth 2024-2029 (%)
- Data Table on US - Year-over-year growth 2024-2029 (%)
- 13.9 China - Market size and forecast 2024-2029
- Chart on China - Market size and forecast 2024-2029 ($ million)
- Data Table on China - Market size and forecast 2024-2029 ($ million)
- Chart on China - Year-over-year growth 2024-2029 (%)
- Data Table on China - Year-over-year growth 2024-2029 (%)
- 13.10 UK - Market size and forecast 2024-2029
- Chart on UK - Market size and forecast 2024-2029 ($ million)
- Data Table on UK - Market size and forecast 2024-2029 ($ million)
- Chart on UK - Year-over-year growth 2024-2029 (%)
- Data Table on UK - Year-over-year growth 2024-2029 (%)
- 13.11 India - Market size and forecast 2024-2029
- Chart on India - Market size and forecast 2024-2029 ($ million)
- Data Table on India - Market size and forecast 2024-2029 ($ million)
- Chart on India - Year-over-year growth 2024-2029 (%)
- Data Table on India - Year-over-year growth 2024-2029 (%)
- 13.12 Canada - Market size and forecast 2024-2029
- Chart on Canada - Market size and forecast 2024-2029 ($ million)
- Data Table on Canada - Market size and forecast 2024-2029 ($ million)
- Chart on Canada - Year-over-year growth 2024-2029 (%)
- Data Table on Canada - Year-over-year growth 2024-2029 (%)
- 13.13 Germany - Market size and forecast 2024-2029
- Chart on Germany - Market size and forecast 2024-2029 ($ million)
- Data Table on Germany - Market size and forecast 2024-2029 ($ million)
- Chart on Germany - Year-over-year growth 2024-2029 (%)
- Data Table on Germany - Year-over-year growth 2024-2029 (%)
- 13.14 Japan - Market size and forecast 2024-2029
- Chart on Japan - Market size and forecast 2024-2029 ($ million)
- Data Table on Japan - Market size and forecast 2024-2029 ($ million)
- Chart on Japan - Year-over-year growth 2024-2029 (%)
- Data Table on Japan - Year-over-year growth 2024-2029 (%)
- 13.15 France - Market size and forecast 2024-2029
- Chart on France - Market size and forecast 2024-2029 ($ million)
- Data Table on France - Market size and forecast 2024-2029 ($ million)
- Chart on France - Year-over-year growth 2024-2029 (%)
- Data Table on France - Year-over-year growth 2024-2029 (%)
- 13.16 Italy - Market size and forecast 2024-2029
- Chart on Italy - Market size and forecast 2024-2029 ($ million)
- Data Table on Italy - Market size and forecast 2024-2029 ($ million)
- Chart on Italy - Year-over-year growth 2024-2029 (%)
- Data Table on Italy - Year-over-year growth 2024-2029 (%)
- 13.17 Brazil - Market size and forecast 2024-2029
- Chart on Brazil - Market size and forecast 2024-2029 ($ million)
- Data Table on Brazil - Market size and forecast 2024-2029 ($ million)
- Chart on Brazil - Year-over-year growth 2024-2029 (%)
- Data Table on Brazil - Year-over-year growth 2024-2029 (%)
- 13.18 Market opportunity by geography
- Market opportunity by geography ($ million)
- Data Tables on Market opportunity by geography ($ million)
- 13.19 US - Market size and forecast (2024-2029)
- Chart on US - Market size and forecast (2024-2029) ($ million)
- Data Table on US - Market size and forecast (2024-2029) ($ million)
- Chart on US - Year-over-year growth (2024-2029) (%)
- Data Table on US - Year-over-year growth (2024-2029) (%)
- 13.20 Australia - Market size and forecast (2024-2029)
- Chart on Australia - Market size and forecast (2024-2029) ($ million)
- Data Table on Australia - Market size and forecast (2024-2029) ($ million)
- Chart on Australia - Year-over-year growth (2024-2029) (%)
- Data Table on Australia - Year-over-year growth (2024-2029) (%)
- 13.21 UAE - Market size and forecast (2024-2029)
- Chart on UAE - Market size and forecast (2024-2029) ($ million)
- Data Table on UAE - Market size and forecast (2024-2029) ($ million)
- Chart on UAE - Year-over-year growth (2024-2029) (%)
- Data Table on UAE - Year-over-year growth (2024-2029) (%)
- 13.22 Rest of World (ROW) - Market size and forecast (2024-2029)
- Chart on Rest of World (ROW) - Market size and forecast (2024-2029) ($ million)
- Data Table on Rest of World (ROW) - Market size and forecast (2024-2029) ($ million)
- Chart on Rest of World (ROW) - Year-over-year growth (2024-2029) (%)
- Data Table on Rest of World (ROW) - Year-over-year growth (2024-2029) (%)
- 13.23 Saudi Arabia - Market size and forecast (2024-2029)
- Chart on Saudi Arabia - Market size and forecast (2024-2029) ($ million)
- Data Table on Saudi Arabia - Market size and forecast (2024-2029) ($ million)
- Chart on Saudi Arabia - Year-over-year growth (2024-2029) (%)
- Data Table on Saudi Arabia - Year-over-year growth (2024-2029) (%)
- 13.24 South Korea - Market size and forecast (2024-2029)
- Chart on South Korea - Market size and forecast (2024-2029) ($ million)
- Data Table on South Korea - Market size and forecast (2024-2029) ($ million)
- Chart on South Korea - Year-over-year growth (2024-2029) (%)
- Data Table on South Korea - Year-over-year growth (2024-2029) (%)
- 13.25 Mexico - Market size and forecast (2024-2029)
- Chart on Mexico - Market size and forecast (2024-2029) ($ million)
- Data Table on Mexico - Market size and forecast (2024-2029) ($ million)
- Chart on Mexico - Year-over-year growth (2024-2029) (%)
- Data Table on Mexico - Year-over-year growth (2024-2029) (%)
14 Drivers, Challenges, and Opportunity/Restraints
- 14.3 Impact of drivers and challenges
- Impact of drivers and challenges in 2024 and 2029
- 14.4 Market opportunities/restraints
15 Competitive Landscape
- 15.2 Competitive Landscape
- Overview on criticality of inputs and factors of differentiation
- 15.3 Landscape disruption
- Overview on factors of disruption
- 15.4 Industry risks
- Impact of key risks on business
16 Competitive Analysis
- 16.2 Market positioning of companies
- Matrix on companies position and classification
- 16.3 The Coca-Cola Company
- The Coca-Cola Company - Overview
- The Coca-Cola Company - Product / Service
- The Coca-Cola Company - Key offerings
- 16.4 PepsiCo Inc.
- PepsiCo Inc. - Overview
- PepsiCo Inc. - Product / Service
- PepsiCo Inc. - Key offerings
- 16.5 Nestlé S.A.
- Nestlé S.A. - Overview
- Nestlé S.A. - Product / Service
- Nestlé S.A. - Key offerings
- 16.6 Mondelez International Inc.
- Mondelez International Inc. - Overview
- Mondelez International Inc. - Product / Service
- Mondelez International Inc. - Key offerings
- 16.7 Kraft Heinz Company
- Kraft Heinz Company - Overview
- Kraft Heinz Company - Product / Service
- Kraft Heinz Company - Key offerings
- 16.8 General Mills Inc.
- General Mills Inc. - Overview
- General Mills Inc. - Product / Service
- General Mills Inc. - Key offerings
- 16.9 Unilever Plc
- Unilever Plc - Overview
- Unilever Plc - Product / Service
- Unilever Plc - Key offerings
- 16.10 The Hershey Company
- The Hershey Company - Overview
- The Hershey Company - Product / Service
- The Hershey Company - Key offerings
- 16.11 Associated British Foods Plc
- Associated British Foods Plc - Overview
- Associated British Foods Plc - Product / Service
- Associated British Foods Plc - Key offerings
- 16.12 Mars Incorporated
- Mars Incorporated - Overview
- Mars Incorporated - Product / Service
- Mars Incorporated - Key offerings
- 16.13 Tang (Mondelez)
- Tang (Mondelez) - Overview
- Tang (Mondelez) - Product / Service
- Tang (Mondelez) - Key offerings
- 16.14 Nesquik (Nestlé)
- Nesquik (Nestlé) - Overview
- Nesquik (Nestlé) - Product / Service
- Nesquik (Nestlé) - Key offerings
- 16.15 Ovaltine (Nestlé)
- Ovaltine (Nestlé) - Overview
- Ovaltine (Nestlé) - Product / Service
- Ovaltine (Nestlé) - Key offerings
- 16.16 Horlicks (Unilever)
- Horlicks (Unilever) - Overview
- Horlicks (Unilever) - Product / Service
- Horlicks (Unilever) - Key offerings
- 16.17 Milo (Nestlé)
- Milo (Nestlé) - Overview
- Milo (Nestlé) - Product / Service
- Milo (Nestlé) - Key offerings
- 16.18 Gatorade (PepsiCo)
- Gatorade (PepsiCo) - Overview
- Gatorade (PepsiCo) - Product / Service
- Gatorade (PepsiCo) - Key offerings
- 16.19 Kool-Aid (Kraft Heinz)
- Kool-Aid (Kraft Heinz) - Overview
- Kool-Aid (Kraft Heinz) - Product / Service
- Kool-Aid (Kraft Heinz) - Key offerings
- 16.20 Crystal Light (Kraft Heinz)
- Crystal Light (Kraft Heinz) - Overview
- Crystal Light (Kraft Heinz) - Product / Service
- Crystal Light (Kraft Heinz) - Key offerings
- 16.21 Country Time (Kraft Heinz)
- Country Time (Kraft Heinz) - Overview
- Country Time (Kraft Heinz) - Product / Service
- Country Time (Kraft Heinz) - Key offerings
- 16.22 Wyler’s Light (Jel Sert Company)
- Wyler’s Light (Jel Sert Company) - Overview
- Wyler’s Light (Jel Sert Company) - Product / Service
- Wyler’s Light (Jel Sert Company) - Key offerings
- 16.23 Abbott Laboratories
- Abbott Laboratories - Overview
- Abbott Laboratories - Product / Service
- Abbott Laboratories - Key offerings
- 16.24 AriZona Beverages USA LLC
- AriZona Beverages USA LLC - Overview
- AriZona Beverages USA LLC - Product / Service
- AriZona Beverages USA LLC - Key offerings
- 16.25 Cargill Inc.
- Cargill Inc. - Overview
- Cargill Inc. - Product / Service
- Cargill Inc. - Key offerings
- 16.26 Dyla Brands
- Dyla Brands - Overview
- Dyla Brands - Product / Service
- Dyla Brands - Key offerings
- 16.27 Insta Foods
- Insta Foods - Overview
- Insta Foods - Product / Service
- Insta Foods - Key offerings
- 16.28 Kent Corp.
- Kent Corp. - Overview
- Kent Corp. - Product / Service
- Kent Corp. - Key offerings
- 16.29 Kerry Group Plc
- Kerry Group Plc - Overview
- Kerry Group Plc - Product / Service
- Kerry Group Plc - Key offerings
- 16.30 Keurig Dr Pepper Inc.
- Keurig Dr Pepper Inc. - Overview
- Keurig Dr Pepper Inc. - Product / Service
- Keurig Dr Pepper Inc. - Key offerings
- 16.31 Lasco Foods Inc.
- Lasco Foods Inc. - Overview
- Lasco Foods Inc. - Product / Service
- Lasco Foods Inc. - Key offerings
- 16.32 Liquid I.V.
- Liquid I.V. - Overview
- Liquid I.V. - Product / Service
- Liquid I.V. - Key offerings
- 16.33 National Beverage Corp.
- National Beverage Corp. - Overview
- National Beverage Corp. - Product / Service
- National Beverage Corp. - Key offerings
- 16.34 Nestle SA
- Nestle SA - Overview
- Nestle SA - Product / Service
- Nestle SA - Key offerings
- 16.35 PepsiCo Inc.
- PepsiCo Inc. - Overview
- PepsiCo Inc. - Product / Service
- PepsiCo Inc. - Key offerings
- 16.36 Simatek AS
- Simatek AS - Overview
- Simatek AS - Product / Service
- Simatek AS - Key offerings
- 16.37 Sugam Products
- Sugam Products - Overview
- Sugam Products - Product / Service
- Sugam Products - Key offerings
- 16.38 The Coca Cola Co.
- The Coca Cola Co. - Overview
- The Coca Cola Co. - Product / Service
- The Coca Cola Co. - Key offerings
- 16.39 The Kraft Heinz Co.
- The Kraft Heinz Co. - Overview
- The Kraft Heinz Co. - Product / Service
- The Kraft Heinz Co. - Key offerings
- 16.40 TreeHouse Foods Inc.
- TreeHouse Foods Inc. - Overview
- TreeHouse Foods Inc. - Product / Service
- TreeHouse Foods Inc. - Key offerings
- 16.41 True Citrus
- True Citrus - Overview
- True Citrus - Product / Service
- True Citrus - Key offerings
- 16.42 US Foods Holding Corp.
- US Foods Holding Corp. - Overview
- US Foods Holding Corp. - Product / Service
- US Foods Holding Corp. - Key offerings
17 Appendix
- 17.2 Inclusions and exclusions checklist
- Inclusions checklist
- Exclusions checklist
- 17.3 Currency conversion rates for US$
- Currency conversion rates for US$
- 17.4 Research methodology
- 17.7 Validation techniques employed for market sizing
- Validation techniques employed for market sizing
- 17.9 360 degree market analysis
- 360 degree market analysis
- 17.10 List of abbreviations