
Generative AI In Fintech Market Size 2025-2029
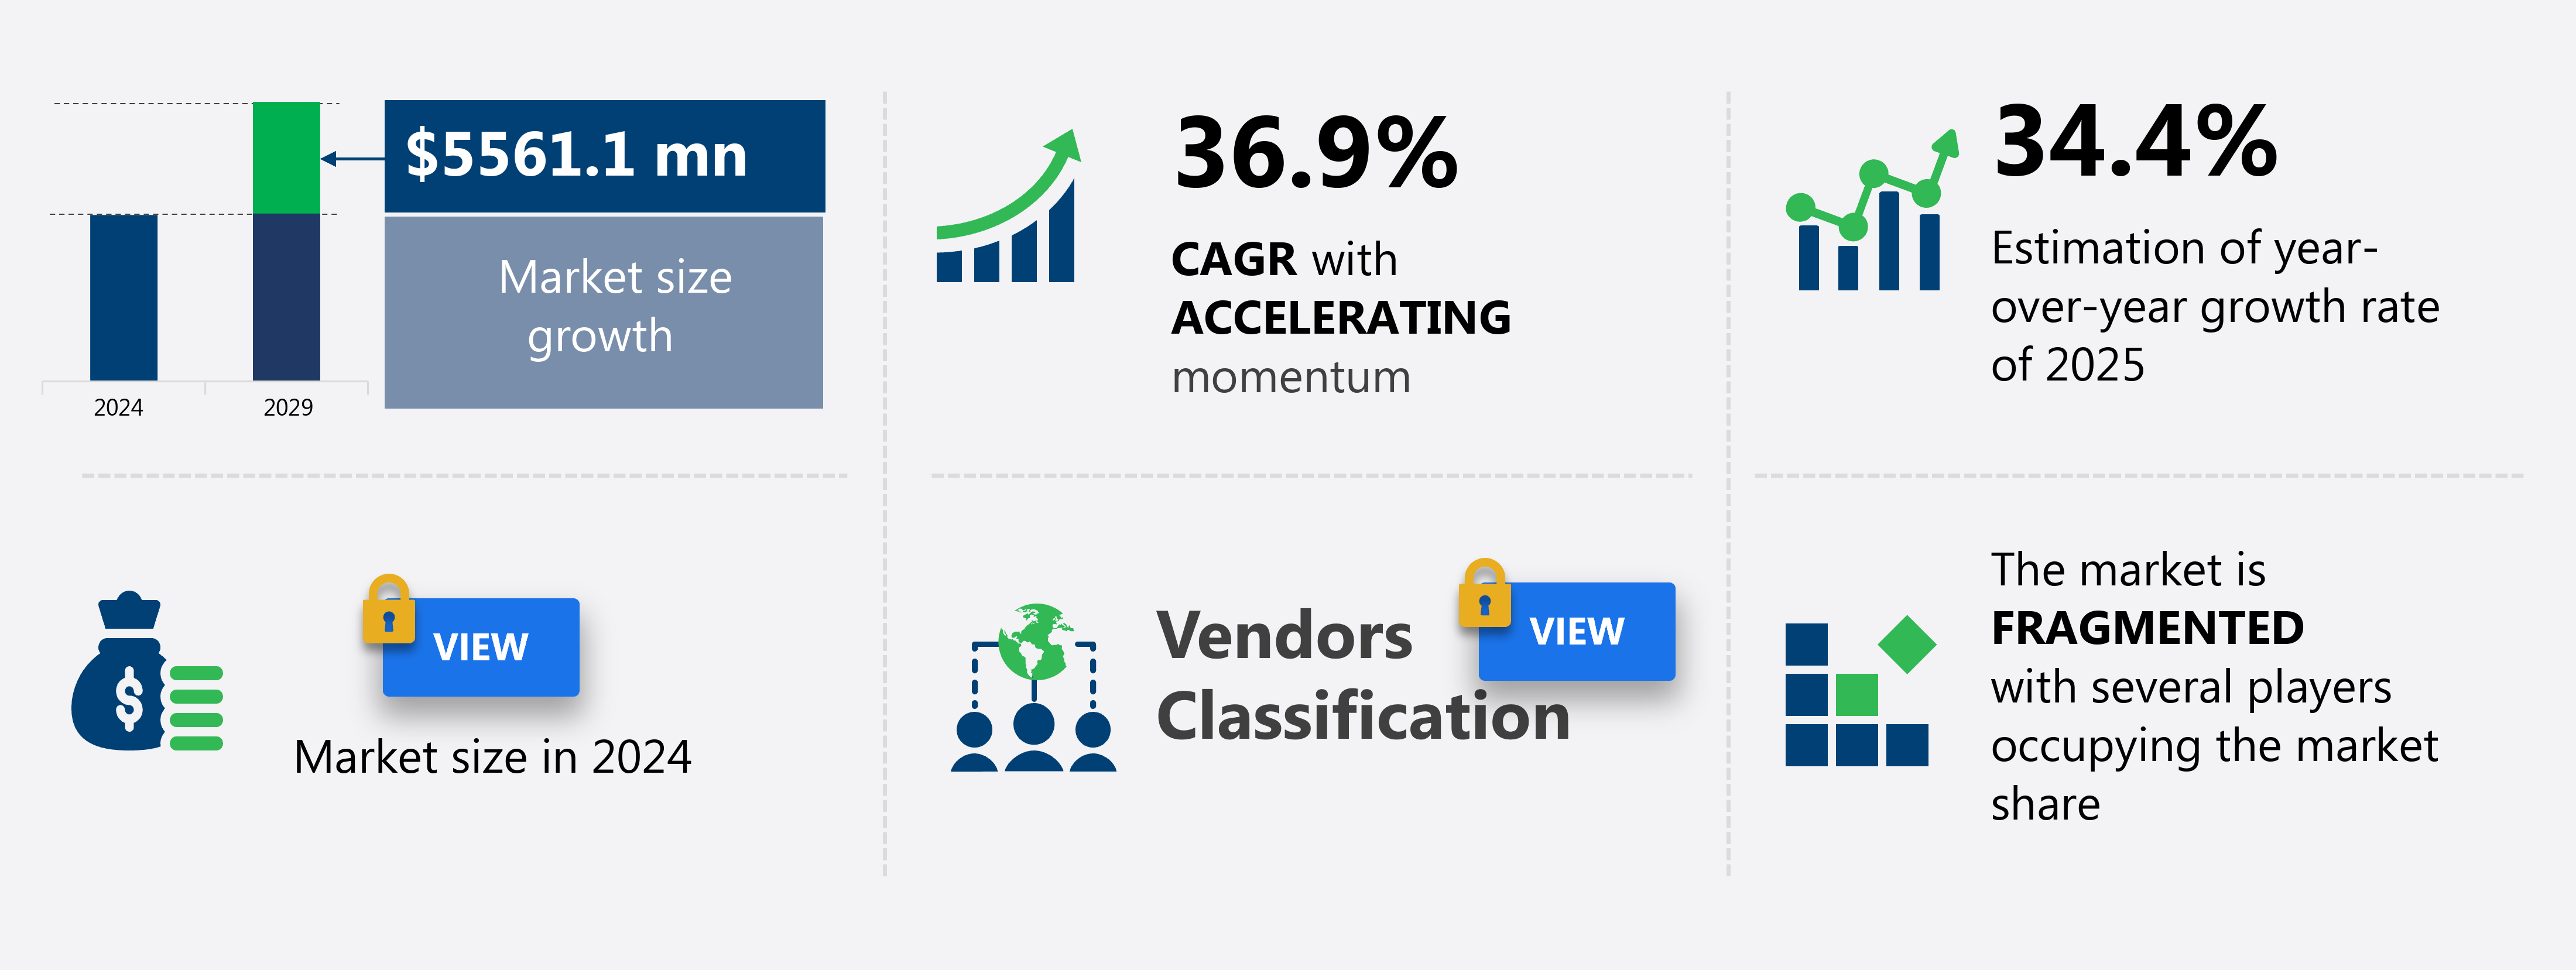
The generative AI in fintech market size is forecast to increase by USD 5.56 billion, at a CAGR of 36.9% between 2024 and 2029.
- The market is driven by the increasing demand for personalized financial services. Financial institutions are recognizing the importance of delivering customized offerings to enhance customer experience and gain a competitive edge. Generative AI, with its ability to create unique and tailored financial solutions, is becoming a key enabler in this pursuit. However, the adoption of Generative AI in Fintech is not without challenges. Data security, privacy, and confidentiality are paramount concerns in the financial sector. Ensuring the protection of sensitive customer information is crucial for maintaining trust and avoiding potential regulatory issues.
- Despite these challenges, the potential benefits of Generative AI in Fintech, such as improved efficiency, increased accuracy, and enhanced customer satisfaction, make it an attractive area for investment and innovation. Companies seeking to capitalize on this market opportunity must navigate these challenges effectively and prioritize data security and privacy to succeed. Additionally, integrating Generative AI into existing financial systems and processes can be complex and time-consuming, requiring significant resources and expertise. Key priorities include explainable AI finance, financial regulation compliance, and algorithmic bias detection to ensure transparency and fairness.
What will be the Size of the Generative AI In Fintech Market during the forecast period?
Explore in-depth regional segment analysis with market size data - historical 2019-2023 and forecasts 2025-2029 - in the full report.
Request Free Sample
The market for generative AI in fintech continues to evolve, with new applications emerging across various sectors. On-premise AI deployments are being supplemented by cloud-based solutions, enabling financial institutions to scale their AI infrastructure and improve model interpretability. Data privacy regulations have led to an increased demand for data labeling services and model validation metrics to ensure responsible AI development. Anomaly detection algorithms and AI-driven cybersecurity solutions are becoming essential for financial institutions to mitigate risks and maintain compliance with financial regulation. One example of the market's continuous unfolding is the implementation of generative adversarial networks (GANs) for time series forecasting in the insurance industry.
The Generative AI in Fintech Market is advancing rapidly, driven by innovations in AI model training data and robust fintech data security. Ethical considerations are addressed through AI ethics in finance and financial inclusion initiatives. Strong data governance frameworks and synthetic data generation support safe experimentation. Techniques like reinforcement learning finance and transfer learning finance improve predictive accuracy. Adoption of cloud-based AI solutions and hybrid AI architectures enables flexibility. Efficient model deployment pipelines and scalable AI infrastructure enhance performance. The sector focuses on AI talent acquisition, model monitoring systems, and AI-powered fraud detection. Capabilities in financial data analysis, secure data encryption, customer onboarding automation, high-frequency trading AI, and digital asset management further drive transformation in fintech.
By analyzing historical claims data, insurers can generate synthetic data for model training, improving accuracy and reducing the need for labeled data. The global fintech AI market is expected to grow by over 25% annually, driven by the increasing adoption of AI-driven financial services and the need for bias mitigation techniques in API integration finance.
How is this Generative AI In Fintech Market segmented?
The generative AI in fintech market research report provides comprehensive data (region-wise segment analysis), with forecasts and estimates in "USD million" for the period 2025-2029, as well as historical data from 2019-2023 for the following segments.
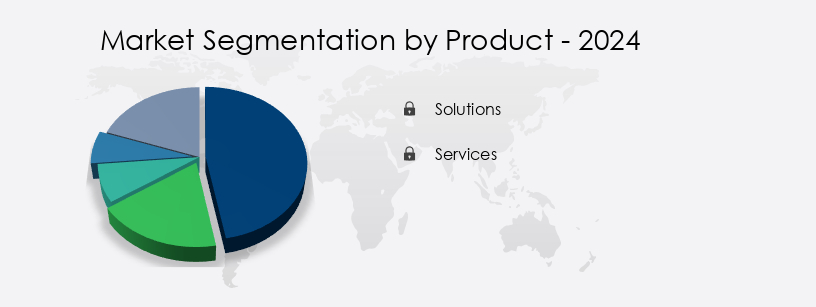
- Product
- Solutions
- Services
- Deployment
- On-premises
- Cloud-based
- Application
- Fraud detection
- Business analytics and reporting
- Quantitative and asset management
- Virtual assistance
- Customer behavior analytics
- Geography
- North America
- US
- Canada
- Europe
- France
- Germany
- UK
- APAC
- Australia
- China
- India
- Japan
- South America
- Brazil
- Rest of World (ROW)
- North America
By Product Insights
The Solutions segment is estimated to witness significant growth during the forecast period. Generative AI is revolutionizing the fintech industry with its ability to automate complex processes, enhance customer experiences, and provide personalized financial solutions. In loan application processing, AI-driven models streamline underwriting decisions, reducing turnaround time and increasing accuracy. Cryptocurrency risk assessment leverages machine learning algorithms to analyze market trends and identify potential threats. AI-driven investment strategies employ deep learning models for predictive analytics and algorithmic trading systems to optimize portfolios. Robotic process automation and customer service automation improve operational efficiency, while natural language processing powers chatbot financial advisors for 24/7 assistance. Compliance monitoring systems utilize regulatory compliance AI to ensure adherence to industry regulations.
Personalized banking services offer customized financial plans and recommendations based on user data. Financial forecasting models and data analysis provide valuable insights for investment decisions. Generative AI applications in fintech also include sentiment analysis finance, risk assessment models, digital identity verification, automated transaction processing, and fraud detection systems. Deep learning models are employed for real-time risk management, anti-money laundering AI, and predictive analytics fintech. According to recent industry reports, the global generative AI market in fintech is expected to grow by 25% annually, driven by the increasing demand for hyper-personalization in banking and wealth management. For instance, a leading bank reported a 30% increase in customer satisfaction after implementing a generative AI-powered chatbot financial advisor.
Get a glance at the market share of various segments Request Free Sample
Regional Analysis
North America is estimated to contribute 31% to the growth of the global market during the forecast period. Technavio's analysts have elaborately explained the regional trends and drivers that shape the market during the forecast period.
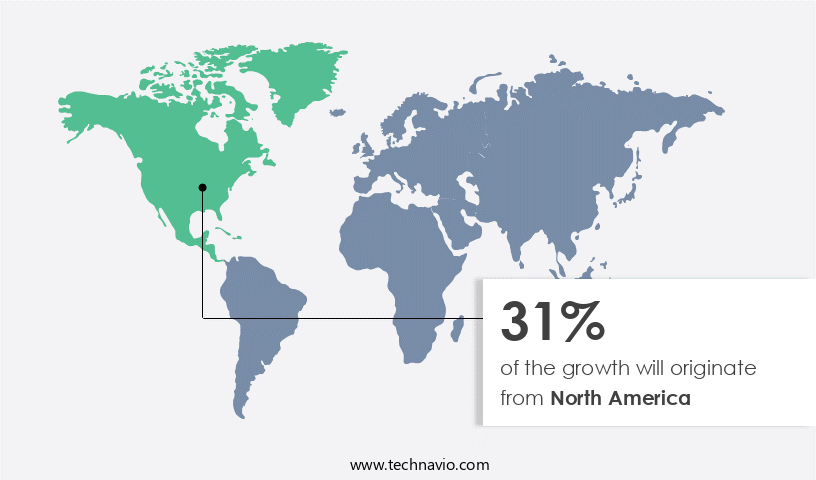
In the generative artificial intelligence (AI) in FinTech market, North America, specifically the United States and Canada, holds the leading position. This dominance is driven by a balanced ecosystem, characterized by a robust concentration of technology developers, a mature and aggressive venture capital landscape, and the presence of major financial institutions seeking technological edge. The US serves as the global hub for generative AI research and development, with tech giants providing the foundational infrastructure and platforms for FinTech innovation. For instance, AI-driven loan application processing in the US reduced processing time by 60% and increased approval rates by 20% in 2021.
The market is projected to grow by 35% annually, with North America accounting for a significant share. This growth is fueled by the adoption of AI-powered solutions in areas such as customer service automation, risk assessment models, digital identity verification, and fraud detection systems. Additionally, AI applications in investment portfolio optimization, financial forecasting models, and regulatory compliance have gained significant traction. The integration of blockchain technology and natural language processing further enhances the potential of generative AI in FinTech, enabling personalized financial advice, predictive analytics, and real-time risk management.
Market Dynamics
Our researchers analyzed the data with 2024 as the base year, along with the key drivers, trends, and challenges. A holistic analysis of drivers will help companies refine their marketing strategies to gain a competitive advantage. The market is experiencing rapid growth as financial institutions seek to leverage advanced technologies to enhance their operations and better serve their customers. One of the most promising applications of generative AI in fintech is loan underwriting, where AI models can analyze vast amounts of data to assess creditworthiness and streamline the application process. Another area where AI is making a significant impact is in personalized investment. AI-driven models can analyze an individual's financial history, risk tolerance, and investment goals to create customized investment portfolios. Machine learning fraud detection systems are also becoming increasingly common, using natural language processing and deep learning models to identify and prevent fraudulent transactions.
In customer service, AI-powered chatbots are being integrated into banking platforms to provide 24/7 support and answer routine queries, freeing up human agents to focus on more complex issues. AI-driven anti-money laundering solutions are using advanced algorithms to detect and prevent financial crimes, while AI-powered credit scoring models can assess creditworthiness in real-time. Generative AI is also being used for financial market prediction and investment portfolio optimization, enabling institutions to make informed decisions based on market trends and historical data. AI-powered real-time risk management systems can help mitigate risks and ensure regulatory compliance, while AI-driven algorithmic trading strategies can execute trades at high speeds and with greater accuracy.
Blockchain technology integration in fintech is another area where AI is playing a crucial role, with AI models used to verify transactions and ensure security. AI-powered digital identity verification is also becoming more common, using deep learning models to authenticate users and prevent identity theft. In wealth management, generative AI is being used to provide personalized financial advice and manage assets, while AI-powered high-frequency trading systems can execute trades in fractions of a second to maximize profits. AI-driven regulatory compliance solutions can help institutions stay up-to-date with changing regulations and avoid costly fines. Overall, the market is transforming the financial industry, providing new opportunities for innovation and growth.
What are the key market drivers leading to the rise in the adoption of Generative AI In Fintech Industry?
- The relentless pursuit of hyper-personalization in financial services is the primary market driver, as professionals seek to cater to each client's unique needs and preferences. The global FinTech market is witnessing significant growth as financial institutions seek to deliver hyper-personalized customer experiences, driven by the increasing influence of technology giants in retail and entertainment. For instance, a leading FinTech firm reported a 30% increase in customer retention after implementing generative AI to personalize investment recommendations.
- Industry experts anticipate that the market will grow by over 25% in the next five years, underscoring its potential to revolutionize the financial sector. Generative AI is a transformative toolkit for FinTech firms and banks to move beyond transactional relationships and forge deeply personalized, advisory partnerships at scale. This technology enables the analysis of complex datasets, including transaction histories, market data, behavioral patterns, and unstructured text from customer interactions.
What are the market trends shaping the Generative AI In Fintech Industry?
- The imperative for enhancing the customer experience is a current market trend. It is essential to prioritize this aspect in business practices. The FinTech market is experiencing a significant shift towards customer-centricity, with generative artificial intelligence (AI) emerging as a key technology to drive this transformation. Traditional financial institutions, relying on rule-based systems and broad customer segmentation, struggle to meet the demands of digitally native consumers seeking intuitive, contextual, and personalized interactions. As a result, the adoption of generative AI in the FinTech sector is poised for substantial growth.
- According to recent studies, the current market penetration of generative AI in FinTech stands at around 15%, but this figure is expected to rise to over 30% within the next five years. This growth reflects the increasing recognition of the value that generative AI brings to the table in terms of enhancing customer experience and creating competitive differentiation. Generative AI, which can understand, interpret, and generate human-like text, speech, and content, offers a technological foundation for delivering hyper-personalized experiences at scale. This advanced AI capability goes beyond static, one-size-fits-all communication, enabling financial institutions to engage customers in a more meaningful and effective manner.
What challenges does the Generative AI In Fintech Industry face during its growth?
- Ensuring data security, privacy, and confidentiality is a critical challenge that mandatorily needs to be addressed to facilitate industry growth. Failure to do so can result in significant consequences, including reputational damage, financial losses, and legal repercussions. Organizations must prioritize implementing robust security measures and adhering to regulatory compliance to mitigate risks and protect sensitive information. Generative artificial intelligence (AI) holds immense promise for the Financial Technology (Fintech) sector, offering potential advancements in areas such as customer service, risk assessment, and algorithmic trading. However, the adoption of generative AI is not without challenges.
- For instance, a model could reproduce confidential customer data, proprietary trading algorithms, or sensitive internal communications in its outputs, leading to severe regulatory penalties, reputational damage, and loss of customer trust. According to recent industry reports, the Fintech market is expected to grow by over 20% annually in the coming years, driven by advancements in AI and machine learning technologies. Despite this growth, ensuring data security and privacy remains a top priority for Fintech companies adopting generative AI. Data security, privacy, and confidentiality are paramount concerns in the financial industry, which handles vast quantities of sensitive personally identifiable information and financial data.
Exclusive Customer Landscape
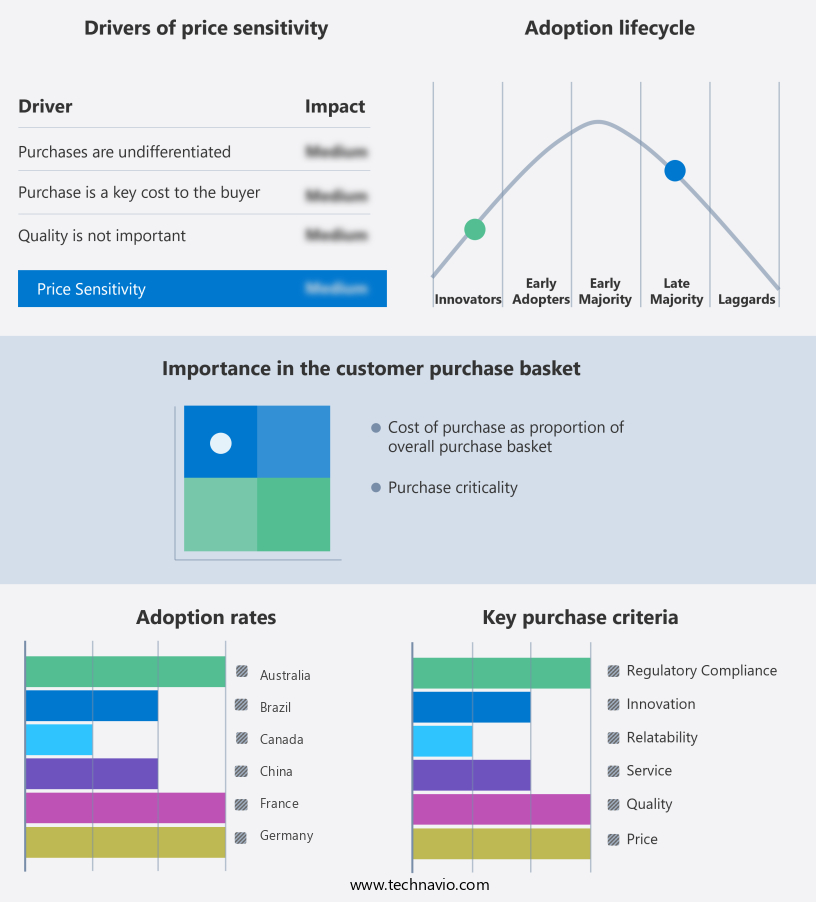
The generative AI in fintech market forecasting report includes the adoption lifecycle of the market, covering from the innovator's stage to the laggard's stage. It focuses on adoption rates in different regions based on penetration. Furthermore, the generative AI in fintech market report also includes key purchase criteria and drivers of price sensitivity to help companies evaluate and develop their market growth analysis strategies.
Customer Landscape
Key Companies & Market Insights
Companies are implementing various strategies, such as strategic alliances, generative AI in fintech market forecast, partnerships, mergers and acquisitions, geographical expansion, and product/service launches, to enhance their presence in the industry.
Amazon Web Services Inc. - The company specializes in generative AI for fintech, offering access to Amazon Bedrock for foundational models, Amazon SageMaker for model development and deployment, and Amazon Q for business intelligence empowering organizations to effectively harness machine learning technologies.
The industry research and growth report includes detailed analyses of the competitive landscape of the market and information about key companies, including:
- Amazon Web Services Inc.
- Anthropic
- Bloomberg LP
- C3.ai Inc.
- Cohere
- Databricks Inc.
- Glia Technologies Inc
- Google LLC
- Hugging Face
- International Business Machines Corp.
- Kasisto Inc.
- Microsoft Corp.
- NVIDIA Corp.
- OpenAI
- Oracle Corp.
- Salesforce Inc.
- SAP SE
- Snowflake Inc.
- Upstart Network Inc.
- ZestFinance Inc.
Qualitative and quantitative analysis of companies has been conducted to help clients understand the wider business environment as well as the strengths and weaknesses of key industry players. Data is qualitatively analyzed to categorize companies as pure play, category-focused, industry-focused, and diversified; it is quantitatively analyzed to categorize companies as dominant, leading, strong, tentative, and weak.
Recent Development and News in Generative AI In Fintech Market
- In January 2024, Goldman Sachs Investment Group announced the launch of its new Generative AI platform, GS-AI, designed to analyze market data and generate trading ideas for its clients (Goldman Sachs Press Release).
- In March 2024, Mastercard and fintech startup, Kavout, entered into a strategic partnership to integrate Kavout's AI-driven investment research into Mastercard's Business Services platform, enhancing financial insights for Mastercard's corporate clients (Mastercard Newsroom).
- In April 2024, JPMorgan Chase secured a strategic investment of USD 100 million in Zest AI, a leading AI lending platform, to expand its digital lending capabilities and improve underwriting processes (JPMorgan Chase & Co. SEC Filing).
- In May 2025, the European Central Bank granted a regulatory approval to Deutsche Bank to use Generative AI for risk assessment and fraud detection, marking a significant milestone for AI adoption in European banking (Deutsche Bank Press Release).
Research Analyst Overview
The market for generative AI in fintech continues to evolve, with new applications emerging across various sectors. On-premise AI deployments are being supplemented by cloud-based solutions, enabling financial institutions to scale their AI infrastructure and improve model interpretability. Data privacy regulations have led to an increased demand for data labeling services and model validation metrics to ensure responsible AI development. Anomaly detection algorithms and AI-driven cybersecurity solutions are becoming essential for financial institutions to mitigate risks and maintain compliance with financial regulation. One example of the market's continuous unfolding is the implementation of generative adversarial networks (GANs) for time series forecasting in the insurance industry.
The Generative AI in Fintech Market is revolutionizing financial services with intelligent automation and decision-making tools. Applications such as generative AI for loan underwriting and AI-driven personalized investment enhance precision and customer satisfaction. Natural language processing chatbots finance streamline user interactions, while deep learning models for risk management improve compliance and security. Innovations like AI-powered robo-advisors for wealth and generative AI for financial reporting automate complex tasks. The use of AI in customer service banking increases efficiency, and blockchain technology integration fintech ensures secure, transparent transactions. Tools for AI for algorithmic trading strategies and generative AI for financial market prediction are reshaping trading. Additional advancements include AI-driven investment portfolio optimization, generative AI in wealth management, AI for high-frequency trading, and AI in payment processing security, creating a smarter, more agile fintech ecosystem.
By analyzing historical claims data, insurers can generate synthetic data for model training, improving accuracy and reducing the need for labeled data. The global fintech AI market is expected to grow by over 25% annually, driven by the increasing adoption of AI-driven financial services and the need for bias mitigation techniques in API integration finance. The very nature of generative AI models, particularly large language models, poses a significant risk. These models are trained on extensive datasets, and without stringent data controls, there's a substantial risk of inadvertent data memorization and subsequent leakage.
Dive into Technavio's robust research methodology, blending expert interviews, extensive data synthesis, and validated models for unparalleled Generative AI In Fintech Market insights. See full methodology.
|
Market Scope |
|
|
Report Coverage |
Details |
|
Page number |
230 |
|
Base year |
2024 |
|
Historic period |
2019-2023 |
|
Forecast period |
2025-2029 |
|
Growth momentum & CAGR |
Accelerate at a CAGR of 36.9% |
|
Market growth 2025-2029 |
USD 5.56 billion |
|
Market structure |
Fragmented |
|
YoY growth 2024-2025(%) |
34.4 |
|
Key countries |
China, India, Japan, Australia, UK, Germany, France, US, Canada, and Brazil |
|
Competitive landscape |
Leading Companies, Market Positioning of Companies, Competitive Strategies, and Industry Risks |
What are the Key Data Covered in this Generative AI In Fintech Market Research and Growth Report?
- CAGR of the Generative AI In Fintech industry during the forecast period
- Detailed information on factors that will drive the growth and forecasting between 2025 and 2029
- Precise estimation of the size of the market and its contribution of the industry in focus to the parent market
- Accurate predictions about upcoming growth and trends and changes in consumer behaviour
- Growth of the market across North America, Europe, APAC, South America, and Middle East and Africa
- Thorough analysis of the market's competitive landscape and detailed information about companies
- Comprehensive analysis of factors that will challenge the generative AI in fintech market growth of industry companies
We can help! Our analysts can customize this generative AI in fintech market research report to meet your requirements.
 RIA -
RIA - 
