Industrial Food Blender And Mixer Market Size 2025-2029
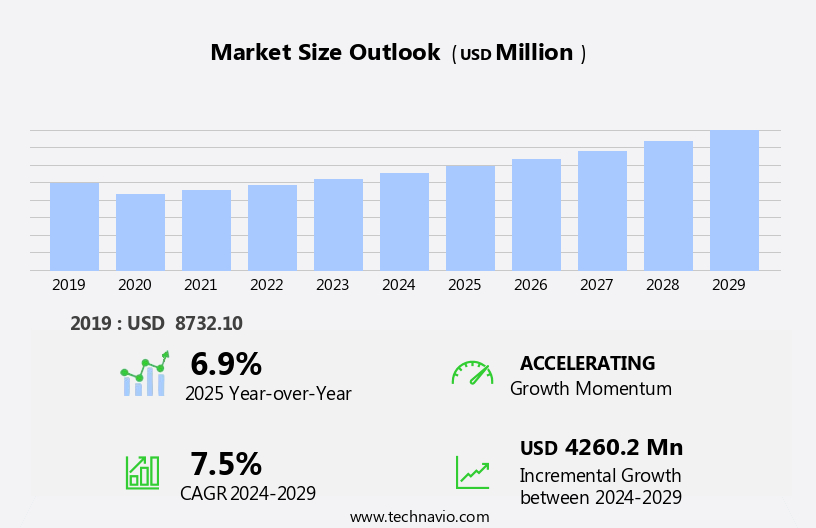
The industrial food blender and mixer market size is forecast to increase by USD 4.26 billion at a CAGR of 7.5% between 2024 and 2029.
- The market is poised for steady growth, driven by the expanding food processing industry. This sector's increasing focus on automation, efficiency, and product consistency is fueling the demand for advanced blending and mixing solutions. Technological innovations, such as energy-efficient motors and smart control systems, are further enhancing the market's appeal. However, the high energy consumption associated with these industrial-scale equipment poses a significant challenge. To mitigate this, manufacturers are exploring energy recovery systems and alternative power sources, creating opportunities for technological advancements and partnerships.
- Companies seeking to capitalize on this market's potential must stay informed about the latest trends and address the energy consumption issue effectively. By investing in research and development and collaborating with energy providers, they can differentiate themselves and meet the evolving demands of the food processing industry. Food processing companies in the region predominantly use ribbon mixers to blend powdered chocolate and cocoa with other ingredients, such as sugar, vitamins, and minerals.
What will be the size of the Industrial Food Blender And Mixer Market during the forecast period?

Request Free Sample
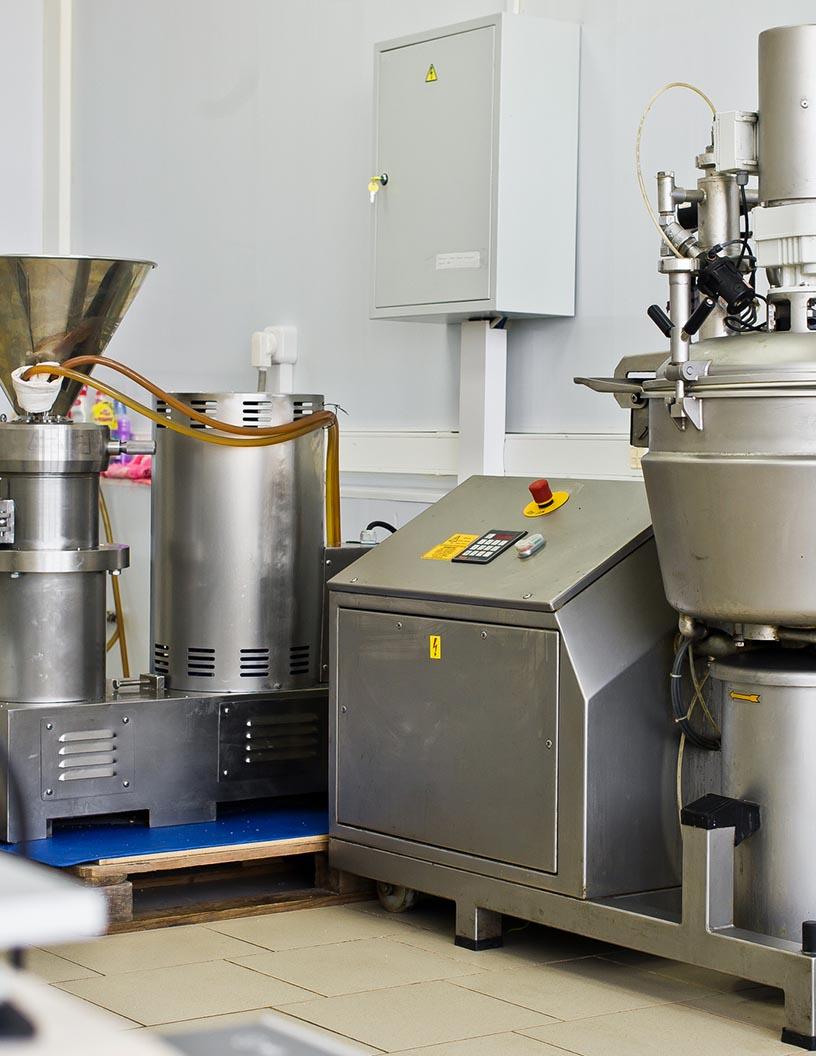
- The market encompasses a range of equipment used in the production of ready-to-eat goods and dairy food products. Key market drivers include the increasing demand for processed food items in developing nations and the growing health awareness trend leading to the production of more natural, minimally processed foods. High shear mixers, screw mixers, double cone blenders, ribbon blenders, planetary mixers, and batch mixing systems are among the commonly used equipment in this market. Raw materials, such as powders, liquids, and pastes, are blended and mixed using these industrial-scale machines to create a wide array of food products.
- Both continuous mixing and automatic mode operations are utilized to enhance production efficiency and ensure consistent product quality. Overall, the market is experiencing strong growth due to the expanding food processing industry and the rising demand for convenient, ready-to-eat food products.
How is this Industrial Food Blender And Mixer Industry segmented?
The industrial food blender and mixer industry research report provides comprehensive data (region-wise segment analysis), with forecasts and estimates in "USD million" for the period 2025-2029, as well as historical data from 2019-2023 for the following segments.
- Product
- High shear mixer
- Ribbon blender
- Shaft mixer
- Planetary mixer
- Others
- Type
- End-user
- Food processing industry
- Food service industry
- Distribution Channel
- Geography
- Europe
- France
- Germany
- Italy
- Spain
- UK
- North America
- APAC
- Middle East and Africa
- South America
By Product Insights
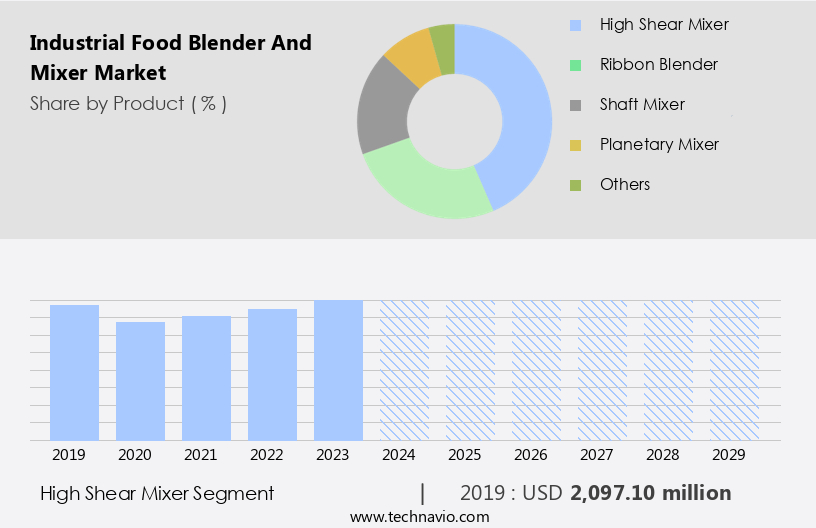
The high shear mixer segment is estimated to witness significant growth during the forecast period. High-shear mixers are essential tools in food manufacturing, enabling the production of homogeneous mixtures for various food products. These mixers, which incorporate a high-speed rotor within a stationary stator, are primarily used for preparing sauces, salsa, sandwich spreads, syrups, oil, gravies, marinades, and gels. The shearing action of the rotating blades and the turbulence created facilitate quick homogenization of the mixture, ensuring efficient production of food items. High-shear mixers are particularly effective for preparing fluid-based products, such as soups and sauces, and are widely used in the beverage industry.
They are also suitable for processing raw materials and raw ingredients for human consumption, including nutrition bars, extruded snacks, bakery products, batter-coated products, and better-finished products. Multifunctional equipment, including power-consuming equipment, is available to handle difficult-to-mix gel structures and shear-thinning materials.

Get a glance at the market report of share of various segments Request Free Sample
The High shear mixer segment was valued at USD 2.1 billion in 2019 and showed a gradual increase during the forecast period.
Regional Analysis
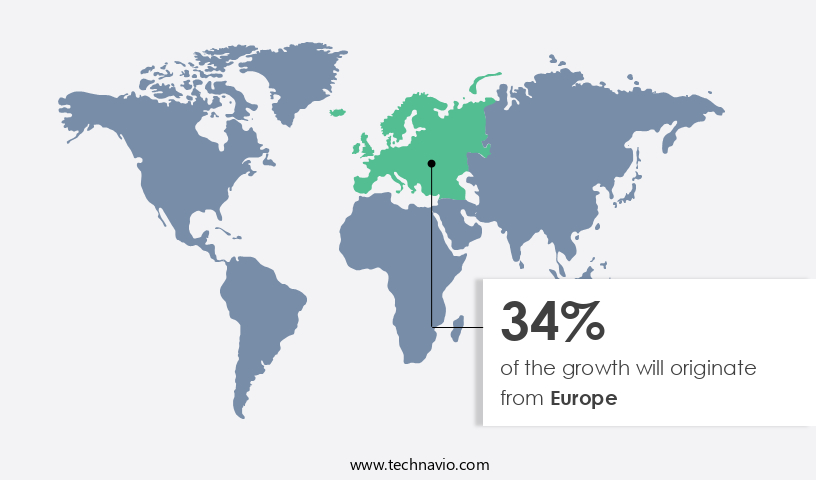
Europe is estimated to contribute 34% to the growth of the global market during the forecast period. Technavio's analysts have elaborately explained the regional trends and drivers that shape the market during the forecast period.

For more insights on the market size of various regions, Request Free Sample
The European market witnessed significant growth in 2024, driven by the expansion of the packaged confectionery sector and the adoption of energy-efficient mixing technologies. Key contributing countries include Germany, the UK, and France, where high consumption of confectionary products, particularly chocolate, fuels demand for high-quality food mixers. The market is further driven by the increasing production of ready-to-eat goods, dairy food products, and other human consumption items in developing nations.
Industrial food blenders and mixers are essential for the production of nutrition bars, extruded snacks, bakery products, batter-coated products, soups & sauces, and better-finished products. Advanced equipment, such as high-shear mixers, offer advantages like agglomerate-free dispersion, homogeneous mixing, and deaeration processes. The beverage industry also benefits from high-shear mixers for fluid-based product mixing.
Market Dynamics
Our researchers analyzed the data with 2024 as the base year, along with the key drivers, trends, and challenges. A holistic analysis of drivers will help companies refine their marketing strategies to gain a competitive advantage.
What are the key market drivers leading to the rise in the adoption of the Industrial Food Blender And Mixer Industry?
- Steady growth of the food processing industry is the key driver of the market. The global market for industrial food blenders and mixers has witnessed significant growth in recent years due to the increasing importance of food processing in the food industry. The trend towards convenience foods with minimal preparation time has led food companies to expand their offerings of processed food products, thereby driving demand for industrial food blenders and mixers. Furthermore, government initiatives in emerging economies, such as India, are supporting the food processing sector, which is expected to increase the adoption of these machines for food processing applications.
- For instance, during the Union Budget 2023-2024, the Indian government announced substantial investments in the food processing sector. This investment is expected to create opportunities for market growth in the forecast period.
What are the market trends shaping the Industrial Food Blender And Mixer Industry?
- Advancements in food processing technology are the upcoming market trend. The market has witnessed significant progress in food processing technology, fueled by the rising demand for efficient and superior quality food production. A notable technological innovation is the emergence of high shear mixers, which are extensively utilized for emulsification and particle size reduction. These mixers play a pivotal role in generating smooth and uniform food products, making them indispensable in contemporary food processing facilities.
- Furthermore, the advent of smart and multifunctional blenders has transformed the market landscape. Equipped with features such as preset programs, Bluetooth connectivity, and energy-efficient motors, these blenders cater to the demands of tech-savvy consumers and commercial kitchens alike.
What challenges does the Industrial Food Blender And Mixer Industry face during its growth?
- High energy consumption by industrial food blenders and mixers is a key challenge affecting the industry's growth. Blending and mixing are essential processes in various industries, particularly in food and beverages. These processes can be energy-intensive due to the varying viscosity of raw materials. Intensive blending and mixing consume more power compared to non-intensive processes.
- For instance, in the food industry, some ingredients with lower viscosity can be efficiently mixed using shaft mixers or shear mixers. However, those with higher viscosity may necessitate additional equipment like multi-agitators and blades for effective mixing, leading to increased power consumption. These dynamics is crucial for companies to optimize energy usage and improve operational efficiency.
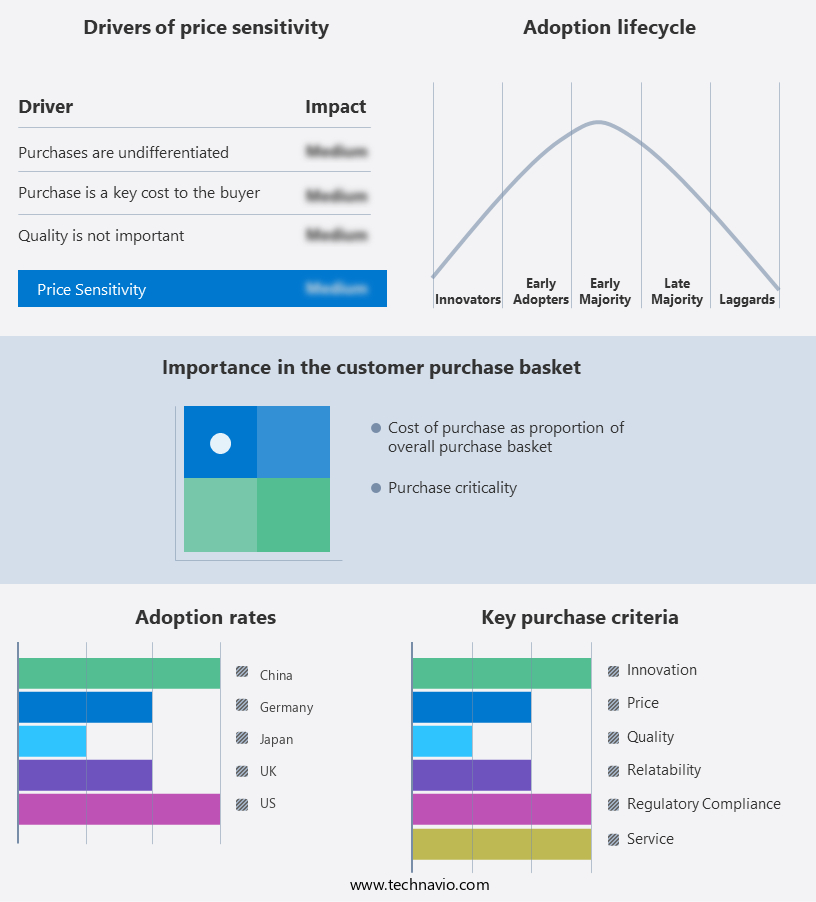
Exclusive Customer Landscape
The industrial food blender and mixer market forecasting report includes the adoption lifecycle of the market, covering from the innovator's stage to the laggard's stage. It focuses on adoption rates in different regions based on penetration. Furthermore, the industrial food blender and mixer market report also include key purchase criteria and drivers of price sensitivity to help companies evaluate and develop their market growth analysis strategies.

Customer Landscape
Key Companies & Market Insights
Companies are implementing various strategies, such as strategic alliances, industrial food blender and mixer market forecast, partnerships, mergers and acquisitions, geographical expansion, and product/service launches, to enhance their presence in the industry.
Admix Inc. - The company offers industrial food blenders and mixers such as Dynashear inline mixers.
The industry research and growth report includes detailed analyses of the competitive landscape of the market and information about key companies, including:
- Admix Inc.
- Alfa Laval AB
- amixon GmbH
- Charles Ross and Son Co.
- EKATO HOLDING GmbH
- Frain Industries
- GEA Group AG
- JWB Systems Inc.
- Kady International
- Lindor Products BV
- Paul O. Abbe
- Satake MultiMix Corp.
- Silverson Machines Inc.
- SPX FLOW Inc.
- Statiflo Group
- Sulzer Ltd.
- Xylem Inc.
Qualitative and quantitative analysis of companies has been conducted to help clients understand the wider business environment as well as the strengths and weaknesses of key industry players. Data is qualitatively analyzed to categorize companies as pure play, category-focused, industry-focused, and diversified; it is quantitatively analyzed to categorize companies as dominant, leading, strong, tentative, and weak.
Research Analyst Overview
The market encompasses a diverse range of equipment used in the production of various foodstuffs for human consumption. These machines play a crucial role in the processing of ready-to-eat goods, such as dairy food products, nutrition bars, extruded snacks, bakery products, batter-coated products, soups & sauces, and better-finished products. Manufacturers in this sector focus on creating multifunctional equipment that can handle a wide array of raw materials and raw ingredients. The challenge lies in ensuring agglomerate-free dispersion and homogeneous mixing, particularly with difficult-to-mix substances like gel structures and shear-thinning materials. In the food industry, high-shear mixers have gained significant popularity due to their ability to create a fine dispersion of minor ingredients in fluid-based product mixing.
The beverage industry, in particular, heavily relies on high-shear mixers for the production of various beverages, including frozen drinks. Power-consuming equipment, such as double cone blenders, ribbon blenders, planetary mixers, and screw mixers, are essential in the food processing sector. These machines cater to different mixing requirements, including batch mixing, continuous mixing, automatic mode, and semi-automatic mode. Tumble blending and vacuum mixing are other techniques used to ensure thorough mixing and deaeration processes in a closed system. The increasing health awareness among consumers has led to a growing demand for better-finished products with improved nutrition and taste. This trend has driven the development of custom-designed mixers that cater to specific food processing needs, ensuring homogeneous mixing and maintaining the desired texture and consistency of the final product.
The use of electrical kitchen appliances, such as high-shear mixers, ribbon blenders, shaft mixers, and vacuum technology, has revolutionized food processing, enabling manufacturers to produce high-quality products efficiently and cost-effectively. Ultra-high shear mixers have emerged as a popular choice for manufacturers due to their ability to create fine dispersions and homogeneous mixtures in a short time. These mixers are widely used in various industries, including food and beverage, pharmaceuticals, and cosmetics, to name a few. The market is a dynamic and evolving sector that plays a vital role in the production of various foodstuffs for human consumption.
Manufacturers continue to innovate and develop new technologies to meet the growing demand for better-finished products with improved nutrition and taste while ensuring efficient and cost-effective production processes. Guar gum, commonly used in various industries for its thickening and stabilizing properties, can sometimes be difficult to mix due to its gel structure and shear-thinning behavior. When mixing guar gum with other ingredients, traditional methods may struggle to effectively blend the components, leading to uneven textures. High-shear mixers are often employed to overcome this challenge, providing the necessary force to break down clumps and achieve a smooth consistency. Alternatively, a screw mixer, which operates by rotating a screw to move ingredients, can also be effective in uniformly mixing guar gum in certain formulations. Additionally, spinning blades can further enhance mixing, while the deaeration process can help remove air pockets, ensuring a more consistent and stable final product.
Market Scope
|
Report Coverage
|
Details
|
Page number
|
238
|
Base year
|
2024
|
Historic period
|
2019-2023 |
Forecast period
|
2025-2029
|
Growth momentum & CAGR
|
Accelerate at a CAGR of 7.5%
|
Market Growth 2025-2029
|
USD 4.26 Billion
|
Market structure
|
Fragmented
|
YoY growth 2024-2025(%)
|
6.9
|
Key countries
|
US, Germany, UK, Canada, China, France, Japan, India, Italy, and Spain
|
Competitive landscape
|
Leading Companies, Market Positioning of Companies, Competitive Strategies, and Industry Risks
|
Request Free Sample
What are the Key Data Covered in this Industrial Food Blender And Mixer Market Research and Growth Report?
- CAGR of the Industrial Food Blender And Mixer industry during the forecast period
- Detailed information on factors that will drive the growth and forecasting between 2025 and 2029
- Precise estimation of the size of the market and its contribution of the industry in focus to the parent market
- Accurate predictions about upcoming growth and trends and changes in consumer behaviour
- Growth of the market across Europe, North America, APAC, Middle East and Africa, and South America
- Thorough analysis of the market's competitive landscape and detailed information about companies
- Comprehensive analysis of factors that will challenge the industrial food blender and mixer market growth and forecasting
We can help! Our analysts can customize this industrial food blender and mixer market research report to meet your requirements.
Get in touch
1 Executive Summary
- 1.1 Market overview
- Executive Summary - Chart on Market Overview
- Executive Summary - Data Table on Market Overview
- Executive Summary - Chart on Global Market Characteristics
- Executive Summary - Chart on Market by Geography
- Executive Summary - Chart on Market Segmentation by Product
- Executive Summary - Chart on Market Segmentation by Type
- Executive Summary - Chart on Market Segmentation by End-user
- Executive Summary - Chart on Market Segmentation by Distribution Channel
- Executive Summary - Chart on Incremental Growth
- Executive Summary - Data Table on Incremental Growth
- Executive Summary - Chart on Company Market Positioning
2 Technavio Analysis
- 2.1 Analysis of price sensitivity, lifecycle, customer purchase basket, adoption rates, and purchase criteria
- Analysis of price sensitivity, lifecycle, customer purchase basket, adoption rates, and purchase criteria
- 2.2 Criticality of inputs and Factors of differentiation
- Overview on criticality of inputs and factors of differentiation
- 2.3 Factors of disruption
- Overview on factors of disruption
- 2.4 Impact of drivers and challenges
- Impact of drivers and challenges in 2024 and 2029
3 Market Landscape
- 3.1 Market ecosystem
- Parent Market
- Data Table on - Parent Market
- 3.2 Market characteristics
- Market characteristics analysis
4 Market Sizing
- 4.1 Market definition
- Offerings of companies included in the market definition
- 4.2 Market segment analysis
- 4.4 Market outlook: Forecast for 2024-2029
- Chart on Global - Market size and forecast 2024-2029 ($ million)
- Data Table on Global - Market size and forecast 2024-2029 ($ million)
- Chart on Global Market: Year-over-year growth 2024-2029 (%)
- Data Table on Global Market: Year-over-year growth 2024-2029 (%)
5 Historic Market Size
- 5.1 Global Industrial Food Blender And Mixer Market 2019 - 2023
- Historic Market Size - Data Table on Global Industrial Food Blender And Mixer Market 2019 - 2023 ($ million)
- 5.2 Product segment analysis 2019 - 2023
- Historic Market Size - Product Segment 2019 - 2023 ($ million)
- 5.3 Type segment analysis 2019 - 2023
- Historic Market Size - Type Segment 2019 - 2023 ($ million)
- 5.4 End-user segment analysis 2019 - 2023
- Historic Market Size - End-user Segment 2019 - 2023 ($ million)
- 5.5 Distribution Channel segment analysis 2019 - 2023
- Historic Market Size - Distribution Channel Segment 2019 - 2023 ($ million)
- 5.6 Geography segment analysis 2019 - 2023
- Historic Market Size - Geography Segment 2019 - 2023 ($ million)
- 5.7 Country segment analysis 2019 - 2023
- Historic Market Size - Country Segment 2019 - 2023 ($ million)
6 Qualitative Analysis
- 6.1 Impact of AI on Global Industrial Food Blender and Mixer Market
7 Five Forces Analysis
- 7.1 Five forces summary
- Five forces analysis - Comparison between 2024 and 2029
- 7.2 Bargaining power of buyers
- Bargaining power of buyers - Impact of key factors 2024 and 2029
- 7.3 Bargaining power of suppliers
- Bargaining power of suppliers - Impact of key factors in 2024 and 2029
- 7.4 Threat of new entrants
- Threat of new entrants - Impact of key factors in 2024 and 2029
- 7.5 Threat of substitutes
- Threat of substitutes - Impact of key factors in 2024 and 2029
- 7.6 Threat of rivalry
- Threat of rivalry - Impact of key factors in 2024 and 2029
- 7.7 Market condition
- Chart on Market condition - Five forces 2024 and 2029
8 Market Segmentation by Product
- 8.1 Market segments
- Chart on Product - Market share 2024-2029 (%)
- Data Table on Product - Market share 2024-2029 (%)
- 8.2 Comparison by Product
- Chart on Comparison by Product
- Data Table on Comparison by Product
- 8.3 High shear mixer - Market size and forecast 2024-2029
- Chart on High shear mixer - Market size and forecast 2024-2029 ($ million)
- Data Table on High shear mixer - Market size and forecast 2024-2029 ($ million)
- Chart on High shear mixer - Year-over-year growth 2024-2029 (%)
- Data Table on High shear mixer - Year-over-year growth 2024-2029 (%)
- 8.4 Ribbon blender - Market size and forecast 2024-2029
- Chart on Ribbon blender - Market size and forecast 2024-2029 ($ million)
- Data Table on Ribbon blender - Market size and forecast 2024-2029 ($ million)
- Chart on Ribbon blender - Year-over-year growth 2024-2029 (%)
- Data Table on Ribbon blender - Year-over-year growth 2024-2029 (%)
- 8.5 Shaft mixer - Market size and forecast 2024-2029
- Chart on Shaft mixer - Market size and forecast 2024-2029 ($ million)
- Data Table on Shaft mixer - Market size and forecast 2024-2029 ($ million)
- Chart on Shaft mixer - Year-over-year growth 2024-2029 (%)
- Data Table on Shaft mixer - Year-over-year growth 2024-2029 (%)
- 8.6 Planetary mixer - Market size and forecast 2024-2029
- Chart on Planetary mixer - Market size and forecast 2024-2029 ($ million)
- Data Table on Planetary mixer - Market size and forecast 2024-2029 ($ million)
- Chart on Planetary mixer - Year-over-year growth 2024-2029 (%)
- Data Table on Planetary mixer - Year-over-year growth 2024-2029 (%)
- 8.7 Others - Market size and forecast 2024-2029
- Chart on Others - Market size and forecast 2024-2029 ($ million)
- Data Table on Others - Market size and forecast 2024-2029 ($ million)
- Chart on Others - Year-over-year growth 2024-2029 (%)
- Data Table on Others - Year-over-year growth 2024-2029 (%)
- 8.8 Market opportunity by Product
- Market opportunity by Product ($ million)
- Data Table on Market opportunity by Product ($ million)
9 Market Segmentation by Type
- 9.1 Market segments
- Chart on Type - Market share 2024-2029 (%)
- Data Table on Type - Market share 2024-2029 (%)
- 9.2 Comparison by Type
- Chart on Comparison by Type
- Data Table on Comparison by Type
- 9.3 Automatic - Market size and forecast 2024-2029
- Chart on Automatic - Market size and forecast 2024-2029 ($ million)
- Data Table on Automatic - Market size and forecast 2024-2029 ($ million)
- Chart on Automatic - Year-over-year growth 2024-2029 (%)
- Data Table on Automatic - Year-over-year growth 2024-2029 (%)
- 9.4 Semi-automatic - Market size and forecast 2024-2029
- Chart on Semi-automatic - Market size and forecast 2024-2029 ($ million)
- Data Table on Semi-automatic - Market size and forecast 2024-2029 ($ million)
- Chart on Semi-automatic - Year-over-year growth 2024-2029 (%)
- Data Table on Semi-automatic - Year-over-year growth 2024-2029 (%)
- 9.5 Market opportunity by Type
- Market opportunity by Type ($ million)
- Data Table on Market opportunity by Type ($ million)
10 Market Segmentation by End-user
- 10.1 Market segments
- Chart on End-user - Market share 2024-2029 (%)
- Data Table on End-user - Market share 2024-2029 (%)
- 10.2 Comparison by End-user
- Chart on Comparison by End-user
- Data Table on Comparison by End-user
- 10.3 Food processing industry - Market size and forecast 2024-2029
- Chart on Food processing industry - Market size and forecast 2024-2029 ($ million)
- Data Table on Food processing industry - Market size and forecast 2024-2029 ($ million)
- Chart on Food processing industry - Year-over-year growth 2024-2029 (%)
- Data Table on Food processing industry - Year-over-year growth 2024-2029 (%)
- 10.4 Food service industry - Market size and forecast 2024-2029
- Chart on Food service industry - Market size and forecast 2024-2029 ($ million)
- Data Table on Food service industry - Market size and forecast 2024-2029 ($ million)
- Chart on Food service industry - Year-over-year growth 2024-2029 (%)
- Data Table on Food service industry - Year-over-year growth 2024-2029 (%)
- 10.5 Market opportunity by End-user
- Market opportunity by End-user ($ million)
- Data Table on Market opportunity by End-user ($ million)
11 Market Segmentation by Distribution Channel
- 11.1 Market segments
- Chart on Distribution Channel - Market share 2024-2029 (%)
- Data Table on Distribution Channel - Market share 2024-2029 (%)
- 11.2 Comparison by Distribution Channel
- Chart on Comparison by Distribution Channel
- Data Table on Comparison by Distribution Channel
- 11.3 Offline - Market size and forecast 2024-2029
- Chart on Offline - Market size and forecast 2024-2029 ($ million)
- Data Table on Offline - Market size and forecast 2024-2029 ($ million)
- Chart on Offline - Year-over-year growth 2024-2029 (%)
- Data Table on Offline - Year-over-year growth 2024-2029 (%)
- 11.4 Online - Market size and forecast 2024-2029
- Chart on Online - Market size and forecast 2024-2029 ($ million)
- Data Table on Online - Market size and forecast 2024-2029 ($ million)
- Chart on Online - Year-over-year growth 2024-2029 (%)
- Data Table on Online - Year-over-year growth 2024-2029 (%)
- 11.5 Market opportunity by Distribution Channel
- Market opportunity by Distribution Channel ($ million)
- Data Table on Market opportunity by Distribution Channel ($ million)
12 Customer Landscape
- 12.1 Customer landscape overview
- Analysis of price sensitivity, lifecycle, customer purchase basket, adoption rates, and purchase criteria
13 Geographic Landscape
- 13.1 Geographic segmentation
- Chart on Market share by geography 2024-2029 (%)
- Data Table on Market share by geography 2024-2029 (%)
- 13.2 Geographic comparison
- Chart on Geographic comparison
- Data Table on Geographic comparison
- 13.3 Europe - Market size and forecast 2024-2029
- Chart on Europe - Market size and forecast 2024-2029 ($ million)
- Data Table on Europe - Market size and forecast 2024-2029 ($ million)
- Chart on Europe - Year-over-year growth 2024-2029 (%)
- Data Table on Europe - Year-over-year growth 2024-2029 (%)
- 13.4 North America - Market size and forecast 2024-2029
- Chart on North America - Market size and forecast 2024-2029 ($ million)
- Data Table on North America - Market size and forecast 2024-2029 ($ million)
- Chart on North America - Year-over-year growth 2024-2029 (%)
- Data Table on North America - Year-over-year growth 2024-2029 (%)
- 13.5 APAC - Market size and forecast 2024-2029
- Chart on APAC - Market size and forecast 2024-2029 ($ million)
- Data Table on APAC - Market size and forecast 2024-2029 ($ million)
- Chart on APAC - Year-over-year growth 2024-2029 (%)
- Data Table on APAC - Year-over-year growth 2024-2029 (%)
- 13.6 Middle East and Africa - Market size and forecast 2024-2029
- Chart on Middle East and Africa - Market size and forecast 2024-2029 ($ million)
- Data Table on Middle East and Africa - Market size and forecast 2024-2029 ($ million)
- Chart on Middle East and Africa - Year-over-year growth 2024-2029 (%)
- Data Table on Middle East and Africa - Year-over-year growth 2024-2029 (%)
- 13.7 South America - Market size and forecast 2024-2029
- Chart on South America - Market size and forecast 2024-2029 ($ million)
- Data Table on South America - Market size and forecast 2024-2029 ($ million)
- Chart on South America - Year-over-year growth 2024-2029 (%)
- Data Table on South America - Year-over-year growth 2024-2029 (%)
- 13.8 US - Market size and forecast 2024-2029
- Chart on US - Market size and forecast 2024-2029 ($ million)
- Data Table on US - Market size and forecast 2024-2029 ($ million)
- Chart on US - Year-over-year growth 2024-2029 (%)
- Data Table on US - Year-over-year growth 2024-2029 (%)
- 13.9 Germany - Market size and forecast 2024-2029
- Chart on Germany - Market size and forecast 2024-2029 ($ million)
- Data Table on Germany - Market size and forecast 2024-2029 ($ million)
- Chart on Germany - Year-over-year growth 2024-2029 (%)
- Data Table on Germany - Year-over-year growth 2024-2029 (%)
- 13.10 UK - Market size and forecast 2024-2029
- Chart on UK - Market size and forecast 2024-2029 ($ million)
- Data Table on UK - Market size and forecast 2024-2029 ($ million)
- Chart on UK - Year-over-year growth 2024-2029 (%)
- Data Table on UK - Year-over-year growth 2024-2029 (%)
- 13.11 China - Market size and forecast 2024-2029
- Chart on China - Market size and forecast 2024-2029 ($ million)
- Data Table on China - Market size and forecast 2024-2029 ($ million)
- Chart on China - Year-over-year growth 2024-2029 (%)
- Data Table on China - Year-over-year growth 2024-2029 (%)
- 13.12 Canada - Market size and forecast 2024-2029
- Chart on Canada - Market size and forecast 2024-2029 ($ million)
- Data Table on Canada - Market size and forecast 2024-2029 ($ million)
- Chart on Canada - Year-over-year growth 2024-2029 (%)
- Data Table on Canada - Year-over-year growth 2024-2029 (%)
- 13.13 France - Market size and forecast 2024-2029
- Chart on France - Market size and forecast 2024-2029 ($ million)
- Data Table on France - Market size and forecast 2024-2029 ($ million)
- Chart on France - Year-over-year growth 2024-2029 (%)
- Data Table on France - Year-over-year growth 2024-2029 (%)
- 13.14 Japan - Market size and forecast 2024-2029
- Chart on Japan - Market size and forecast 2024-2029 ($ million)
- Data Table on Japan - Market size and forecast 2024-2029 ($ million)
- Chart on Japan - Year-over-year growth 2024-2029 (%)
- Data Table on Japan - Year-over-year growth 2024-2029 (%)
- 13.15 India - Market size and forecast 2024-2029
- Chart on India - Market size and forecast 2024-2029 ($ million)
- Data Table on India - Market size and forecast 2024-2029 ($ million)
- Chart on India - Year-over-year growth 2024-2029 (%)
- Data Table on India - Year-over-year growth 2024-2029 (%)
- 13.16 Italy - Market size and forecast 2024-2029
- Chart on Italy - Market size and forecast 2024-2029 ($ million)
- Data Table on Italy - Market size and forecast 2024-2029 ($ million)
- Chart on Italy - Year-over-year growth 2024-2029 (%)
- Data Table on Italy - Year-over-year growth 2024-2029 (%)
- 13.17 Spain - Market size and forecast 2024-2029
- Chart on Spain - Market size and forecast 2024-2029 ($ million)
- Data Table on Spain - Market size and forecast 2024-2029 ($ million)
- Chart on Spain - Year-over-year growth 2024-2029 (%)
- Data Table on Spain - Year-over-year growth 2024-2029 (%)
- 13.18 Market opportunity by geography
- Market opportunity by geography ($ million)
- Data Tables on Market opportunity by geography ($ million)
14 Drivers, Challenges, and Opportunity/Restraints
- 14.3 Impact of drivers and challenges
- Impact of drivers and challenges in 2024 and 2029
- 14.4 Market opportunities/restraints
15 Competitive Landscape
- 15.2 Competitive Landscape
- Overview on criticality of inputs and factors of differentiation
- 15.3 Landscape disruption
- Overview on factors of disruption
- 15.4 Industry risks
- Impact of key risks on business
16 Competitive Analysis
- 16.2 Company ranking index
- 16.3 Market positioning of companies
- Matrix on companies position and classification
- 16.4 Admix Inc.
- Admix Inc. - Overview
- Admix Inc. - Product / Service
- Admix Inc. - Key offerings
- SWOT
- 16.5 Alfa Laval AB
- Alfa Laval AB - Overview
- Alfa Laval AB - Business segments
- Alfa Laval AB - Key news
- Alfa Laval AB - Key offerings
- Alfa Laval AB - Segment focus
- SWOT
- 16.6 amixon GmbH
- amixon GmbH - Overview
- amixon GmbH - Product / Service
- amixon GmbH - Key offerings
- SWOT
- 16.7 Charles Ross and Son Co.
- Charles Ross and Son Co. - Overview
- Charles Ross and Son Co. - Product / Service
- Charles Ross and Son Co. - Key offerings
- SWOT
- 16.8 EKATO HOLDING GmbH
- EKATO HOLDING GmbH - Overview
- EKATO HOLDING GmbH - Product / Service
- EKATO HOLDING GmbH - Key offerings
- SWOT
- 16.9 GEA Group AG
- GEA Group AG - Overview
- GEA Group AG - Business segments
- GEA Group AG - Key offerings
- GEA Group AG - Segment focus
- SWOT
- 16.10 JWB Systems Inc.
- JWB Systems Inc. - Overview
- JWB Systems Inc. - Product / Service
- JWB Systems Inc. - Key offerings
- SWOT
- 16.11 Kady International
- Kady International - Overview
- Kady International - Product / Service
- Kady International - Key offerings
- SWOT
- 16.12 Lindor Products BV
- Lindor Products BV - Overview
- Lindor Products BV - Product / Service
- Lindor Products BV - Key offerings
- SWOT
- 16.13 Paul O. Abbe
- Paul O. Abbe - Overview
- Paul O. Abbe - Product / Service
- Paul O. Abbe - Key offerings
- SWOT
- 16.14 Satake MultiMix Corp.
- Satake MultiMix Corp. - Overview
- Satake MultiMix Corp. - Product / Service
- Satake MultiMix Corp. - Key offerings
- SWOT
- 16.15 Silverson Machines Inc.
- Silverson Machines Inc. - Overview
- Silverson Machines Inc. - Product / Service
- Silverson Machines Inc. - Key offerings
- SWOT
- 16.16 SPX FLOW Inc.
- SPX FLOW Inc. - Overview
- SPX FLOW Inc. - Product / Service
- SPX FLOW Inc. - Key news
- SPX FLOW Inc. - Key offerings
- SWOT
- 16.17 Sulzer Ltd.
- Sulzer Ltd. - Overview
- Sulzer Ltd. - Business segments
- Sulzer Ltd. - Key news
- Sulzer Ltd. - Key offerings
- Sulzer Ltd. - Segment focus
- SWOT
- 16.18 Xylem Inc.
- Xylem Inc. - Overview
- Xylem Inc. - Business segments
- Xylem Inc. - Key news
- Xylem Inc. - Key offerings
- Xylem Inc. - Segment focus
- SWOT
17 Appendix
- 17.2 Inclusions and exclusions checklist
- Inclusions checklist
- Exclusions checklist
- 17.3 Currency conversion rates for US$
- Currency conversion rates for US$
- 17.4 Research methodology
- 17.7 Validation techniques employed for market sizing
- Validation techniques employed for market sizing
- 17.9 360 degree market analysis
- 360 degree market analysis
- 17.10 List of abbreviations