Europe Industrial Gases Market Size 2026-2030
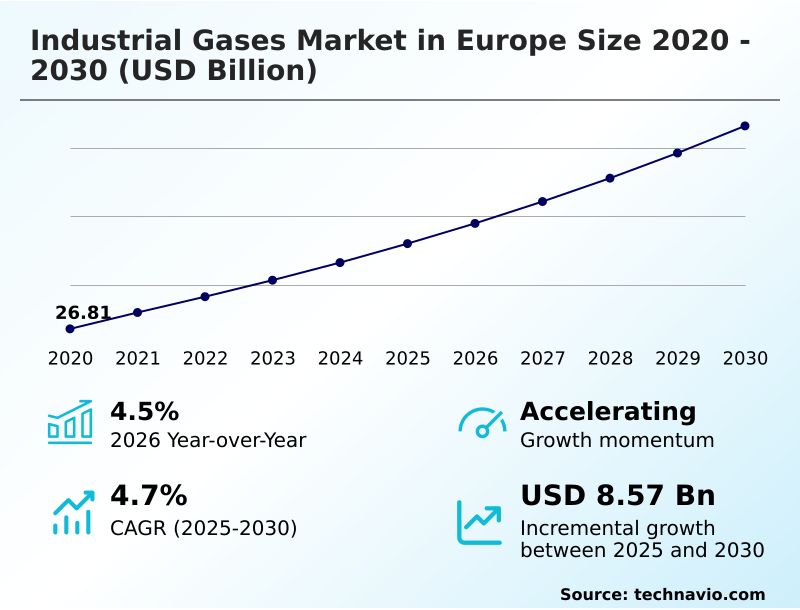
The europe industrial gases market size is valued to increase by USD 8.57 billion, at a CAGR of 4.7% from 2025 to 2030. Green hydrogen driving industrial transformation will drive the europe industrial gases market.
Major Market Trends & Insights
- By Distribution Channel - Packaged segment was valued at USD 12.02 billion in 2024
- By End-user - Chemical processing segment accounted for the largest market revenue share in 2024
Market Size & Forecast
- Market Opportunities: USD 14.76 billion
- Market Future Opportunities: USD 8.57 billion
- CAGR from 2025 to 2030 : 4.7%
Market Summary
- The industrial gases market in Europe is undergoing a profound transformation, driven by decarbonization mandates and the strategic push for industrial autonomy. Core to this shift is the expansion of green hydrogen production, facilitated by water electrolysis technology, to support hard-to-abate sectors like steel and chemicals. This creates significant demand for tonnage supply contracts and new hydrogen infrastructure development.
- Concurrently, carbon capture utilization and storage is gaining traction, with companies leveraging expertise in gas purification systems to create value from captured emissions, particularly for synthetic fuels production. However, the industry faces headwinds from volatile energy costs, which directly impact the profitability of energy-intensive processes like cryogenic air separation.
- A key business scenario involves optimizing supply chains for medical-grade oxygen and specialty gas mixtures, where supply chain reliability is paramount. To mitigate costs and improve service, leading firms are adopting smart manufacturing and decentralized production models, including on-site gas generation and advanced membrane separation, enhancing operational efficiency and aligning with circular economy principles.
What will be the Size of the Europe Industrial Gases Market during the forecast period?
Get Key Insights on Market Forecast (PDF) Get Free Sample
How is the Europe Industrial Gases Market Segmented?
The europe industrial gases industry research report provides comprehensive data (region-wise segment analysis), with forecasts and estimates in "USD million" for the period 2026-2030, as well as historical data from 2020-2024 for the following segments.
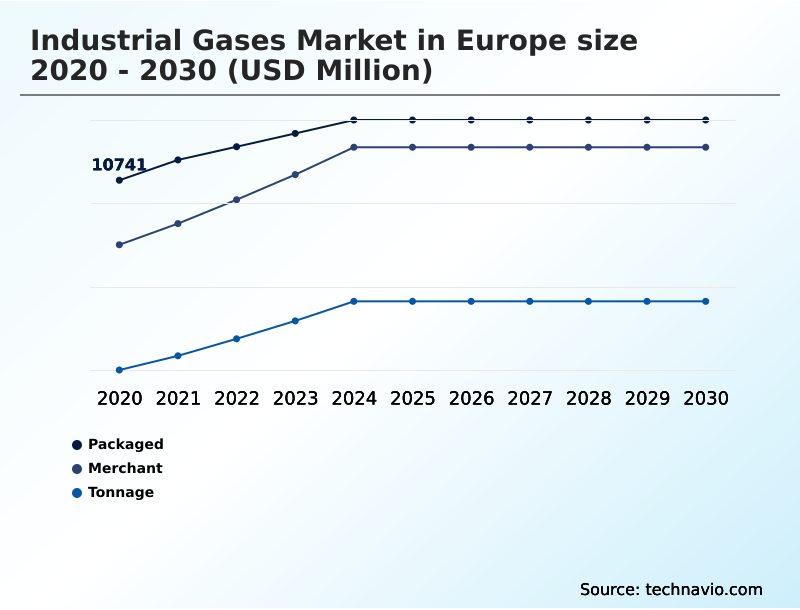
- Distribution channel
- Packaged
- Merchant
- Tonnage
- End-user
- Chemical processing
- Manufacturing
- Medical and healthcare
- Metallurgy
- Others
- Product
- Nitrogen
- Oxygen
- Carbon dioxide
- Hydrogen
- Others
- Geography
- Europe
- Germany
- France
- Italy
- Europe
By Distribution Channel Insights
The packaged segment is estimated to witness significant growth during the forecast period.
The packaged segment serves a diverse customer base with lower-volume needs, relying on cylinders and cryogenic liquid storage containers.
This distribution channel is logistically intensive, requiring sophisticated industrial gas logistics and asset management solutions to manage a vast network of filling plants and retail outlets.
Key applications include supplying specialty gas mixtures for high-purity gas applications in laboratories, precision welding gases for metal fabricators, and laser cutting gases for advanced manufacturing requirements.
The increasing focus on value-added services and digital integration, such as cylinder tracking, enables industrial process optimization and improves service for sectors like food and beverage processing, which uses food-grade carbon dioxide, and the medical gas supply chain, where reliability is critical.
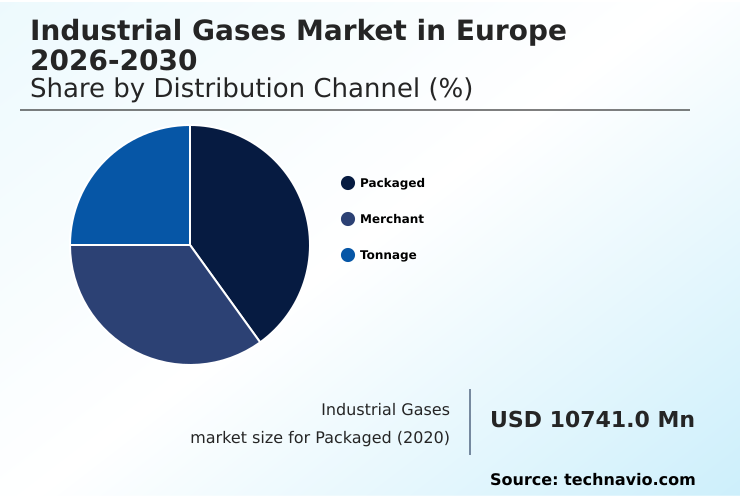
The Packaged segment was valued at USD 12.02 billion in 2024 and showed a gradual increase during the forecast period.
Market Dynamics
Our researchers analyzed the data with 2025 as the base year, along with the key drivers, trends, and challenges. A holistic analysis of drivers will help companies refine their marketing strategies to gain a competitive advantage.
- Strategic decision-making in the industrial gases market in Europe is increasingly complex, shaped by a confluence of economic and environmental factors. A primary concern is the cost of green hydrogen production Europe, which directly influences the viability of decarbonization projects.
- Businesses are evaluating the trade-offs between on-site nitrogen generation vs bulk supply, with on-site solutions potentially reducing supply chain costs by over 25% for certain consumers. The pivotal role of oxygen in green steel manufacturing is creating new, large-scale demand, while the progress of carbon dioxide capture for synthetic fuels is reshaping the value of CO2.
- Industries grapple with the impact of energy costs on gas prices, a challenge that affects everything from merchant vs tonnage industrial gas supply contracts to the logistics of cryogenic liquid transport and safety. The need for high-purity gases for semiconductor industry is driving investment in advanced gas purification and delivery systems.
- Key technical and regulatory questions persist, including the challenges in hydrogen transportation and storage and the stringent regulations for medical gas supply chain. The adoption of modular electrolyzers for decentralized hydrogen is seen as a way to mitigate some of these logistical hurdles. Argon gas applications in welding processes and nitrogen applications in food packaging remain stable demand pillars.
- Meanwhile, large-scale infrastructure projects, such as carbon capture infrastructure in north sea, are critical for meeting climate targets. The efficiency of air separation unit technology and the economics of the biogas upgrading to biomethane process are constantly being refined.
- In parallel, firms must navigate the financial implications of compliance with EU emissions trading system and mitigate the risk of carbon leakage in manufacturing, while assessing lng as a transitional fuel in Europe. The market for specialty gas mixtures for lab analysis also continues to grow, driven by R&D activities.
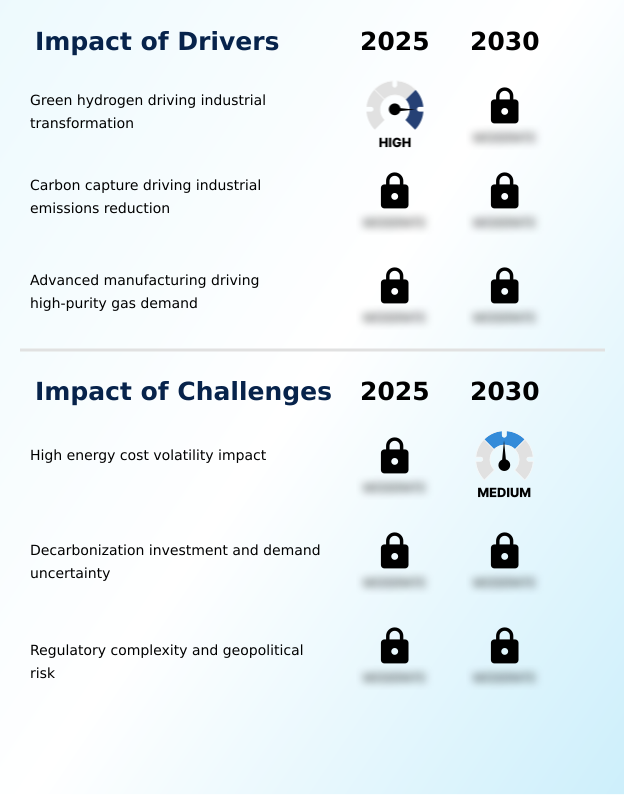
What are the key market drivers leading to the rise in the adoption of Europe Industrial Gases Industry?
- The adoption of green hydrogen is a primary market driver, fueling a broad industrial transformation toward decarbonization.
- The primary driver for the industrial gases market is the imperative for the decarbonization of heavy industry, propelled by stringent European Green Deal compliance targets.
- This has ignited a surge in demand for green hydrogen production, with the number of announced large-scale electrolyzer projects growing by over 50% in the last year.
- Industrial gas companies are becoming pivotal enablers of this clean energy transition, signing long-term tonnage supply contracts to provide hydrogen for steel manufacturing decarbonization via the direct reduced iron process.
- Concurrently, the implementation of carbon capture, utilization, and storage is creating new revenue streams, where captured CO2 is used as a chemical synthesis feedstock for products like e-methanol.
- Demand for ultra-high-purity gases is also rising, driven by investments in advanced sectors seeking to achieve carbon-neutral manufacturing.
What are the market trends shaping the Europe Industrial Gases Industry?
- A key market trend involves the increasing integration of AI-driven digitalization, which is being leveraged to substantially enhance energy efficiency throughout industrial gas production and operational logistics.
- A key trend is the strategic shift toward decentralized production models, empowering industrial consumers and improving supply chain reliability. The deployment of modular, on-site gas generation units using advanced pressure swing adsorption and membrane technologies allows manufacturers to achieve gas independence, with some users reporting up to a 20% reduction in gas-related logistics costs.
- This trend is particularly evident in hydrogen, where on-site water electrolysis technology aligns with the clean energy transition. Furthermore, the focus on circular economy principles is driving innovation in carbon utilization, where captured CO2 is transformed into synthetic fuels production for hard-to-abate sectors, contributing to the development of sustainable aviation fuels.
- This pivot toward localized and value-added production enhances energy efficiency in gas production and supports broader industrial process optimization goals.
What challenges does the Europe Industrial Gases Industry face during its growth?
- The high volatility of energy costs presents a primary challenge, significantly impacting profitability and growth within the industry.
- A major challenge is the extreme volatility of energy costs, which can increase the operating expense of energy-intensive processes like cryogenic air separation by as much as 40% during peak periods, compressing margins. This uncertainty complicates the significant upfront capital required for decarbonization projects, such as investment in electrolyzers and infrastructure for subsea carbon storage.
- The high cost and long payback periods create a commercial dilemma, slowing final investment decisions despite the push for an industrial autonomy strategy. Furthermore, navigating the evolving regulatory landscape, including the rules of the emissions trading system and certification for high-purity gas applications like medical-grade oxygen and semiconductor fabrication gases, adds a layer of complexity.
- This environment increases business risk, potentially delaying the adoption of cleaner technologies like argon oxygen decarburization.
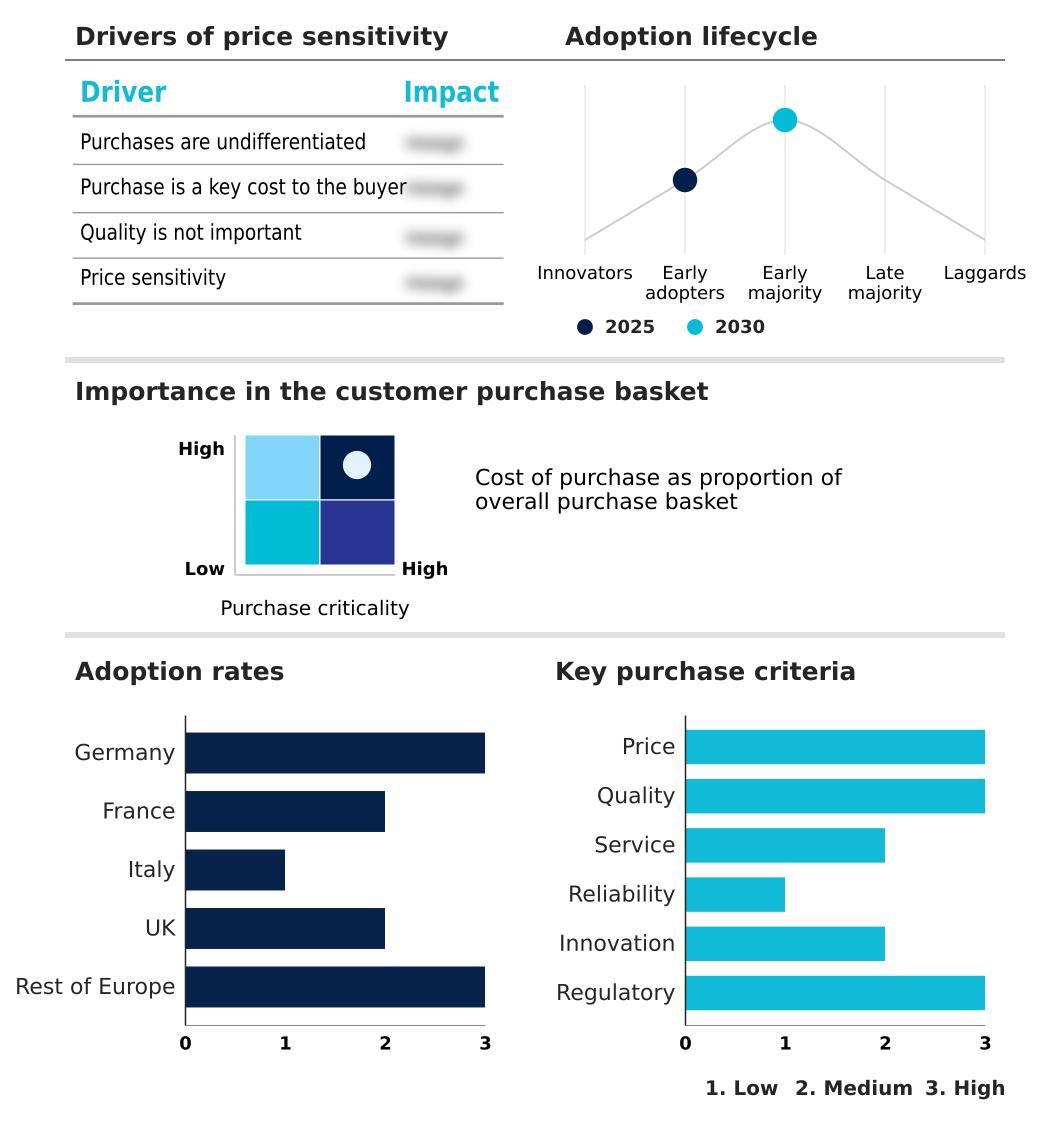
Exclusive Technavio Analysis on Customer Landscape
The europe industrial gases market forecasting report includes the adoption lifecycle of the market, covering from the innovator’s stage to the laggard’s stage. It focuses on adoption rates in different regions based on penetration. Furthermore, the europe industrial gases market report also includes key purchase criteria and drivers of price sensitivity to help companies evaluate and develop their market growth analysis strategies.
Customer Landscape of Europe Industrial Gases Industry
Competitive Landscape
Companies are implementing various strategies, such as strategic alliances, europe industrial gases market forecast, partnerships, mergers and acquisitions, geographical expansion, and product/service launches, to enhance their presence in the industry.
Air Liquide SA - A portfolio of essential atmospheric and process gases, including oxygen, nitrogen, and hydrogen, enables critical applications across the industrial, medical, and electronics sectors.
The industry research and growth report includes detailed analyses of the competitive landscape of the market and information about key companies, including:
- Air Liquide SA
- Air Products and Chem Inc.
- BASF SE
- BUSE KSW GmbH and Co. KG
- Cryogenmash
- Gasum Oy
- Gaz Systemes SAS
- IJsfabriek Strombeek
- Iwatani Corp.
- Linde Plc
- Messer SE and Co. KGaA
- PJSC Gazprom
- SIAD S.p.A.
- SOL Spa
- The Mitsubishi Chemical Group
- Tyczka GmbH
- Westfalen AG
- Yara International ASA
Qualitative and quantitative analysis of companies has been conducted to help clients understand the wider business environment as well as the strengths and weaknesses of key industry players. Data is qualitatively analyzed to categorize companies as pure play, category-focused, industry-focused, and diversified; it is quantitatively analyzed to categorize companies as dominant, leading, strong, tentative, and weak.
Recent Development and News in Europe industrial gases market
- In January 2025, Air Liquide announced it secured a contract with twenty hospitals across Europe to supply low-carbon oxygen and nitrogen, enhancing the sustainability of the medical gas supply chain.
- In January 2025, the German government confirmed that the Brunsbuttel FSRU project is on track to begin importing ammonia by 2026, a critical step for developing the nation's hydrogen infrastructure.
- In February 2025, Air Liquide announced a major investment exceeding one billion Euros in two large-scale renewable hydrogen projects in the Netherlands, aimed at decarbonizing industrial processes and the mobility sector.
- In March 2025, the European Commission launched the EU Steel and Metals Action Plan, a strategic framework designed to accelerate the decarbonization of the sector by supporting the shift to low-carbon production methods.
Dive into Technavio’s robust research methodology, blending expert interviews, extensive data synthesis, and validated models for unparalleled Europe Industrial Gases Market insights. See full methodology.
| Market Scope | |
|---|---|
| Page number | 229 |
| Base year | 2025 |
| Historic period | 2020-2024 |
| Forecast period | 2026-2030 |
| Growth momentum & CAGR | Accelerate at a CAGR of 4.7% |
| Market growth 2026-2030 | USD 8565.8 million |
| Market structure | Fragmented |
| YoY growth 2025-2026(%) | 4.5% |
| Key countries | Germany, France, Italy, UK and Rest of Europe |
| Competitive landscape | Leading Companies, Market Positioning of Companies, Competitive Strategies, and Industry Risks |
Research Analyst Overview
- The industrial gases market in Europe is pivoting towards sustainability and high-technology applications, fundamentally reshaping its operational and strategic landscape. The move away from traditional processes like steam methane reforming toward green hydrogen production, enabled by water electrolysis technology, is central to this shift.
- Companies are investing heavily in new air separation unit facilities and on-site gas generation systems that use advanced pressure swing adsorption and membrane separation to serve clients directly. This supports the growing demand for electronic-grade gases and ultra-high-purity gases required for semiconductor fabrication gases and precision welding gases.
- The decarbonization push in metallurgy is driving demand for both the direct reduced iron process and argon oxygen decarburization. In response, providers are optimizing industrial gas logistics for tonnage supply contracts. Moreover, carbon capture utilization and storage initiatives are creating new markets for captured CO2 in applications like synthetic fuels production and e-methanol synthesis.
- This transition allows some facilities to reduce their carbon footprint by over 30%. Technologies such as oxy-combustion technology and gasification processes are being refined, while applications like nitrogen blanketing, cryogenic freezing, and modified atmosphere packaging continue to be essential in manufacturing and food processing, using products like food-grade carbon dioxide.
- Firms are also expanding offerings in biogas upgrading, hydrocracking applications, and supplying laser cutting gases and hydrogen fuel cell technology, all managed through robust gas purification systems and cryogenic liquid storage infrastructure.
What are the Key Data Covered in this Europe Industrial Gases Market Research and Growth Report?
-
What is the expected growth of the Europe Industrial Gases Market between 2026 and 2030?
-
USD 8.57 billion, at a CAGR of 4.7%
-
-
What segmentation does the market report cover?
-
The report is segmented by Distribution Channel (Packaged, Merchant, and Tonnage), End-user (Chemical processing, Manufacturing, Medical and healthcare, Metallurgy, and Others), Product (Nitrogen, Oxygen, Carbon dioxide, Hydrogen, and Others) and Geography (Europe)
-
-
Which regions are analyzed in the report?
-
Europe
-
-
What are the key growth drivers and market challenges?
-
Green hydrogen driving industrial transformation, High energy cost volatility impact
-
-
Who are the major players in the Europe Industrial Gases Market?
-
Air Liquide SA, Air Products and Chem Inc., BASF SE, BUSE KSW GmbH and Co. KG, Cryogenmash, Gasum Oy, Gaz Systemes SAS, IJsfabriek Strombeek, Iwatani Corp., Linde Plc, Messer SE and Co. KGaA, PJSC Gazprom, SIAD S.p.A., SOL Spa, The Mitsubishi Chemical Group, Tyczka GmbH, Westfalen AG and Yara International ASA
-
Market Research Insights
- The dynamics of the industrial gases market are increasingly shaped by strategic imperatives like the decarbonization of heavy industry and compliance with the european green deal. The focus on industrial process optimization has led some firms to adopt on-site hydrogen generation, reducing logistical costs by over 15% compared to traditional bulk delivery.
- As advanced manufacturing requirements intensify, particularly in electronics, the demand for high-purity gas applications is rising. This shift is supported by investment in new hydrogen infrastructure development, with announced projects increasing by 40% year-over-year.
- However, the high capital expenditure for new facilities and the complexities of the emissions trading system create significant barriers, reinforcing the market position of established players who can manage both industrial autonomy strategy and supply chain reliability at scale.
We can help! Our analysts can customize this europe industrial gases market research report to meet your requirements.
 RIA -
RIA - 
