Marine Auxiliary Engine Market Size 2024-2028
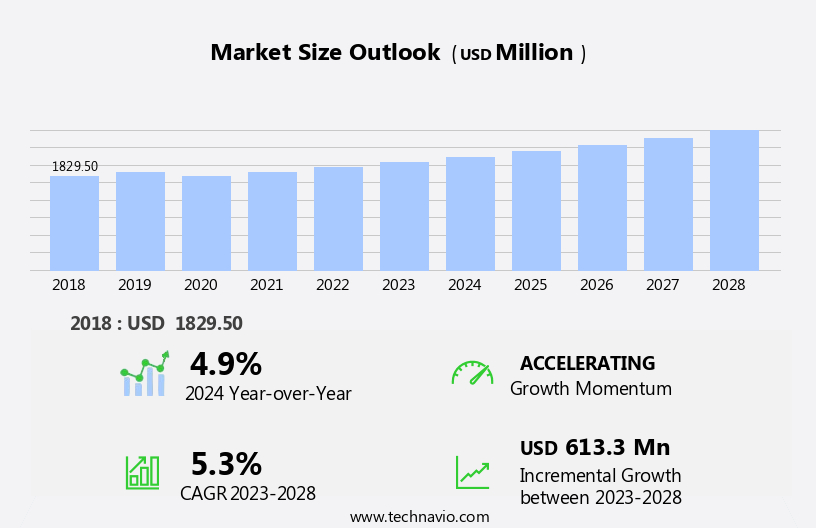
The marine auxiliary engine market size is forecast to increase by USD 613.3 million, at a CAGR of 5.3% between 2023 and 2028.
- The market is experiencing significant growth due to the expanding commercial shipping sector and the increasing adoption of alternative fuels, such as LNG, over conventional marine fuels. This shift towards cleaner and more sustainable energy sources is driving innovation in auxiliary equipment, including lighting, air conditioning, refrigeration, electrical systems, pumps, winches, and other essential equipment for cargo and passenger ships. The market is also influenced by global events, such as the impact of BREXIT on shipping regulations and trade policies. As the maritime industry continues to evolve, the demand for efficient and reliable auxiliary equipment will remain strong, making this an attractive market for investors and manufacturers alike.
What will be the Size of the Market During the Forecast Period?
- The market plays a crucial role in the maritime industry, providing power for various onboard functions in commercial shipping, including power generation, electricity, lighting, air conditioning, refrigeration, electrical systems, auxiliary equipment, pumps, winches, and hybrid systems. These engines are essential for the efficient operation of vessels, enabling them to perform tasks such as propulsion, maneuvering, and power generation. The maritime commerce sector, including container shipping, less-than-container load, full-container load, tankers, and LNG carriers, relies heavily on marine auxiliary engines. These engines are used to power the ship's auxiliary systems and provide auxiliary power during port stays or when the main engine is not in use. Marine auxiliary engines come in various types, including diesel engines and gas engines. Diesel engines are widely used due to their high efficiency, reliability, and low emissions. Gas engines, on the other hand, are gaining popularity due to their lower carbon footprint and the increasing use of LNG as a fuel mix.
- Digital transformation is transforming the market, with the adoption of remote monitoring systems and lifecycle management solutions. These technologies enable real-time monitoring of engine performance, predictive maintenance, and optimization of fuel consumption. Bunkering infrastructure is another critical aspect of the market. The availability and accessibility of fuel supply infrastructure significantly impact the operational efficiency and cost of vessels. Therefore, the development of efficient and reliable bunkering infrastructure is essential for the growth of the market. Marine auxiliary engines are also used in recreational boats for various onboard functions, including power generation, propulsion, and maneuvering. The recreational boat market is growing, and the demand for efficient and reliable marine auxiliary engines is increasing.
How is this market segmented and which is the largest segment?
The market research report provides comprehensive data (region-wise segment analysis), with forecasts and estimates in "USD million" for the period 2024-2028, as well as historical data from 2018-2022 for the following segments.
- Type
- Diesel
- Gas
- Engine Capacity
- 500-1500 kW
- Above 1500 kW
- Up to 500 kW
- Geography
- APAC
- China
- India
- Japan
- South Korea
- Europe
- Germany
- UK
- France
- Italy
- North America
- Canada
- US
- South America
- Middle East and Africa
- APAC
By Type Insights
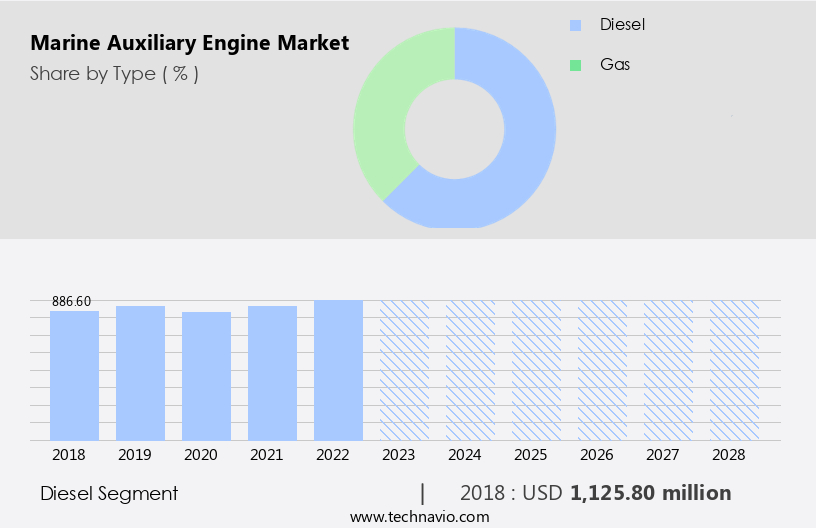
- The diesel segment is estimated to witness significant growth during the forecast period.
Marine auxiliary engines play a crucial role in powering various naval vessels and offshore platforms. In the maritime industry, diesel has traditionally been the fuel of choice due to its lower cost compared to other alternatives. However, the use of diesel comes with environmental concerns, as it contributes to pollutants. To address this issue, there has been a growing emphasis on cleaner technologies and energy-efficient components in marine auxiliary engines. This trend is particularly noticeable in the adoption of LPG marine auxiliary engines, which are considered more eco-friendly. The global shipbuilding industry is experiencing significant growth, with Asia Pacific (APAC) being a major driver.
Shipping line and maritime cargo operators are increasingly seeking ultra-large vessels that offer fuel efficiency and economies of scale. The presence of large shipbuilding yards and deep ports in APAC enables regional shipbuilders to meet this demand. Moreover, the international trade sector relies heavily on container transport and product tankers. The need for larger vessels to transport goods efficiently and cost-effectively is driving the demand for marine auxiliary engines. In this context, the use of low-carbon fuels such as LPG and methanol is gaining popularity as a sustainable solution to reduce carbon emissions.
Get a glance at the market report of share of various segments Request Free Sample
The diesel segment was valued at USD 1.13 billion in 2018 and showed a gradual increase during the forecast period.
Regional Analysis
- APAC is estimated to contribute 35% to the growth of the global market during the forecast period.
Technavio's analysts have elaborately explained the regional trends and drivers that shape the market during the forecast period.

For more insights on the market share of various regions Request Free Sample
Maritime commerce has long relied on shipping routes connecting Asia-Pacific and Europe as a significant transportation hub. Container ships have been instrumental in moving raw materials to one end and finished goods to the other. The economic advantage of mass production in Asia has fueled the expansion of container shipping, leading to the development of larger vessels. The global trade boom has driven the need for new ships, particularly container vessels and tankers, to transport commodities like oil, natural gas, and mineral ores. The shipbuilding industry in these countries has been a major contributor to the region's dominance in the market.
The demand for marine auxiliary engines is expected to continue growing due to the increasing focus on enhancing the efficiency and performance of ships in the commercial shipping sector. The container shipping industry's expansion and the growth of sea transportation as a whole are significant factors driving this market's growth.
Market Dynamics
Our researchers analyzed the data with 2023 as the base year, along with the key drivers, trends, and challenges. A holistic analysis of drivers will help companies refine their marketing strategies to gain a competitive advantage.
What are the key market drivers leading to the rise in adoption of Marine Auxiliary Engine Market ?
The growth of commercial shipping is the key driver of the market.
- The market has experienced significant growth due to the increasing globalization and expansion of international trade. As economies develop and grow, the demand for seaborne trade increases, making the marine industry a vital player in the global economy. The transportation of goods via sea primarily occurs in the form of containers, which can be categorized as less-than-container load (LCL) or full container load (FCL). Fuel mix is a crucial factor influencing the market. Traditionally, marine diesel has been the primary fuel source for low-speed engines used in commercial boats and fishing vessels. However, there is a growing trend towards reducing carbon emissions, leading to an increase in the use of alternative fuels such as liquefied natural gas (LNG) and biofuels
- Moreover, the shift towards sustainable energy sources has led to the emergence of battery-powered ferries. These ferries are gaining popularity due to their environmental benefits and cost-effectiveness in the long run. The tonnage age of the global commercial fleet is also a significant factor influencing the market. Older vessels are being retrofitted with more fuel-efficient engines to reduce operational costs and meet emission regulations. In conclusion, the market is driven by various factors, including fuel mix, tonnage age, and the growing demand for sustainable energy sources. The use of alternative fuels and the emergence of battery-powered ferries are expected to significantly impact the market in the coming years.
What are the market trends shaping the Marine Auxiliary Engine Market?
Gradual adoption of LNG over conventional marine fuel is the upcoming trend in the market.
- In the maritime sector, approximately 70% of fuel consumption is attributed to container ships, bulk carriers, general cargo vessels, and tankers, which transport various goods such as crude and chemical products. The shipping industry relies on various fuel types, including hydrofluoroolefin (HFO), marine diesel oil (MDO), marine gas oil (MGO), and bio-alternatives like biodiesel and straight vegetable oils.
- Furthermore, fuels such as LNG, biogas, methanol, and hydrogen, derived from methane or wood biomass, are also utilized. The marine engine market caters to the demand for auxiliary equipment, including lighting, air conditioning, refrigeration, electrical systems, pumps, and winches, on board cargo and passenger ships. The engine technology employed is contingent upon the fuel used, with options ranging from two-stroke and four-stroke diesel engines, diesel-electric motors, gas engines, and fuel cell technology.
What challenges does Marine Auxiliary Engine Market face during the growth?
The impact of BREXIT is a key challenge affecting the market growth.
- The European Union (EU), comprised of 28 member states, hosts some of the world's busiest container and passenger ports, such as Rotterdam, Hamburg, Antwerp, and Piraeus. With the EU being the United Kingdom's largest trading partner, accounting for approximately 45% of exports and 53% of imports of goods and services, it significantly impacts the UK economy, creating employment for over three million people. EU legislation, including treaties, regulations, and directives, covers various aspects, including trade, environmental regulations, international trade sanctions, competition law, employment, taxation, immigration, and infrastructure projects.
- In the marine industry, EU regulations influence the use of ship auxiliary engines, marine boilers, and power generation systems in recreational boats, security boats, and ammonia-fueled boats. Decarbonization efforts are a significant focus, with a shift towards electricity and onboard functions to reduce emissions. As the maritime sector continues to evolve, it is crucial for stakeholders to stay informed about the latest EU regulations and trends.
Exclusive Customer Landscape
The market forecasting report includes the adoption lifecycle of the market, covering from the innovator's stage to the laggard's stage. It focuses on adoption rates in different regions based on penetration. Furthermore, the market report also includes key purchase criteria and drivers of price sensitivity to help companies evaluate and develop their market growth analysis strategies.
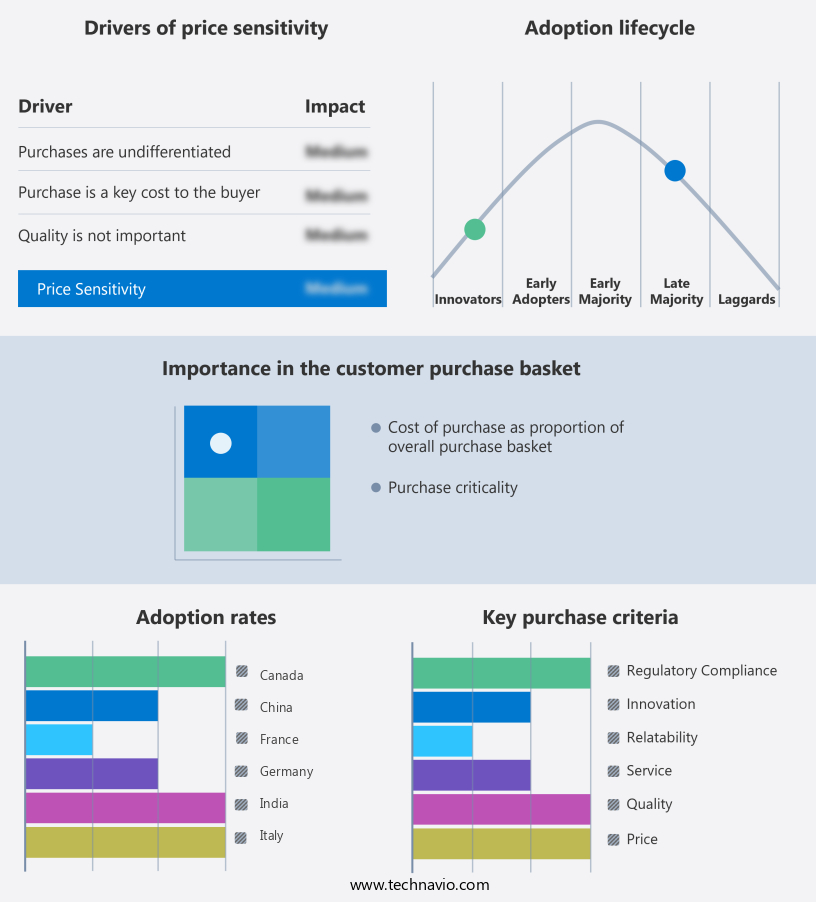
Customer Landscape
Key Companies & Market Insights
Companies are implementing various strategies, such as strategic alliances, market forecasts, partnerships, mergers and acquisitions, geographical expansion, and product/service launches, to enhance their presence in the market. The market research and growth report includes detailed analyses of the competitive landscape of the market and information about key companies, including:
- AB Volvo
- Brunswick Corp.
- Caterpillar Inc.
- Cummins Inc.
- Daihatsu Diesel Mfg. Co. Ltd.
- Deere and Co.
- DEUTZ AG
- Hyundai Motor Co.
- Kubota Corp.
- Mitsubishi Heavy Industries Ltd.
- Porsche Automobil Holding SE
- Rolls Royce Holdings Plc
- Wartsila Corp.
- Yanmar Holdings Co. Ltd.
Qualitative and quantitative analysis of companies has been conducted to help clients understand the wider business environment as well as the strengths and weaknesses of key market players. Data is qualitatively analyzed to categorize companies as pure play, category-focused, industry-focused, and diversified; it is quantitatively analyzed to categorize companies as dominant, leading, strong, tentative, and weak.
Research Analyst Overview
The market plays a crucial role in the maritime commerce sector, catering to the power requirements of various types of vessels in the shipbuilding industry. These engines are essential for commercial shipping, including container shipping and less-than-container load, as well as tankers, which transport liquefied natural gas (LNG) and other fuels. The fuel mix for these engines has been shifting towards cleaner technologies and energy-efficient components in response to decarbonization efforts and increasing concerns over carbon emissions. Battery-powered ferries and ammonia-fueled boats are emerging alternatives to traditional diesel-powered vessels, while marine boilers continue to provide steam for power generation, heating, and other onboard functions.
Also, the market encompasses auxiliary equipment such as pumps, winches, and electrical systems for cargo ships, passenger ships, naval vessels, offshore platforms, and commercial and recreational boats. International trade and container transport rely heavily on the efficiency and reliability of these engines, with product tankers and cleaner technologies playing a significant role in reducing pollutants and improving fuel efficiency. The market is also witnessing the adoption of digital transformation, including remote monitoring systems, hybrid systems, and electric auxiliary engines, to optimize lifecycle management and bunkering infrastructure.
|
Market Scope |
|
|
Report Coverage |
Details |
|
Page number |
192 |
|
Base year |
2023 |
|
Historic period |
2018-2022 |
|
Forecast period |
2024-2028 |
|
Growth momentum & CAGR |
Accelerate at a CAGR of 5.3% |
|
Market Growth 2024-2028 |
USD 613.3 million |
|
Market structure |
Concentrated |
|
YoY growth 2023-2024(%) |
4.9 |
|
Key countries |
US, China, Japan, Germany, UK, India, South Korea, France, Canada, and Italy |
|
Competitive landscape |
Leading Companies, Market Positioning of Companies, Competitive Strategies, and Industry Risks |
What are the Key Data Covered in this Market Research and Growth Report?
- CAGR of the market during the market forecast period
- Detailed information on factors that will drive the market growth and forecasting between 2024 and 2028
- Precise estimation of the size of the market and its contribution of the market in focus to the parent market
- Accurate predictions about upcoming market growth and trends and changes in consumer behaviour
- Growth of the market across APAC, Europe, North America, South America, and Middle East and Africa
- Thorough analysis of the market's competitive landscape and detailed information about companies
- Comprehensive analysis of factors that will challenge the growth of market companies
We can help! Our analysts can customize this market research report to meet your requirements.
 RIA -
RIA - 
