Micro Combined Heat And Power (Micro-CHP) Market Analysis APAC, Europe, North America, South America, Middle East and Africa - China, Japan, US, Germany, UK - Size and Forecast 2024-2028

Micro Combined Heat And Power (Micro-CHP) Market Analysis APAC, Europe, North America, South America, Middle East and Africa - China, Japan, US, Germany, UK - Size and Forecast 2024-2028

Published: Jul 2024 171 Pages SKU: IRTNTR71981

Market Overview at a Glance

$5.35 B
Market Opportunity
18.69%
CAGR
16.01
YoY growth 2023-2024(%)

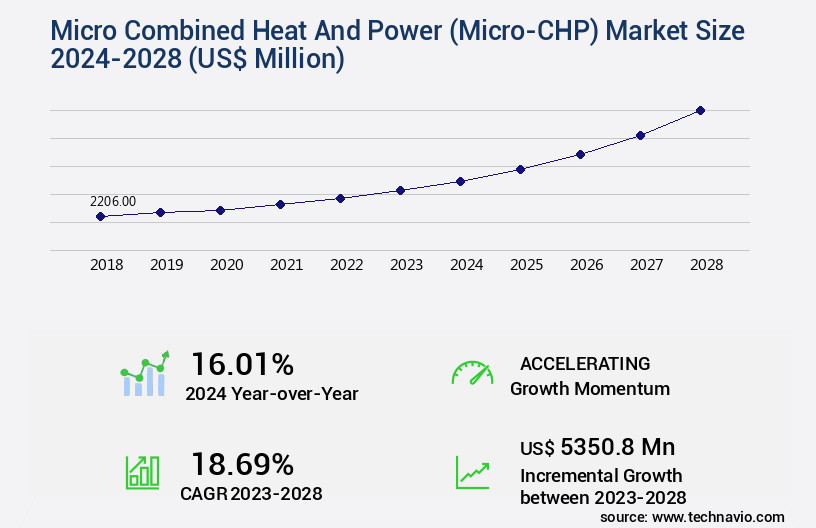
Micro Combined Heat And Power (Micro-CHP) Market Size 2024-2028

The micro combined heat and power (micro-CHP) market size is valued to increase USD 5.35 billion, at a CAGR of 18.69% from 2023 to 2028. Rise in global energy demand will drive the micro combined heat and power (micro-CHP) market.

Major Market Trends & Insights

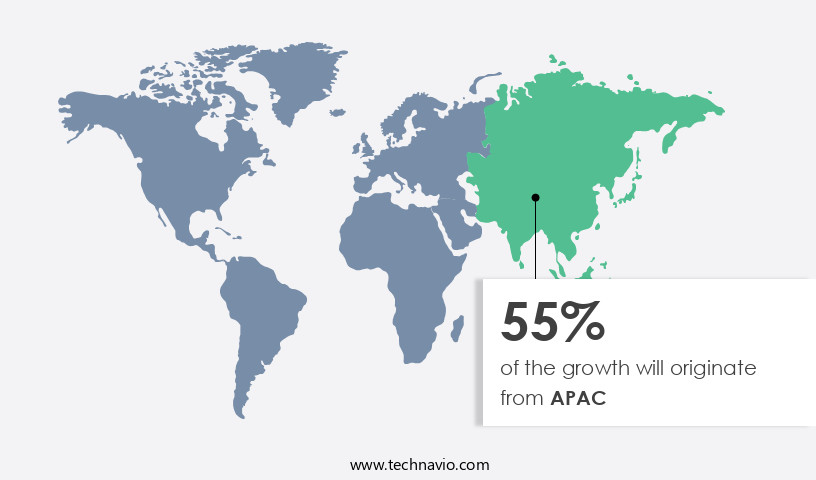
  • APAC dominated the market and accounted for a 55% growth during the forecast period.
  • By Application - Residential segment was valued at USD 1.68 billion in 2022
  • By Technology - Fuel cells segment accounted for the largest market revenue share in 2022

Market Size & Forecast

  • Market Opportunities: USD 321.51 million
  • Market Future Opportunities: USD 5350.80 million
  • CAGR : 18.69%
  • APAC: Largest market in 2022

Market Summary

  • The market represents a dynamic and evolving sector in the global energy landscape. This market encompasses core technologies such as fuel cells, internal combustion engines, and steam turbines, which convert heat and power from a single fuel source. Applications span various industries, including residential, commercial, and industrial sectors. The Micro-CHP Market is experiencing significant growth due to the rising global energy demand and technological developments. According to recent reports, the market is expected to account for over 10% of the global CHP market share by 2025. However, the high cost associated with micro-CHP units remains a major challenge, limiting widespread adoption.
  • Regulations, such as the European Union's Renewable Energy Directive, are driving the market forward by mandating the use of renewable energy sources. In the United States, the Energy Policy Act of 2005 provides incentives for the use of CHP systems. The market is continually unfolding, with ongoing advancements in efficiency, scalability, and affordability. For instance, advancements in fuel cell technology are making micro-CHP units more cost-effective and accessible to a broader consumer base. These trends underscore the potential for substantial growth and opportunities in the Micro-CHP Market.

What will be the Size of the Micro Combined Heat And Power (Micro-CHP) Market during the forecast period?

Micro Combined Heat And Power (Micro-CHP) Market Size

Get Key Insights on Market Forecast (PDF) Request Free Sample

How is the Micro Combined Heat And Power (Micro-CHP) Market Segmented and what are the key trends of market segmentation?

The micro combined heat and power (micro-CHP) industry research report provides comprehensive data (region-wise segment analysis), with forecasts and estimates in "USD million" for the period 2024-2028, as well as historical data from 2018-2022 for the following segments.

  • Application
    • Residential
    • Commercial
  • Technology
    • Fuel cells
    • Engines
  • Geography
    • North America
      • US
    • Europe
      • Germany
      • UK
    • APAC
      • China
      • Japan
    • Rest of World (ROW)

By Application Insights

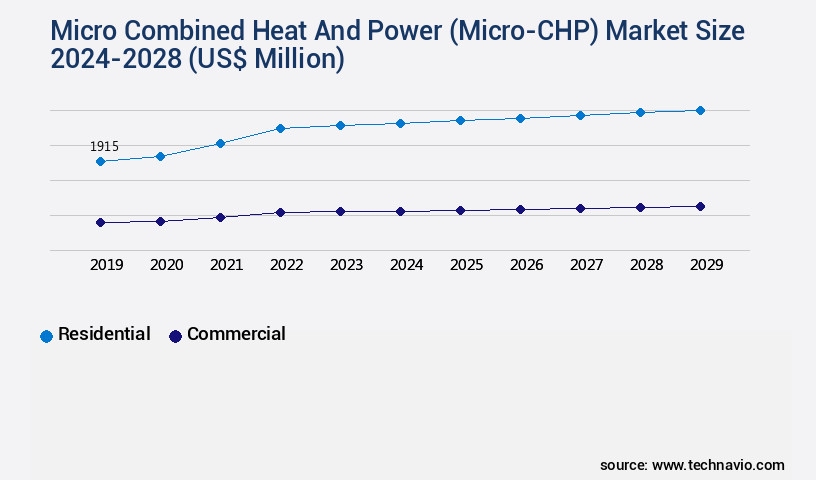
The residential segment is estimated to witness significant growth during the forecast period.

The market is experiencing significant growth as the global population and urbanization rates continue to increase. According to recent reports, the global population grew by approximately 1.69% in 2023 compared to 2021. This population expansion is driving the demand for new residential units, particularly in urban areas of Asia Pacific and North America. Micro-CHP systems, also known as cogeneration, are gaining popularity due to their ability to generate heat and electricity simultaneously at the residential scale. These systems can provide heat, hot water, and the majority of a home's energy requirements, replacing traditional gas central heating furnaces. The recovered heat can also be utilized for various applications, such as heating a pool, spa, or hot tub, and for space heating.

Micro-CHP technologies include combined cycle efficiency, stirling engine, fuel cell, gas turbine, internal combustion engine, and heat pump integration. Each technology offers unique advantages, such as high efficiency, low emissions, and fuel flexibility. For instance, stirling engine Micro-CHP systems are known for their quiet operation and long lifespan, while fuel cell systems provide high efficiency and low emissions. Operating costs, monitoring systems, and control system design are crucial factors influencing the adoption of Micro-CHP systems in residential and commercial applications. Energy management systems, emission reduction technologies, thermal output capacity, thermal energy storage, and waste heat utilization are essential components of these systems.

The market for Micro-CHP systems is expected to grow substantially in the coming years. For instance, the residential Micro-CHP market is projected to expand by around 25% in the next five years, while the commercial sector is anticipated to grow by approximately 30%. These growth figures reflect the increasing demand for energy efficiency, grid stability, and the integration of renewable energy sources. Micro-CHP systems offer numerous benefits, including improved energy efficiency, reduced greenhouse gas emissions, and increased system reliability. They also contribute to grid stability by providing distributed generation and enabling smart grid integration. Additionally, these systems can be integrated with energy storage solutions and remote diagnostics, making them suitable for off-grid applications.

In conclusion, the Micro-CHP market is experiencing robust growth due to the increasing demand for energy efficiency, grid stability, and the integration of renewable energy sources. The market is expected to continue evolving, with new technologies, applications, and business models emerging to meet the evolving energy needs of residential and commercial sectors.

Micro Combined Heat And Power (Micro-CHP) Market Size

Request Free Sample

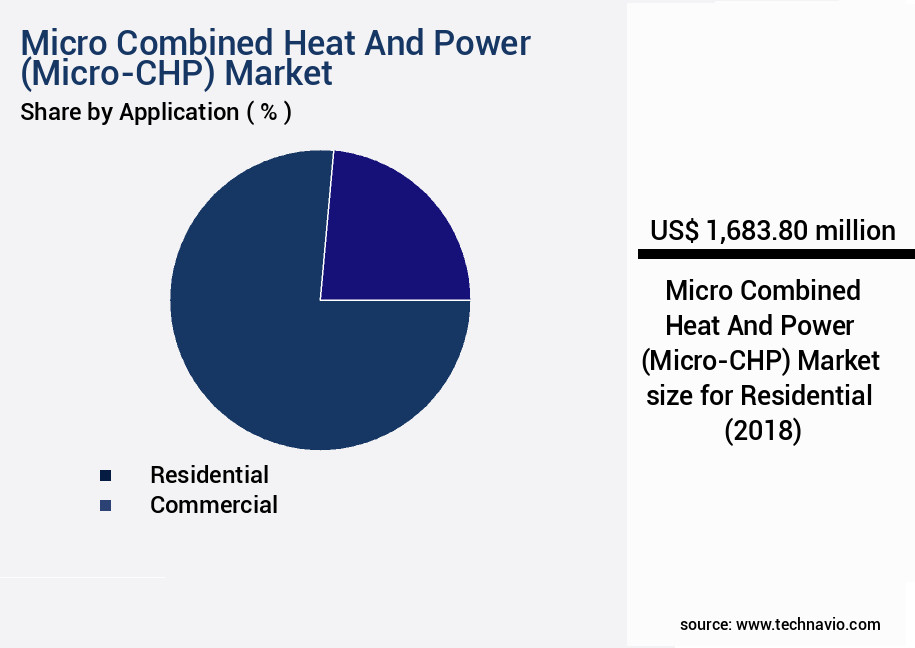
The Residential segment was valued at USD 1.68 billion in 2018 and showed a gradual increase during the forecast period.

Micro Combined Heat And Power (Micro-CHP) Market Size

Request Free Sample

Regional Analysis

APAC is estimated to contribute 55% to the growth of the global market during the forecast period.Technavio's analysts have elaborately explained the regional trends and drivers that shape the market during the forecast period.

Micro Combined Heat And Power (Micro-CHP) Market Share by Geography

See How Micro Combined Heat And Power (Micro-CHP) Market Demand is Rising in APAC Request Free Sample

In 2023, Japan and South Korea emerged as significant contributors to the market in the Asia-Pacific (APAC) region. APAC, which consumed approximately 78% of the world's total energy in 2023, according to the Statistical Review of World Energy, witnessed a resurgence in global energy demand. After a 1% decline in 2020, electricity demand returned to its pre-pandemic levels in 2021, surpassing the expansion of low-emissions generation sources like renewables. In Japan, electricity consumption increased from 905.55 TWh in 2022 to 909 TWh in 2023. Industries accounted for 36% of this consumption, followed by services (34%) and households (26%). The micro-CHP market in APAC is poised to capitalize on the region's growing energy demand and the push for cleaner energy sources.

Market Dynamics

Our researchers analyzed the data with 2023 as the base year, along with the key drivers, trends, and challenges. A holistic analysis of drivers will help companies refine their marketing strategies to gain a competitive advantage.

The market encompasses the design, manufacturing, installation, and maintenance of systems that generate electricity and heat concurrently for residential and commercial applications. Micro-CHP systems offer significant efficiency improvements compared to traditional power generation methods, making them an attractive option for reducing energy consumption and carbon footprint. Residential micro-CHP systems boast high efficiency levels, often exceeding 85%, due to their proximity to heat demand. Commercial installations, however, face higher upfront costs, with installation prices varying depending on fuel type and system size. Natural gas and biogas are common fuel choices, with the former offering lower emissions and the latter providing renewable energy benefits.

Optimization of heat recovery in micro-CHP systems is crucial for maximizing efficiency and overall performance. Design considerations for micro-CHP control systems include fuel type, system size, and integration with renewable energy sources. Advanced control strategies and fault diagnosis techniques help maintain optimal system operation and ensure reliable performance. Regulatory frameworks play a significant role in micro-CHP deployment, with incentives and subsidies driving market growth. Performance monitoring and lifecycle cost analysis are essential for assessing the economic benefits of micro-CHP systems. System reliability enhancement through thermal energy storage and safety and environmental impact considerations are also critical factors. Fuel cell technology applications in micro-CHP systems offer improved efficiency and reduced emissions, making them a promising development in the market.

Heat pump integration and energy management strategies further enhance the overall efficiency and sustainability of micro-CHP systems. Compared to standalone power generation, micro-CHP systems provide a more integrated and efficient energy solution, with approximately 80% of the energy input being converted into useful heat and electricity, as opposed to the 33-40% efficiency of traditional power plants. This indirect numerical comparison underscores the potential advantages of micro-CHP systems in the energy landscape.

Micro Combined Heat And Power (Micro-CHP) Market Size

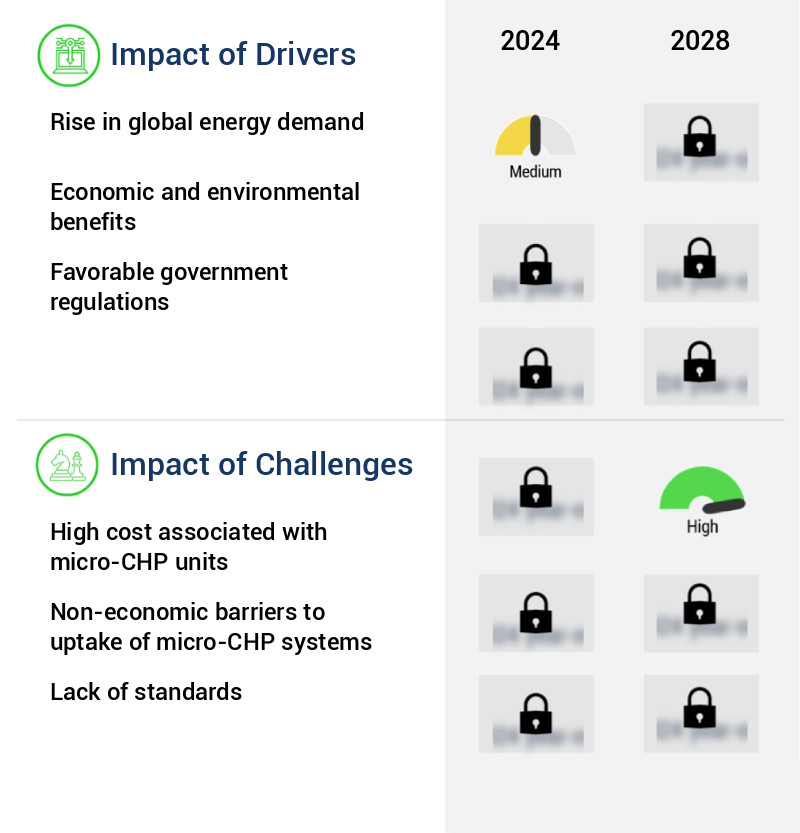
What are the key market drivers leading to the rise in the adoption of Micro Combined Heat And Power (Micro-CHP) Industry?

  • The escalating global energy demand serves as the primary market driver. 
  • According to the International Energy Agency (IEA), the global economy's average annual growth rate of 3.4% from 2017 led to a significant increase in energy demand. In 2017, energy demand grew by 2.1% compared to the previous year and is projected to expand by over 25% by 2040. China and India are expected to contribute more than 40% to this growth. The global electricity demand doubled between 1990 and 2016 and is anticipated to grow at a faster pace than overall energy demand in the coming decades.
  • From 2017, the electricity demand is projected to double again. This continuous growth in energy and electricity demand underscores the importance of efficient and sustainable energy solutions.

What are the market trends shaping the Micro Combined Heat And Power (Micro-CHP) Industry?

  • Technological developments are currently shaping market trends. A growing emphasis is placed on innovation and advancement within the industry.
  • Micro-Combined Heat and Power (micro-CHP) systems have gained significant attention due to their potential to provide both electricity and heat from a single fuel source, reducing energy waste and increasing efficiency. High costs have historically hindered widespread adoption, prompting companies to focus on technological advancements. For instance, MTT's recuperated microturbines, capable of generating up to 30 kW of electrical power for CHP and other applications, represent one such development.
  • Future cost-reduction initiatives are underway, balancing performance and efficiency. Advanced system designs are also being pursued, integrating microturbines with enhanced turbine, compressor, and recuperator efficiencies, as well as higher cycle pressure ratios, resulting in substantial electric efficiency improvements.

What challenges does the Micro Combined Heat And Power (Micro-CHP) Industry face during its growth?

  • The high cost of micro-Combined Heat and Power (micro-CHP) units poses a significant challenge to the industry's growth, as the financial burden impedes widespread adoption and implementation. 
  • Micro-CHP systems, which have gained popularity in various countries for their environmental advantages, face a significant barrier to wider adoption due to their high capital costs. For instance, the annual operating cost of a micro-CHP system like ENE-FARM, which employs Proton Exchange Membrane Fuel Cells (PEMFC), is approximately 116% more than that of traditional power generation methods. The high cost of fuel cells, a crucial component of CHP systems, is a major contributing factor. Despite their long history, dating back to the 1960s, fuel cells have only recently seen commercial and industrial application, primarily due to the declining price of natural gas in the US, the primary source of hydrogen for fuel cells, and ongoing research and development efforts.
  • However, despite these advancements, fuel cells and their associated fuels remain costlier than alternative technologies, such as engines.

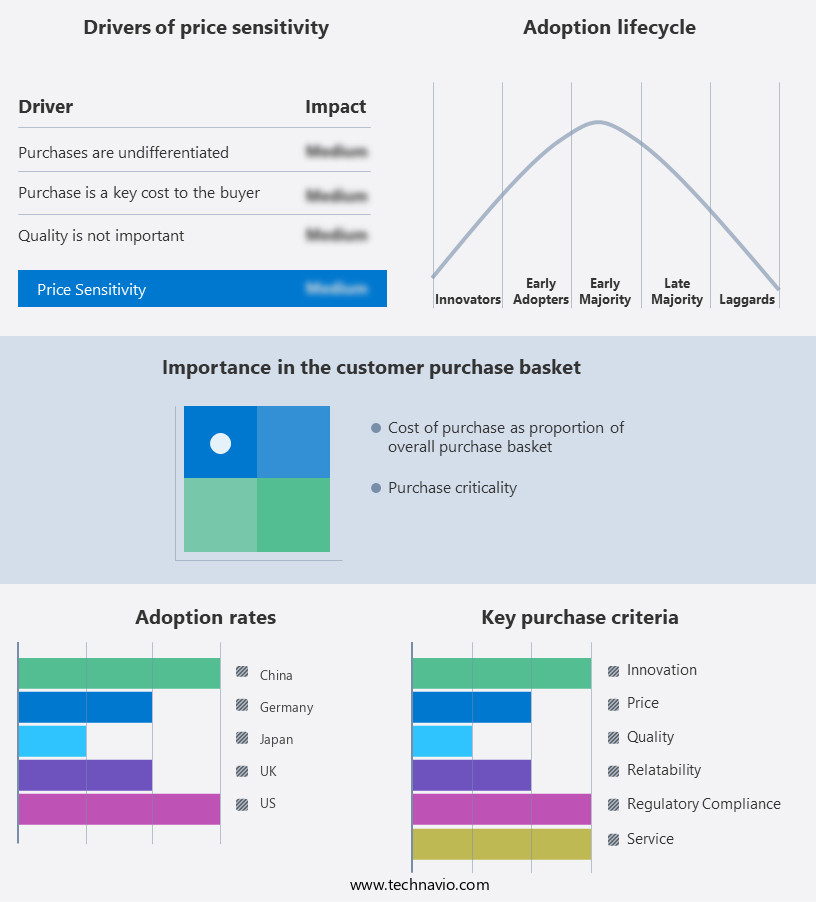
Exclusive Technavio Analysis on Customer Landscape

The micro combined heat and power (micro-chp) market forecasting report includes the adoption lifecycle of the market, covering from the innovator's stage to the laggard's stage. It focuses on adoption rates in different regions based on penetration. Furthermore, the micro combined heat and power (micro-chp) market report also includes key purchase criteria and drivers of price sensitivity to help companies evaluate and develop their market growth analysis strategies.

Micro Combined Heat And Power (Micro-CHP) Market Share by Geography

 Customer Landscape of Micro Combined Heat And Power (Micro-CHP) Industry

Competitive Landscape

Companies are implementing various strategies, such as strategic alliances, micro combined heat and power (micro-chp) market forecast, partnerships, mergers and acquisitions, geographical expansion, and product/service launches, to enhance their presence in the industry.

2G Energy AG - The company specializes in micro combined heat and power technology, providing innovative solutions through CHP systems. These systems efficiently generate electricity and heat concurrently, reducing energy waste and enhancing overall energy efficiency.

The industry research and growth report includes detailed analyses of the competitive landscape of the market and information about key companies, including:

  • 2G Energy AG
  • Axiom Energy Group LLC
  • BDR Thermea Group
  • Centrica Plc
  • Ceres Power Holdings plc
  • EC Power AS
  • General Electric Co.
  • GreenSpec
  • GreenWatt Canada
  • Mitsubishi Heavy Industries Ltd.
  • MTT bv
  • Robert Bosch GmbH
  • Samad Power Ltd.
  • Siemens AG
  • Tedom AS
  • Vaillant GmbH
  • Veolia Environnement SA
  • Viessmann Climate Solutions SE
  • Volkswagen AG
  • Yanmar Holdings Co. Ltd.

Qualitative and quantitative analysis of companies has been conducted to help clients understand the wider business environment as well as the strengths and weaknesses of key industry players. Data is qualitatively analyzed to categorize companies as pure play, category-focused, industry-focused, and diversified; it is quantitatively analyzed to categorize companies as dominant, leading, strong, tentative, and weak.

Recent Development and News in Micro Combined Heat And Power (Micro-CHP) Market

  • In January 2024, Siemens Energy and ENGIE announced a strategic partnership to accelerate the deployment of Micro-CHP systems in Europe. The collaboration aimed to combine Siemens Energy's technology expertise with ENGIE's market knowledge and customer base (Siemens Energy press release, 2024).
  • In March 2024, Bloom Energy, a leading fuel cell company, secured a USD100 million investment from SoftBank Vision Fund 2 to expand its Micro-CHP offerings and accelerate market penetration (Bloomberg, 2024).
  • In April 2025, the European Union passed the revised Renewable Energy Directive, which mandated a 14% share of renewable energy in the heating sector by 2030. This initiative is expected to significantly boost the Micro-CHP market, as the technology is an effective solution for generating heat and power from renewable sources (European Commission press release, 2025).
  • In May 2025, Mitsubishi Heavy Industries (MHI) and Panasonic Corporation announced the successful demonstration of a new Micro-CHP system that achieved an efficiency rate of 93%. This technological advancement positions MHI and Panasonic as key players in the Micro-CHP market, offering highly efficient solutions to customers (MHI press release, 2025).

Dive into Technavio's robust research methodology, blending expert interviews, extensive data synthesis, and validated models for unparalleled Micro Combined Heat And Power (Micro-CHP) Market insights. See full methodology.

Market Scope

Report Coverage

Details

Page number

171

Base year

2023

Historic period

2018-2022

Forecast period

2024-2028

Growth momentum & CAGR

Accelerate at a CAGR of 18.69%

Market growth 2024-2028

USD 5350.8 million

Market structure

Fragmented

YoY growth 2023-2024(%)

16.01

Key countries

China, Japan, US, Germany, and UK

Competitive landscape

Leading Companies, Market Positioning of Companies, Competitive Strategies, and Industry Risks

Request Free Sample

Research Analyst Overview

  • Micro-CHP markets encompass various technologies, including combined cycle efficiency solutions, Stirling engine, fuel cell, gas turbine, internal combustion engine, and heat pump integration systems. These systems offer significant benefits, such as peak load shaving and emission reduction, making them increasingly popular for both residential and commercial applications. Combined cycle efficiency solutions, which optimize the use of thermal energy, have gained traction due to their high efficiency levels. Stirling engine micro-CHP systems, known for their low emissions and quiet operation, are another popular choice. Fuel cell technology, with its high electrical efficiency and low emissions, is also a growing segment.
  • Operating costs and maintenance requirements vary among these technologies. Monitoring systems and energy management systems play crucial roles in optimizing performance and reducing costs. Heat pump integration, thermal energy storage, and waste heat utilization are essential components for enhancing system efficiency and reliability. Gas turbine micro-CHP and internal combustion engine systems are known for their high power output capacity. Heat recovery systems and thermal output capacity are essential considerations for these applications. In contrast, fuel flexibility and smart grid integration are key features for Stirling engine and fuel cell systems. The market dynamics of micro-CHP systems are continually evolving.
  • Capital costs and building energy demand are significant factors influencing market growth. Control system design, energy efficiency metrics, and energy storage solutions are essential for optimizing system performance. Micro-CHP systems are increasingly integrated with renewable energy sources, expanding their applications in off-grid and distributed generation scenarios. Grid stability and system reliability are crucial aspects of these systems, which are further enhanced by remote diagnostics and emission reduction technologies. In summary, micro-CHP markets represent a diverse range of technologies, each with unique advantages and challenges. Continuous advancements in these systems' design and integration with various energy sources and applications are driving their adoption and growth.

What are the Key Data Covered in this Micro Combined Heat And Power (Micro-CHP) Market Research and Growth Report?

  • What is the expected growth of the Micro Combined Heat And Power (Micro-CHP) Market between 2024 and 2028?

    • USD 5.35 billion, at a CAGR of 18.69%

  • What segmentation does the market report cover?

    • The report is segmented by Application (Residential and Commercial), Technology (Fuel cells and Engines), and Geography (APAC, Europe, North America, South America, and Middle East and Africa)

  • Which regions are analyzed in the report?

    • APAC, Europe, North America, South America, and Middle East and Africa

  • What are the key growth drivers and market challenges?

    • Rise in global energy demand, High cost associated with micro-CHP units

  • Who are the major players in the Micro Combined Heat And Power (Micro-CHP) Market?

    • 2G Energy AG, Axiom Energy Group LLC, BDR Thermea Group, Centrica Plc, Ceres Power Holdings plc, EC Power AS, General Electric Co., GreenSpec, GreenWatt Canada, Mitsubishi Heavy Industries Ltd., MTT bv, Robert Bosch GmbH, Samad Power Ltd., Siemens AG, Tedom AS, Vaillant GmbH, Veolia Environnement SA, Viessmann Climate Solutions SE, Volkswagen AG, and Yanmar Holdings Co. Ltd.

Market Research Insights

  • Micro Combined Heat and Power (micro-CHP) systems represent a significant advancement in energy efficiency and environmental sustainability. These systems generate electricity and heat concurrently, improving overall energy utilization and reducing carbon footprint. According to industry estimates, the global micro-CHP market is projected to reach a capacity of 30 GW by 2025, growing at a compound annual growth rate of 10%. Component life expectancy is a crucial factor in micro-CHP system performance. A well-designed engine can last up to 40,000 hours, while a high-efficiency heat exchanger can operate for over 20 years. For instance, a 1 MW micro-CHP system can generate 1 GWh of electricity and 1.5 GWh of thermal energy per year, reducing carbon dioxide emissions by approximately 3,000 metric tons.
  • Exhaust gas recirculation, engine performance, and fuel conversion efficiency are essential aspects of micro-CHP system design. Advanced control algorithms and user interface designs facilitate efficient system operation and regulatory compliance. Grid-tied micro-CHP systems enable energy harvesting and demand response, enhancing economic viability. System optimization, load balancing, and fault detection are integral to maintaining optimal performance and minimizing nitrogen oxide emissions. Sensor technology and data acquisition systems facilitate continuous monitoring and system integration.

We can help! Our analysts can customize this micro combined heat and power (micro-chp) market research report to meet your requirements.

Get in touch

1 Executive Summary

  • 1.1 Market overview
    • Executive Summary - Chart on Market Overview
    • Executive Summary - Data Table on Market Overview
    • Executive Summary - Chart on Global Market Characteristics
    • Executive Summary - Chart on Market by Geography
    • Executive Summary - Chart on Market Segmentation by Application
    • Executive Summary - Chart on Market Segmentation by Technology
    • Executive Summary - Chart on Incremental Growth
    • Executive Summary - Data Table on Incremental Growth
    • Executive Summary - Chart on Company Market Positioning

2 Market Landscape

  • 2.1 Market ecosystem
    • Parent Market
    • Data Table on - Parent Market
  • 2.2 Market characteristics
    • Market characteristics analysis
  • 2.3 Value chain analysis
    • Value Chain Analysis

3 Market Sizing

  • 3.1 Market definition
    • Offerings of companies included in the market definition
  • 3.2 Market segment analysis
    • Market segments
  • 3.3 Market size 2023
    • 3.4 Market outlook: Forecast for 2023-2028
      • Chart on Global - Market size and forecast 2023-2028 ($ million)
      • Data Table on Global - Market size and forecast 2023-2028 ($ million)
      • Chart on Global Market: Year-over-year growth 2023-2028 (%)
      • Data Table on Global Market: Year-over-year growth 2023-2028 (%)

    4 Historic Market Size

    • 4.1 Global Micro Combined Heat And Power (Micro-CHP) Market 2018 - 2022
      • Historic Market Size - Data Table on Global Micro Combined Heat And Power (Micro-CHP) Market 2018 - 2022 ($ million)
    • 4.2 Application segment analysis 2018 - 2022
      • Historic Market Size - Application Segment 2018 - 2022 ($ million)
    • 4.3 Technology segment analysis 2018 - 2022
      • Historic Market Size - Technology Segment 2018 - 2022 ($ million)
    • 4.4 Geography segment analysis 2018 - 2022
      • Historic Market Size - Geography Segment 2018 - 2022 ($ million)
    • 4.5 Country segment analysis 2018 - 2022
      • Historic Market Size - Country Segment 2018 - 2022 ($ million)

    5 Five Forces Analysis

    • 5.1 Five forces summary
      • Five forces analysis - Comparison between 2023 and 2028
    • 5.2 Bargaining power of buyers
      • Bargaining power of buyers - Impact of key factors 2023 and 2028
    • 5.3 Bargaining power of suppliers
      • Bargaining power of suppliers - Impact of key factors in 2023 and 2028
    • 5.4 Threat of new entrants
      • Threat of new entrants - Impact of key factors in 2023 and 2028
    • 5.5 Threat of substitutes
      • Threat of substitutes - Impact of key factors in 2023 and 2028
    • 5.6 Threat of rivalry
      • Threat of rivalry - Impact of key factors in 2023 and 2028
    • 5.7 Market condition
      • Chart on Market condition - Five forces 2023 and 2028

    6 Market Segmentation by Application

    • 6.1 Market segments
      • Chart on Application - Market share 2023-2028 (%)
      • Data Table on Application - Market share 2023-2028 (%)
    • 6.2 Comparison by Application
      • Chart on Comparison by Application
      • Data Table on Comparison by Application
    • 6.3 Residential - Market size and forecast 2023-2028
      • Chart on Residential - Market size and forecast 2023-2028 ($ million)
      • Data Table on Residential - Market size and forecast 2023-2028 ($ million)
      • Chart on Residential - Year-over-year growth 2023-2028 (%)
      • Data Table on Residential - Year-over-year growth 2023-2028 (%)
    • 6.4 Commercial - Market size and forecast 2023-2028
      • Chart on Commercial - Market size and forecast 2023-2028 ($ million)
      • Data Table on Commercial - Market size and forecast 2023-2028 ($ million)
      • Chart on Commercial - Year-over-year growth 2023-2028 (%)
      • Data Table on Commercial - Year-over-year growth 2023-2028 (%)
    • 6.5 Market opportunity by Application
      • Market opportunity by Application ($ million)
      • Data Table on Market opportunity by Application ($ million)

    7 Market Segmentation by Technology

    • 7.1 Market segments
      • Chart on Technology - Market share 2023-2028 (%)
      • Data Table on Technology - Market share 2023-2028 (%)
    • 7.2 Comparison by Technology
      • Chart on Comparison by Technology
      • Data Table on Comparison by Technology
    • 7.3 Fuel cells - Market size and forecast 2023-2028
      • Chart on Fuel cells - Market size and forecast 2023-2028 ($ million)
      • Data Table on Fuel cells - Market size and forecast 2023-2028 ($ million)
      • Chart on Fuel cells - Year-over-year growth 2023-2028 (%)
      • Data Table on Fuel cells - Year-over-year growth 2023-2028 (%)
    • 7.4 Engines - Market size and forecast 2023-2028
      • Chart on Engines - Market size and forecast 2023-2028 ($ million)
      • Data Table on Engines - Market size and forecast 2023-2028 ($ million)
      • Chart on Engines - Year-over-year growth 2023-2028 (%)
      • Data Table on Engines - Year-over-year growth 2023-2028 (%)
    • 7.5 Market opportunity by Technology
      • Market opportunity by Technology ($ million)
      • Data Table on Market opportunity by Technology ($ million)

    8 Customer Landscape

    • 8.1 Customer landscape overview
      • Analysis of price sensitivity, lifecycle, customer purchase basket, adoption rates, and purchase criteria

    9 Geographic Landscape

    • 9.1 Geographic segmentation
      • Chart on Market share by geography 2023-2028 (%)
      • Data Table on Market share by geography 2023-2028 (%)
    • 9.2 Geographic comparison
      • Chart on Geographic comparison
      • Data Table on Geographic comparison
    • 9.3 APAC - Market size and forecast 2023-2028
      • Chart on APAC - Market size and forecast 2023-2028 ($ million)
      • Data Table on APAC - Market size and forecast 2023-2028 ($ million)
      • Chart on APAC - Year-over-year growth 2023-2028 (%)
      • Data Table on APAC - Year-over-year growth 2023-2028 (%)
    • 9.4 Europe - Market size and forecast 2023-2028
      • Chart on Europe - Market size and forecast 2023-2028 ($ million)
      • Data Table on Europe - Market size and forecast 2023-2028 ($ million)
      • Chart on Europe - Year-over-year growth 2023-2028 (%)
      • Data Table on Europe - Year-over-year growth 2023-2028 (%)
    • 9.5 North America - Market size and forecast 2023-2028
      • Chart on North America - Market size and forecast 2023-2028 ($ million)
      • Data Table on North America - Market size and forecast 2023-2028 ($ million)
      • Chart on North America - Year-over-year growth 2023-2028 (%)
      • Data Table on North America - Year-over-year growth 2023-2028 (%)
    • 9.6 South America - Market size and forecast 2023-2028
      • Chart on South America - Market size and forecast 2023-2028 ($ million)
      • Data Table on South America - Market size and forecast 2023-2028 ($ million)
      • Chart on South America - Year-over-year growth 2023-2028 (%)
      • Data Table on South America - Year-over-year growth 2023-2028 (%)
    • 9.7 Middle East and Africa - Market size and forecast 2023-2028
      • Chart on Middle East and Africa - Market size and forecast 2023-2028 ($ million)
      • Data Table on Middle East and Africa - Market size and forecast 2023-2028 ($ million)
      • Chart on Middle East and Africa - Year-over-year growth 2023-2028 (%)
      • Data Table on Middle East and Africa - Year-over-year growth 2023-2028 (%)
    • 9.8 China - Market size and forecast 2023-2028
      • Chart on China - Market size and forecast 2023-2028 ($ million)
      • Data Table on China - Market size and forecast 2023-2028 ($ million)
      • Chart on China - Year-over-year growth 2023-2028 (%)
      • Data Table on China - Year-over-year growth 2023-2028 (%)
    • 9.9 Japan - Market size and forecast 2023-2028
      • Chart on Japan - Market size and forecast 2023-2028 ($ million)
      • Data Table on Japan - Market size and forecast 2023-2028 ($ million)
      • Chart on Japan - Year-over-year growth 2023-2028 (%)
      • Data Table on Japan - Year-over-year growth 2023-2028 (%)
    • 9.10 US - Market size and forecast 2023-2028
      • Chart on US - Market size and forecast 2023-2028 ($ million)
      • Data Table on US - Market size and forecast 2023-2028 ($ million)
      • Chart on US - Year-over-year growth 2023-2028 (%)
      • Data Table on US - Year-over-year growth 2023-2028 (%)
    • 9.11 Germany - Market size and forecast 2023-2028
      • Chart on Germany - Market size and forecast 2023-2028 ($ million)
      • Data Table on Germany - Market size and forecast 2023-2028 ($ million)
      • Chart on Germany - Year-over-year growth 2023-2028 (%)
      • Data Table on Germany - Year-over-year growth 2023-2028 (%)
    • 9.12 UK - Market size and forecast 2023-2028
      • Chart on UK - Market size and forecast 2023-2028 ($ million)
      • Data Table on UK - Market size and forecast 2023-2028 ($ million)
      • Chart on UK - Year-over-year growth 2023-2028 (%)
      • Data Table on UK - Year-over-year growth 2023-2028 (%)
    • 9.13 Market opportunity by geography
      • Market opportunity by geography ($ million)
      • Data Tables on Market opportunity by geography ($ million)

    10 Drivers, Challenges, and Opportunity/Restraints

    • 10.1 Market drivers
      • 10.2 Market challenges
        • 10.3 Impact of drivers and challenges
          • Impact of drivers and challenges in 2023 and 2028
        • 10.4 Market opportunities/restraints

          11 Competitive Landscape

          • 11.1 Overview
            • 11.2 Competitive Landscape
              • Overview on criticality of inputs and factors of differentiation
            • 11.3 Landscape disruption
              • Overview on factors of disruption
            • 11.4 Industry risks
              • Impact of key risks on business

            12 Competitive Analysis

            • 12.1 Companies profiled
              • Companies covered
            • 12.2 Market positioning of companies
              • Matrix on companies position and classification
            • 2G Energy AG
              • 2G Energy AG - Overview
              • 2G Energy AG - Product / Service
              • 2G Energy AG - Key offerings
            • 12.4 Axiom Energy Group LLC
              • Axiom Energy Group LLC - Overview
              • Axiom Energy Group LLC - Product / Service
              • Axiom Energy Group LLC - Key offerings
            • 12.5 Centrica Plc
              • Centrica Plc - Overview
              • Centrica Plc - Business segments
              • Centrica Plc - Key offerings
              • Centrica Plc - Segment focus
            • 12.6 Ceres Power Holdings plc
              • Ceres Power Holdings plc - Overview
              • Ceres Power Holdings plc - Business segments
              • Ceres Power Holdings plc - Key news
              • Ceres Power Holdings plc - Key offerings
              • Ceres Power Holdings plc - Segment focus
            • 12.7 General Electric Co.
              • General Electric Co. - Overview
              • General Electric Co. - Business segments
              • General Electric Co. - Key news
              • General Electric Co. - Key offerings
              • General Electric Co. - Segment focus
            • 12.8 GreenSpec
              • GreenSpec - Overview
              • GreenSpec - Product / Service
              • GreenSpec - Key offerings
            • 12.9 Mitsubishi Heavy Industries Ltd.
              • Mitsubishi Heavy Industries Ltd. - Overview
              • Mitsubishi Heavy Industries Ltd. - Business segments
              • Mitsubishi Heavy Industries Ltd. - Key news
              • Mitsubishi Heavy Industries Ltd. - Key offerings
              • Mitsubishi Heavy Industries Ltd. - Segment focus
            • 12.10 Robert Bosch GmbH
              • Robert Bosch GmbH - Overview
              • Robert Bosch GmbH - Product / Service
              • Robert Bosch GmbH - Key news
              • Robert Bosch GmbH - Key offerings
            • 12.11 Samad Power Ltd.
              • Samad Power Ltd. - Overview
              • Samad Power Ltd. - Product / Service
              • Samad Power Ltd. - Key offerings
            • 12.12 Siemens AG
              • Siemens AG - Overview
              • Siemens AG - Business segments
              • Siemens AG - Key news
              • Siemens AG - Key offerings
              • Siemens AG - Segment focus
            • 12.13 Vaillant GmbH
              • Vaillant GmbH - Overview
              • Vaillant GmbH - Product / Service
              • Vaillant GmbH - Key offerings
            • 12.14 Veolia Environnement SA
              • Veolia Environnement SA - Overview
              • Veolia Environnement SA - Business segments
              • Veolia Environnement SA - Key news
              • Veolia Environnement SA - Key offerings
              • Veolia Environnement SA - Segment focus
            • 12.15 Viessmann Climate Solutions SE
              • Viessmann Climate Solutions SE - Overview
              • Viessmann Climate Solutions SE - Product / Service
              • Viessmann Climate Solutions SE - Key offerings
            • 12.16 Volkswagen AG
              • Volkswagen AG - Overview
              • Volkswagen AG - Business segments
              • Volkswagen AG - Key news
              • Volkswagen AG - Key offerings
              • Volkswagen AG - Segment focus
            • 12.17 Yanmar Holdings Co. Ltd.
              • Yanmar Holdings Co. Ltd. - Overview
              • Yanmar Holdings Co. Ltd. - Product / Service
              • Yanmar Holdings Co. Ltd. - Key news
              • Yanmar Holdings Co. Ltd. - Key offerings

            13 Appendix

            • 13.1 Scope of the report
              • 13.2 Inclusions and exclusions checklist
                • Inclusions checklist
                • Exclusions checklist
              • 13.3 Currency conversion rates for US$
                • Currency conversion rates for US$
              • 13.4 Research methodology
                • Research methodology
              • 13.5 Data procurement
                • Information sources
              • 13.6 Data validation
                • Data validation
              • 13.7 Validation techniques employed for market sizing
                • Validation techniques employed for market sizing
              • 13.8 Data synthesis
                • Data synthesis
              • 13.9 360 degree market analysis
                • 360 degree market analysis
              • 13.10 List of abbreviations
                • List of abbreviations

              Research Methodology

              Technavio presents a detailed picture of the market by way of study, synthesis, and summation of data from multiple sources. The analysts have presented the various facets of the market with a particular focus on identifying the key industry influencers. The data thus presented is comprehensive, reliable, and the result of extensive research, both primary and secondary.

              INFORMATION SOURCES

              Primary sources

              • Manufacturers and suppliers
              • Channel partners
              • Industry experts
              • Strategic decision makers

              Secondary sources

              • Industry journals and periodicals
              • Government data
              • Financial reports of key industry players
              • Historical data
              • Press releases

              DATA ANALYSIS

              Data Synthesis

              • Collation of data
              • Estimation of key figures
              • Analysis of derived insights

              Data Validation

              • Triangulation with data models
              • Reference against proprietary databases
              • Corroboration with industry experts

              REPORT WRITING

              Qualitative

              • Market drivers
              • Market challenges
              • Market trends
              • Five forces analysis

              Quantitative

              • Market size and forecast
              • Market segmentation
              • Geographical insights
              • Competitive landscape

              Interested in this report?

              Get your sample now to see our research methodology and insights!

              Download Now

              Frequently Asked Questions

              Micro Combined Heat And Power (Micro-Chp) market growth will increase by $ 5350.8 mn during 2024-2028.

              The Micro Combined Heat And Power (Micro-Chp) market is expected to grow at a CAGR of 18.69% during 2024-2028.

              Micro Combined Heat And Power (Micro-Chp) market is segmented by Application( Residential, Commercial) Technology( Fuel cells, Engines, North America, MEA, South America)

              2G Energy AG, Axiom Energy Group LLC, BDR Thermea Group, Centrica Plc, Ceres Power Holdings plc, EC Power AS, General Electric Co., GreenSpec, GreenWatt Canada, Mitsubishi Heavy Industries Ltd., MTT bv, Robert Bosch GmbH, Samad Power Ltd., Siemens AG, Tedom AS, Vaillant GmbH, Veolia Environnement SA, Viessmann Climate Solutions SE, Volkswagen AG, Yanmar Holdings Co. Ltd. are a few of the key vendors in the Micro Combined Heat And Power (Micro-Chp) market.

              APAC will register the highest growth rate of 55% among the other regions. Therefore, the Micro Combined Heat And Power (Micro-Chp) market in APAC is expected to garner significant business opportunities for the vendors during the forecast period.

              China, Japan, US, Germany, UK

              • Rise in global energy demandAccording to the IEA is the driving factor this market.
              • as of 2017 is the driving factor this market.
              • the global economy grew at an average rate of 3.4% per year is the driving factor this market.
              • which is the driving factor this market.
              • in turn is the driving factor this market.
              • increased the energy demand. For instance is the driving factor this market.
              • the global energy demand increased by 2.1% in 2017 compared with 2016 and is further expected to rise by more than 25% by 2040. This growth in global energy demand will be propelled by China and India is the driving factor this market.
              • thereby contributing to more than 40% of this growth. Similarly is the driving factor this market.
              • the global demand for electricity grew twofold between 1990 and 2016 and had been outpacing the growth of other energy sources. Moreover is the driving factor this market.
              • over the next 25 years is the driving factor this market.
              • from 2017 is the driving factor this market.
              • the global electricity demand is expected to grow twice compared with the pace of global energy demand. As of 2018 is the driving factor this market.
              • in India is the driving factor this market.
              • the demand for electricity has been increasing at a rate of 5% per annum is the driving factor this market.
              • owing to the country's aim of achieving universal electricity access by 2025. On the other hand is the driving factor this market.
              • by the next two decades is the driving factor this market.
              • China is expected to add an entire power system equivalent to that of the US. Furthermore is the driving factor this market.
              • the global population is expected to grow by over nine billion by 2040. Also is the driving factor this market.
              • according to the IEA is the driving factor this market.
              • electricity consumption in Japan increased from 828.76 TWh in 1990 to 986.95 TWh in 2020 is the driving factor this market.
              • which was an increase of 18.92%. Moreover is the driving factor this market.
              • after the lockdown was removed in April 2020 is the driving factor this market.
              • Japan's electricity production started to rise and increased by 6.58% between April 2020 and June 2021. Similarly is the driving factor this market.
              • according to Eurostat is the driving factor this market.
              • in 2021 is the driving factor this market.
              • household electricity consumption grew in the majority of the EU member states. Hence is the driving factor this market.
              • the demand for electric power is expected to grow significantly during the forecast period. Factors such as the electrification of heating and transport is the driving factor this market.
              • the rise in the number of connected devices in the residential and commercial sectors is the driving factor this market.
              • and the digitalization of modern economies have been propelling the electrification of the global energy system. Also is the driving factor this market.
              • the demand for energy services such as air conditioning is expected to rise in households in tandem with the growth in income levels. On the other hand is the driving factor this market.
              • the use of electric motor systems in industries has been driving the growth of energy demand in the industrial sector. According to the IEA is the driving factor this market.
              • in 2020 is the driving factor this market.
              • heat was the largest end-use of energy and accounted for about 50% of total energy consumption. Furthermore is the driving factor this market.
              • 46% of the heat was used for space and water heating and cooking in the building sector. Micro-CHP technology has proven to be effective for these purposes. Hence is the driving factor this market.
              • the rapid growth in the world energy demand from the residential as well as commercial sectors is expected to drive the global micro-CHP market during the forecast period. is the driving factor this market.

              The Micro Combined Heat And Power (Micro-Chp) market vendors should focus on grabbing business opportunities from the Residential segment as it accounted for the largest market share in the base year.