
Mobile Fronthaul Market Size 2025-2029
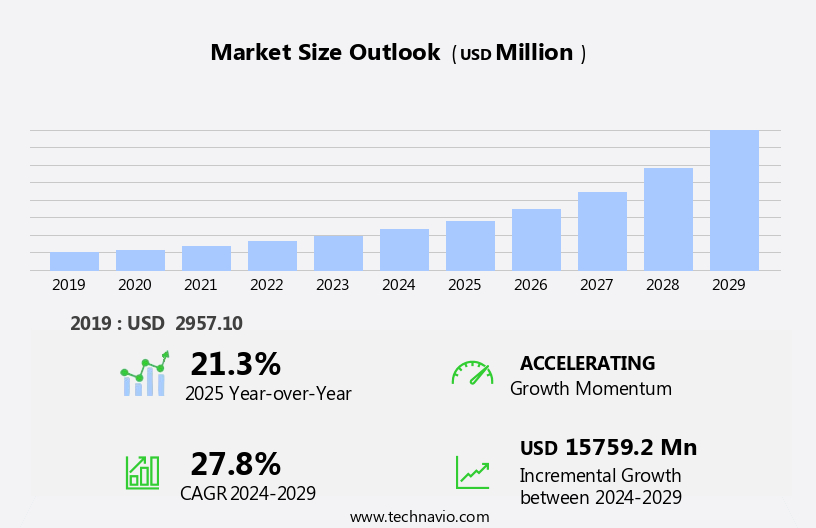
The mobile fronthaul market size is forecast to increase by USD 15.76 billion, at a CAGR of 27.8% between 2024 and 2029.
- The market is experiencing significant growth, driven primarily by the increasing adoption of mobile computing devices and the rise in demand for 5G network technologies. The proliferation of mobile devices, particularly smartphones and tablets, is fueling the need for advanced fronthaul solutions to support the high-bandwidth requirements of these devices. Moreover, the rollout of 5G networks is expected to further accelerate market growth, as the technology demands more robust and efficient fronthaul infrastructure to deliver its promised speeds and low latency. However, the market faces challenges as well. Interference in cell sites poses a significant obstacle to the deployment and optimization of fronthaul networks.
- This issue, which can stem from various sources, including other wireless networks, physical obstructions, and electromagnetic interference, can degrade network performance and impact the reliability and quality of mobile services. To mitigate this challenge, market participants must invest in advanced interference mitigation technologies and implement rigorous site planning and optimization strategies. By addressing these challenges and capitalizing on the opportunities presented by the growing demand for mobile computing and 5G networks, companies can effectively navigate the market's dynamic landscape and position themselves for success. Network security, including data encryption, is a priority in the competitive landscape.
What will be the Size of the Mobile Fronthaul Market during the forecast period?
- The market is experiencing significant activity and trends as capacity planning and network design become crucial for delivering high-quality services. Industry standards for network planning and management, such as quality of service and service assurance, are essential in optimizing network performance. Massive MIMO and wireless backhaul are disruptive technologies driving network architecture evolution, requiring bandwidth management and latency reduction.
- Regulatory frameworks play a role in wireless backhaul optimization, while fault management ensures network reliability. Base stations and radio access networks leverage optical fiber for enhanced capacity and network architecture flexibility. Network optimization and performance monitoring are ongoing priorities for businesses to gain a competitive advantage.
How is this Mobile Fronthaul Industry segmented?
The mobile fronthaul industry research report provides comprehensive data (region-wise segment analysis), with forecasts and estimates in "USD million" for the period 2025-2029, as well as historical data from 2019-2023 for the following segments.
- End-user
- Telecommunications
- Networking
- Government
- Enterprises
- Type
- Cloud RAN
- Centralized RAN
- Technology
- Optical fiber
- Wireless fronthaul
- Hybrid solutions
- Geography
- North America
- US
- Canada
- Europe
- France
- Germany
- Italy
- UK
- APAC
- China
- India
- Japan
- South America
- Brazil
- Rest of World (ROW)
- North America
By End-user Insights
The telecommunications segment is estimated to witness significant growth during the forecast period. Mobile fronthaul plays a crucial role in modern wireless communications networks, encompassing 4G, 5G, and IoT applications. By employing fiber optic cables, fronthaul ensures reliable network integration through low latency connections and high-speed data transmission. This infrastructure refers to the fiber links connecting Remote Radio Units (RRUs) or Heads (RRHs) and Baseband Units (BBUs), enabling network operators to introduce new services, minimize capital expenditures (CAPEX), and deliver consistent quality of service (QoS) throughout the network's lifecycle. Fronthaul's significance extends to various industries, including industrial automation, enterprise customers, and smart cities. Mobile edge computing, an essential component of 5G networks, benefits from fronthaul's capabilities in processing data closer to the source, enhancing energy efficiency and reducing the need for extensive backhaul.
Additionally, fronthaul's integration with optical transport networks and network function virtualization streamlines network deployment and management. Industry collaboration and network slicing further augment the potential of fronthaul. For instance, distributed antenna systems and small cells can be optimally deployed and managed, while connected cars and streaming services can benefit from the enhanced network performance. Infrastructure providers and mobile operators can leverage fronthaul's capabilities to deliver superior services, adhering to open standards and ensuring seamless interoperability.
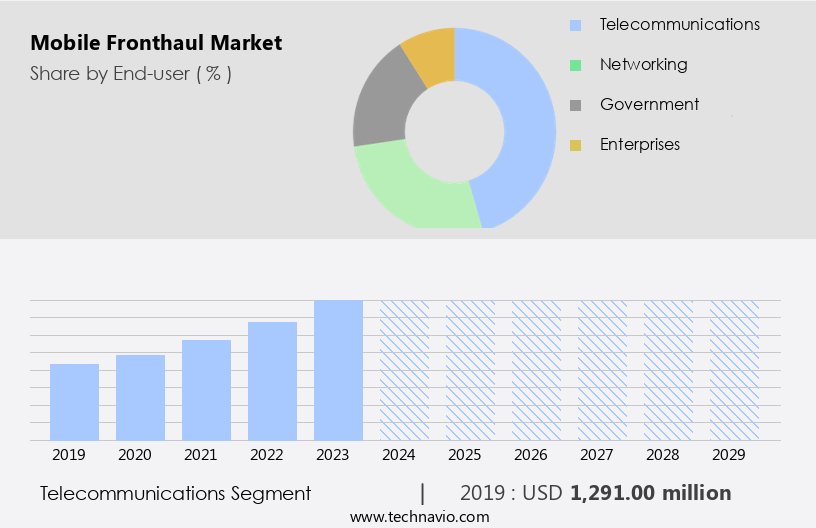
The Telecommunications segment was valued at USD 1.29 billion in 2019 and showed a gradual increase during the forecast period.
Regional Analysis
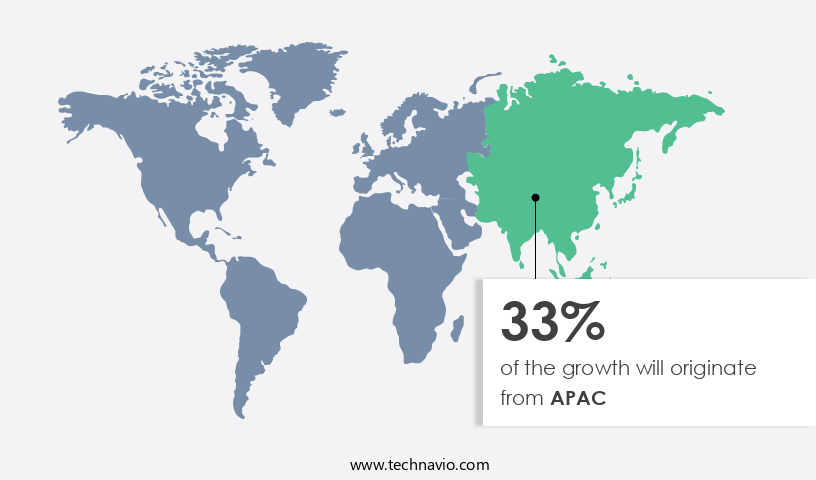
APAC is estimated to contribute 33% to the growth of the global market during the forecast period. Technavio's analysts have elaborately explained the regional trends and drivers that shape the market during the forecast period.
In Europe, major telecom operators such as Deutsche Telekom, Orange, Vodafone, Telefonica, and TIM are expanding their communication network infrastructure to cater to larger customer bases. The push towards smart city initiatives by European government authorities is driving the deployment of 4G/5G networks. For instance, the EU aims to replace around 80% of energy meters with smart meters by 2028, necessitating robust and efficient communication networks. Telecom operators are also investing in edge computing, mobile edge computing, and optical transport networks to optimize costs and enhance energy efficiency. Network equipment manufacturers are collaborating with industry players to develop open standards for network function virtualization, software-defined networking, and data center interconnection.
The integration of industrial automation, small cells, and the Internet of Things (IoT) is transforming the communication network landscape. Network slicing and deployment models are enabling mobile operators to offer customized services to enterprise customers. Connected cars and distributed antenna systems are further expanding the scope of mobile communication networks. Packet fronthaul and fiber optic cables are crucial components of the communication network infrastructure, ensuring seamless data transfer and low latency. Mobile operators are also exploring the potential of 5G networks for streaming services and content delivery, enhancing the overall user experience. The European communication network market is witnessing significant growth and innovation, driven by the deployment of 4G/5G networks, cost optimization, energy efficiency, and the integration of various technologies such as edge computing, industrial automation, and IoT.
Market Dynamics
Our researchers analyzed the data with 2024 as the base year, along with the key drivers, trends, and challenges. A holistic analysis of drivers will help companies refine their marketing strategies to gain a competitive advantage.
What are the Mobile Fronthaul market drivers leading to the rise in the adoption of Industry?
- The expansion of mobile computing devices serves as the primary catalyst for market growth. The global mobile communications market has experienced significant growth since the introduction of the first smartphone in 2000. With the rapid evolution of smartphones, which now offer functionalities akin to computers and cameras, the demand for high-bandwidth connectivity has intensified. The shift from 2G and 3G to 4G technology has been instrumental in enabling faster Internet speeds, meeting the increasing requirements of advanced mobile applications. Moreover, the integration of advanced technologies such as haptics, gesture recognition, facial recognition, heart rate monitoring, GPS tracking, and voice recognition in mobile devices has further fueled the need for high-speed telecommunication standards.
- To address this demand, distributed antenna systems (DAS) and edge computing are gaining popularity. These technologies enable the deployment of fiber optic cable infrastructure closer to the end-user, reducing latency and improving overall network performance. Fronthaul interfaces, which facilitate the connection between the base station and the network core, are a crucial component of these advanced telecommunication systems. Software-defined networking (SDN) and open standards are being adopted to optimize network efficiency and enable seamless integration of various technologies.
What are the Mobile Fronthaul market trends shaping the Industry?
- The demand for 5G network technologies is on the rise, representing a significant market trend. This increasing demand reflects the advancement and adoption of next-generation communication technologies. The market is experiencing significant growth as telecom companies worldwide invest in 5G services to enhance their network capabilities. The shift to 5G technology, which offers high bandwidth and low latency, necessitates advanced network infrastructure, particularly in the form of Centralized Radio Access Network (C-RAN) investments. This trend is driven by the need to cater to the increasing demands of massive connectivity and efficient spectrum usage in various sectors, such as smart cities and streaming services.
- The recent research indicates that the market for mobile fronthaul solutions is poised for substantial expansion as service providers prioritize 5G network deployment and optimize their network resources for optimal performance. The 5G network's immense capacity requirements necessitate addressing concerns over total cost of ownership (TCO) and network resource utilization.
How does Mobile Fronthaul market face challenges during its growth?
- Interference in cell sites poses a significant challenge to the industry's growth, as this issue can hinder network performance and reliability, potentially leading to customer dissatisfaction and revenue loss. Mobile fronthaul, the interface between the radio access network (RAN) and the core network, plays a crucial role in delivering high-quality mobile services. However, challenges persist in maintaining interference-free mobile networks. Internal interference, caused by the improper conductivity of passive devices like cables, connectors, or antennae, can produce intermodulation signals at the same frequency band as mobile transmitters. Additionally, frequency refarming, a cost-effective method for increasing capacity for Long-Term Evolution (LTE) and Universal Mobile Telecommunications Systems (UMTS), can also lead to interference. As mobile technology advances to LTE, operators utilize frequency refarming to deliver high data rates for mobile devices while preserving the spectra of older technologies such as the global system for mobile communication (GSM) and wideband code division multiple access (WCMDA).
- Industry collaboration is essential to address these challenges. Mobile edge computing, remote monitoring, industrial automation, video conferencing, and optical transport networks are key areas where innovation is required to enhance mobile fronthaul capabilities and ensure optimal network performance. Furthermore, mobile edge computing can enable applications such as augmented reality and virtual reality, which have immense potential in enterprise customer segments. The market is dynamic, with ongoing research and development efforts to address interference issues and improve network performance. Key areas of focus include mobile edge computing, remote monitoring, industrial automation, video conferencing, and optical transport networks.
Exclusive Customer Landscape
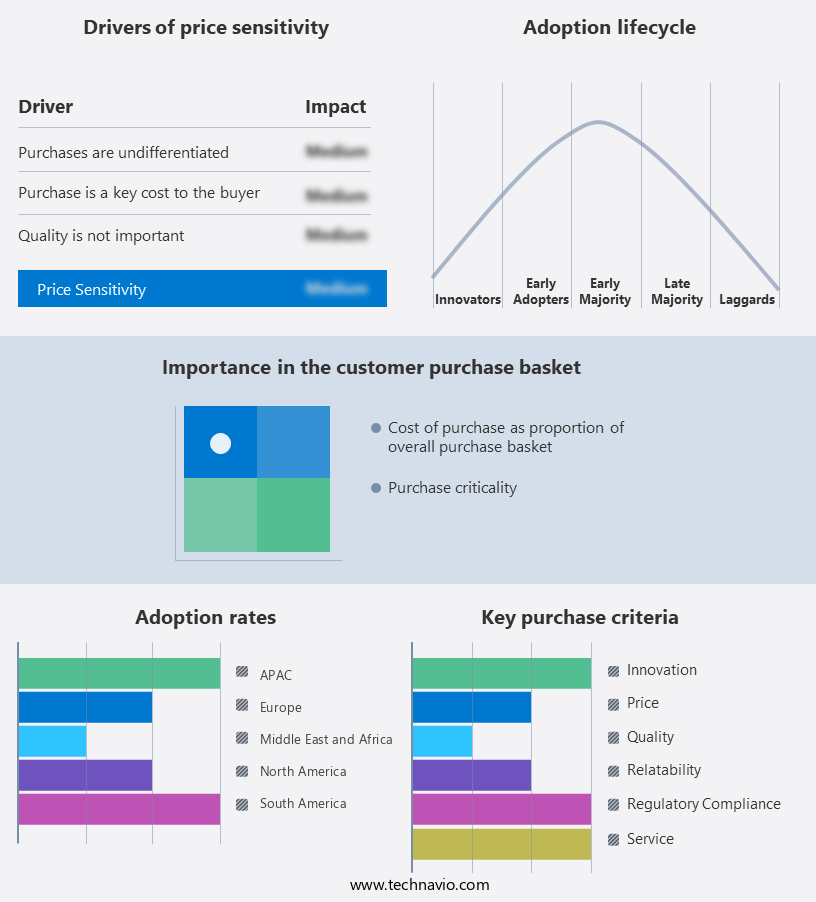
The mobile fronthaul market forecasting report includes the adoption lifecycle of the market, covering from the innovator's stage to the laggard's stage. It focuses on adoption rates in different regions based on penetration. Furthermore, the mobile fronthaul market report also includes key purchase criteria and drivers of price sensitivity to help companies evaluate and develop their market growth analysis strategies.
Customer Landscape
Key Companies & Market Insights
Companies are implementing various strategies, such as strategic alliances, mobile fronthaul market forecast, partnerships, mergers and acquisitions, geographical expansion, and product/service launches, to enhance their presence in the industry.
Broadcom Inc. - The company specializes in advanced mobile fronthaul solutions, delivering high-performance Ethernet switches such as StrataXGS and Tomahawk series.
The industry research and growth report includes detailed analyses of the competitive landscape of the market and information about key companies, including:
- Broadcom Inc.
- Ciena Corp.
- Cisco Systems Inc.
- FiberHome
- Fujitsu Ltd.
- HCL Technologies Ltd.
- Huawei Technologies Co. Ltd.
- Infinera Corp.
- MACOM Technology Solutions Inc.
- Microchip Technology Inc.
- NEC Corp.
- Nokia Corp.
- OE Solutions
- Omnitron Systems Technology Inc.
- Telefonaktiebolaget LM Ericsson
- Viavi Solutions Inc.
- ZTE Corp.
Qualitative and quantitative analysis of companies has been conducted to help clients understand the wider business environment as well as the strengths and weaknesses of key industry players. Data is qualitatively analyzed to categorize companies as pure play, category-focused, industry-focused, and diversified; it is quantitatively analyzed to categorize companies as dominant, leading, strong, tentative, and weak.
Recent Development and News in Mobile Fronthaul Market
- In February 2023, Ericsson and Nokia, two leading telecommunications equipment manufacturers, announced significant advancements in their mobile fronthaul solutions. Ericsson unveiled its new RAN Intelligent Controller (RIC), which enhances network efficiency and enables advanced services like Massive MIMO and 5G standalone (SA) networks (Ericsson Press Release, 2023). Nokia, on the other hand, showcased its ReefShark chipset, designed to reduce power consumption and increase capacity in mobile fronthaul networks (Nokia Press Release, 2023).
- In July 2024, Intel and Facebook collaborated to develop an open-source mobile fronthaul solution, aiming to accelerate the deployment of 5G networks and reduce costs (Intel Newsroom, 2024). This partnership represents a significant strategic move, as it combines Intel's expertise in silicon manufacturing with Facebook's network infrastructure experience.
Research Analyst Overview
The market continues to evolve, driven by the increasing demand for high-bandwidth, low-latency applications across various sectors. Network Function Virtualization (NFV) and Data Center Interconnection (DCI) are key technologies shaping the market, enabling the deployment of packet fronthaul architectures and the integration of edge computing. 5G networks and smart cities are major applications, requiring advanced connectivity solutions for IoT devices, streaming services, and content delivery. Service providers and infrastructure providers collaborate to optimize costs and improve energy efficiency, driving the adoption of microwave backhaul and optical transport networks. Mobile edge computing, remote monitoring, and industrial automation are other areas benefiting from the ongoing advancements in the market.
The market dynamics are continuously unfolding, with the emergence of new deployment models and network slicing, as well as the integration of distributed antenna systems and fiber optic cables. The mobile operator landscape is evolving, with network equipment manufacturers and software defined networking (SDN) solutions playing crucial roles. Open standards and infrastructure providers are essential for ensuring seamless integration across the various applications and technologies. In this dynamic market, the ongoing deployment and optimization of fronthaul interfaces, such as those for small cells and connected cars, are essential for meeting the evolving demands of enterprise customers and industry collaboration. The market continues to be a vital component of the digital transformation, enabling the delivery of advanced services and applications.
The Mobile Fronthaul Market is expanding rapidly, driven by increasing demand for small cell deployments to enhance network coverage. A key factor is the adoption of the distributed antenna system, enabling efficient signal transmission. The fronthaul interface plays a crucial role in linking remote radio units with baseband processing. Advancements in the optical transport network ensure high-speed data transfer, crucial for emerging applications like the connected car, which relies on seamless connectivity. Key players, including service providers, network equipment manufacturers, and infrastructure providers, are investing in innovative solutions to optimize mobile networks.
Dive into Technavio's strong research methodology, blending expert interviews, extensive data synthesis, and validated models for unparalleled Mobile Fronthaul Market insights. See full methodology.
|
Market Scope |
|
|
Report Coverage |
Details |
|
Page number |
225 |
|
Base year |
2024 |
|
Historic period |
2019-2023 |
|
Forecast period |
2025-2029 |
|
Growth momentum & CAGR |
Accelerate at a CAGR of 27.8% |
|
Market growth 2025-2029 |
USD 15.76 billion |
|
Market structure |
Fragmented |
|
YoY growth 2024-2025(%) |
21.3 |
|
Key countries |
US, Germany, UK, Canada, China, France, Italy, Brazil, Japan, and India |
|
Competitive landscape |
Leading Companies, Market Positioning of Companies, Competitive Strategies, and Industry Risks |
What are the Key Data Covered in this Mobile Fronthaul Market Research and Growth Report?
- CAGR of the Mobile Fronthaul industry during the forecast period
- Detailed information on factors that will drive the growth and forecasting between 2025 and 2029
- Precise estimation of the size of the market and its contribution of the industry in focus to the parent market
- Accurate predictions about upcoming growth and trends and changes in consumer behaviour
- Growth of the market across Europe, North America, APAC, South America, and Middle East and Africa
- Thorough analysis of the market's competitive landscape and detailed information about companies
- Comprehensive analysis of factors that will challenge the mobile fronthaul market growth of industry companies
We can help! Our analysts can customize this mobile fronthaul market research report to meet your requirements.
 RIA -
RIA - 
