
Moringa Products Market Size 2024-2028
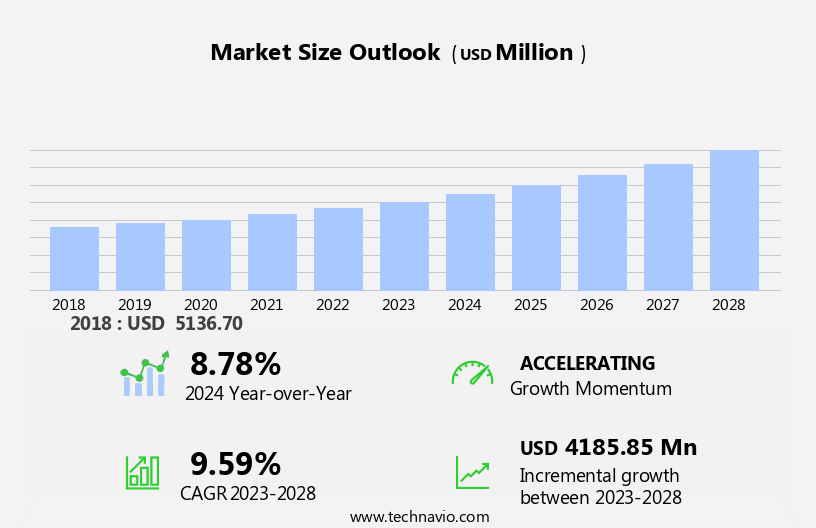
The moringa products market size is forecast to increase by USD 4.19 billion at a CAGR of 9.59% between 2023 and 2028.
- The market is experiencing significant growth due to the increasing recognition of moringa, particularly Moringa oleifera, for its medicinal uses and nutritional value. This trend is driving demand for moringa-based dietary supplements, wellness drinks, and beauty products. Private-label brands are gaining prominence in this market as consumers seek out trusted sources for these products. Additionally, the growing popularity of other superfood-based offerings is contributing to the market's expansion. Moringa seeds, rich in vitamins, minerals, and antioxidants, are a key component of these products, making them an attractive option for health-conscious consumers. This market analysis report provides a comprehensive overview of the growth factors and trends shaping the market.
What will be the Size of the Moringa Products Market During the Forecast Period?
- The market is witnessing significant growth, driven by the increasing popularity of natural and organic health food items. Moringa, derived from the Moringa oleifera tree, is a rich source of essential nutrients, antioxidants, and anti-inflammatory compounds. This has led to the expansion of moringa offerings in various product categories, including dietary supplements, herbal remedies, and functional foods. Private-label brands have been actively investing in moringa products, capitalizing on the consumer demand for natural and sustainable alternatives. These brands are securing shelf space allocation in health food stores, organic outlets, and supermarkets, ensuring a steady supply for the growing consumer base.
- Product innovation is a key factor fueling the market. Moringa oil, moringa powder, and moringa seeds are the primary forms of moringa used in various applications. Moringa oil is increasingly being used in cosmetics and skincare products due to its moisturizing and antioxidant properties. Moringa powder, on the other hand, is popular as a dietary supplement and an ingredient in herbal teas and wellness drinks. The food segment, including beverages and snacks, is another significant area of growth for moringa products. Moringa is used as a flavoring agent and a source of essential nutrients in various food and beverage products.
- Moringa tea, moringa smoothies, and moringa snacks are gaining popularity among health-conscious consumers. Moringa's medicinal uses have been known for centuries, and its role in traditional remedies continues to influence its modern applications. Moringa is used to support immune system health, improve digestion, and promote overall wellness. As a result, moringa dietary supplements and herbal remedies are in high demand. The market is expected to continue its growth trajectory, driven by increasing consumer awareness and preference for natural and organic health products. The market is also benefiting from the shift towards sustainable agriculture and the rising demand for herbal and natural alternatives to synthetic medicines and cosmetics.
- Thus, the market is witnessing growth, fueled by consumer demand for natural and organic health food items and the increasing popularity of moringa's numerous health benefits. Private-label brands, product innovation, and the expanding food segment are key growth drivers in this market. Moringa's versatility and wide range of applications in various industries, including food, cosmetics, and healthcare, make it a promising area for future growth.
How is this Moringa Products Industry segmented and which is the largest segment?
The moringa products industry research report provides comprehensive data (region-wise segment analysis), with forecasts and estimates in "USD billion" for the period 2024-2028, as well as historical data from 2018-2022 for the following segments.
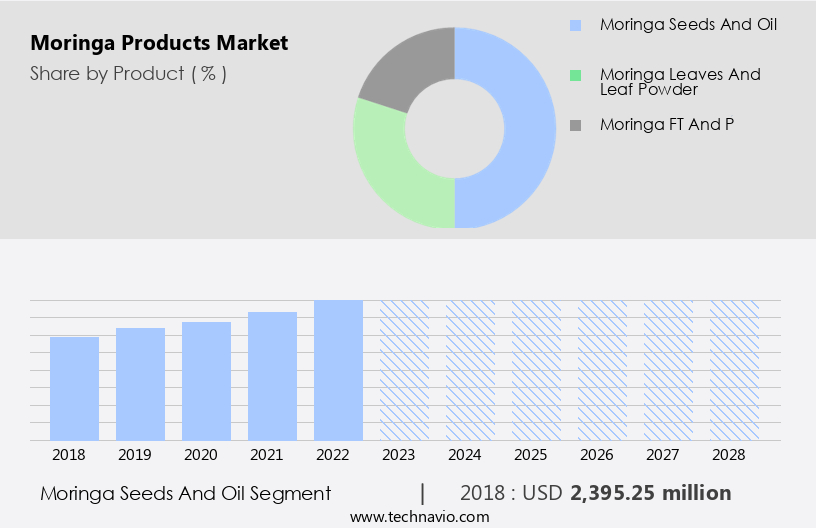
- Product
- Moringa seeds and oil
- Moringa leaves and leaf powder
- Moringa FT and P
- Distribution Channel
- Offline
- Online
- Geography
- APAC
- China
- India
- Europe
- Germany
- UK
- North America
- US
- Middle East and Africa
- South America
- APAC
By Product Insights
The moringa seeds and oil segment is estimated to witness significant growth during the forecast period.In 2023, India leads the global moringa seeds and oil market as the largest producer. China is the primary importer of moringa seeds, while the United States is the top importer of moringa oil. Moringa seeds are widely used In the food industry for consumption In their raw form and as ingredients in various food products. They can also be steamed, boiled, or roasted for various purposes. Moringa oil, a rapidly growing product In the moringa market, is gaining popularity worldwide due to its numerous health benefits. This oil is derived from the seeds and is used extensively In the cosmetics and food industries.
Organized retailing and online sales channels have facilitated the easy availability of moringa products to health-conscious consumers In the US. Herbal extracts and Ayurvedic medicine, which include moringa, are increasingly sought after for their therapeutic properties. Moringa leaf oil and leaf tea are popular forms of consumption, contributing significantly to the market growth.
Get a glance at the market report of share of various segments Request Free Sample
The moringa seeds and oil segment was valued at USD 2.4 billion in 2018 and showed a gradual increase during the forecast period.
Regional Analysis
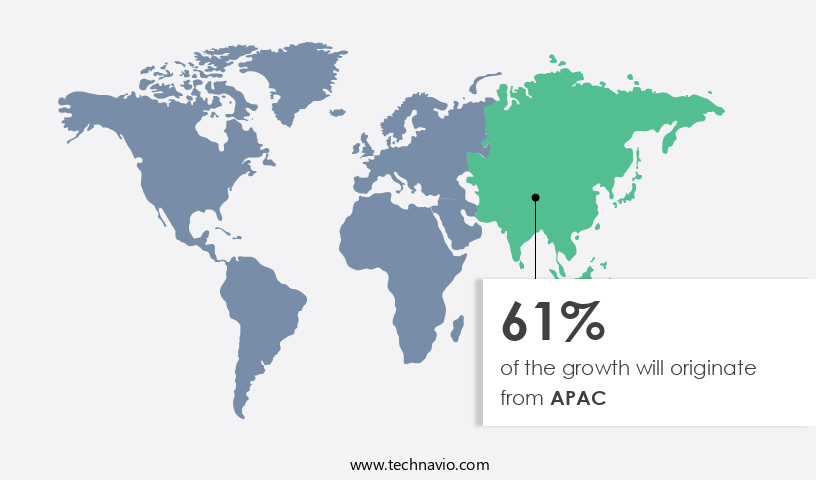
APAC is estimated to contribute 61% to the growth of the global market during the forecast period. Technavio's analysts have elaborately explained the regional trends and drivers that shape the market during the forecast period.
For more insights on the market size of various regions, Request Free Sample
The Asian Pacific (APAC) region is a significant market for moringa products, with key consumer countries including India, China, the Philippines, Cambodia, Bangladesh, Australia, Japan, Taiwan, and Afghanistan. Southeast Asia is the largest sub-region for moringa product consumption worldwide. Moringa seeds, moringa leaf powder, and moringa pods (drumsticks) are popular in APAC. The moringa market in this region is moderately fragmented, with numerous regional and a few global companies. Notable suppliers are Ancient GreenFields Pvt. Ltd., Earth Expo Co., and Grenera Nutrients Pvt. Ltd. Organized retail outlets in APAC increasingly stock moringa items, such as private-label brands of moringa oil and moringa powder. companies employ promotional efforts to secure shelf space allocation. Major moringa product markets in APAC are India, China, and the Philippines.
Market Dynamics
Our researchers analyzed the data with 2023 as the base year, along with the key drivers, trends, and challenges. A holistic analysis of drivers will help companies refine their marketing strategies to gain a competitive advantage.
What are the key market drivers leading to the rise In the adoption of Moringa Products Industry?
- Rising awareness of health benefits of moringa products is the key driver of the market. The market has experienced notable expansion over the past decade, driven by escalating consumer interest In these natural offerings. This trend is largely fueled by heightened awareness of moringa's health advantages, which have gained traction in Europe, North America, and South America. Moringa, a rich source of essential amino acids, offers a complete protein profile, providing all the necessary amino acids the body cannot produce on its own.
- As health-conscious consumers seek out natural alternatives, moringa products have become increasingly popular in health food stores, organic markets, and as dietary supplements and herbal remedies. Sustainable agriculture practices further add to the appeal of moringa, making it an attractive choice for those prioritizing eco-friendly options. Moringa's health benefits, coupled with the growing consumer preference for natural products, are expected to continue fueling market growth In the coming years.
What are the market trends shaping the Moringa Products Industry?
- Increasing prominence of private-label brands is the upcoming market trend. The private label market for moringa products, including oils and powders, is gaining traction among retailers worldwide. This trend is driven by the increasing consumer demand for moringa-based offerings, leading retailers to introduce their own branded versions to boost profits. In recent years, the private label segment has expanded significantly, with major retailers such as Alibaba offering a range of moringa products, including organic varieties, under their own brands.
- Moringa oleifera, the plant species from which these products are derived, is renowned for its medicinal uses and nutritional benefits. As a result, moringa products have gained popularity as dietary supplements, wellness drinks, and beauty items. Retailers recognize the potential of this market and are capitalizing on it by offering private label moringa products to meet consumer demand.
What challenges does the Moringa Products Industry face during its growth?
- Growing demand for other superfood-based products is a key challenge affecting the industry growth. The market represents a niche segment within the expanding health and wellness food industry In the United States. While the popularity of plant-based superfoods continues to grow, the market is predicted to exhibit a steady growth trajectory over the next five years. Moringa leaf powder and oil are gaining traction due to their purported health benefits. However, the growth rate of this market may level off during the forecast period. Moringa-based products are primarily marketed for their health advantages, but other superfoods offer comparable health-promoting properties. For example, hemp is a rich source of globular proteins, edestin, and albumin.
- Moringa products are also used in various applications, including beverages, cosmetics, skincare, haircare, herbal products, and nutraceuticals. The demand for Moringa products is driven by their potential health benefits, such as antioxidant, anti-inflammatory, and antimicrobial properties. Additionally, Moringa is rich in essential vitamins and minerals, making it an attractive option for consumers seeking natural health solutions. However, the market growth may be influenced by factors such as increasing competition from other superfoods and varying consumer preferences.
Exclusive Customer Landscape
The moringa products market forecasting report includes the adoption lifecycle of the market, market growth and forecasting, covering from the innovator's stage to the laggard's stage. It focuses on adoption rates in different regions based on penetration. Furthermore, the moringa products market report also includes key purchase criteria and drivers of price sensitivity to help companies evaluate and develop their market growth analysis strategies.
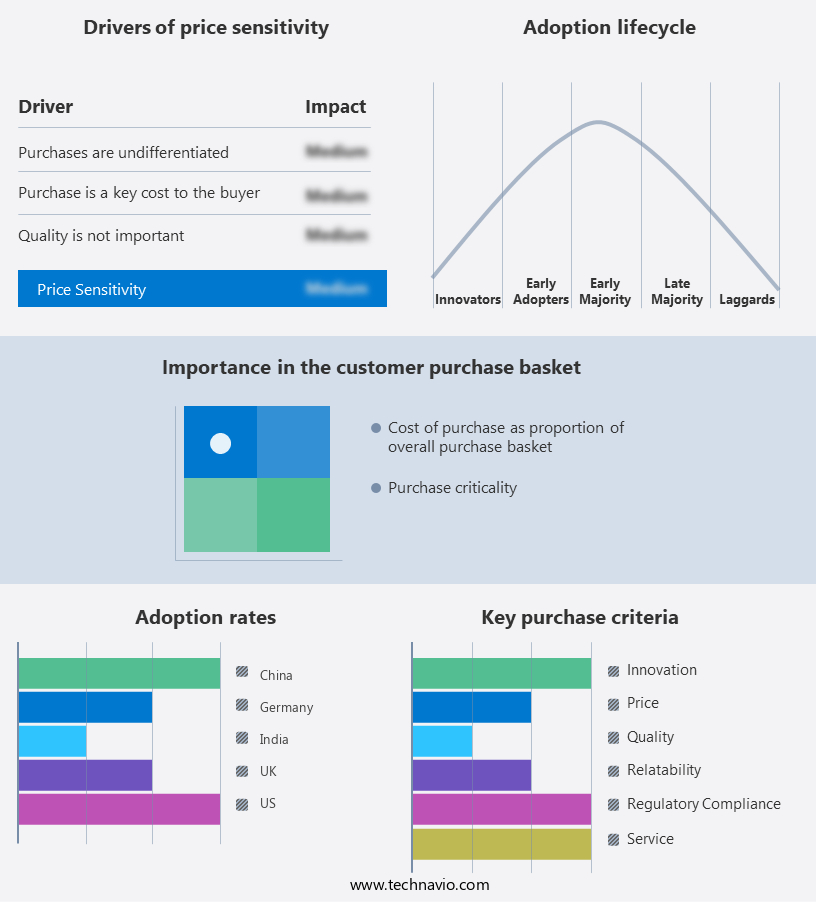
Customer Landscape
Key Companies & Market Insights
Companies are implementing various strategies, such as strategic alliances, moringa products market forecast, partnerships, mergers and acquisitions, geographical expansion, and product/service launches, to enhance their presence In the industry.
The industry research and growth report includes detailed analyses of the competitive landscape of the market and information about key companies, including:
- Aayuritz Phytonutrients Pvt. Ltd.
- Ancient GreenFields Pvt. Ltd.
- Attar Ayurveda
- Bio Moringa Oleifera GmbH
- Botanica Natural Products Pty Ltd.
- Earth Expo Co
- Feyn Foods OPC Pvt Ltd
- Grenera Nutrients Pvt. Ltd.
- HNCO Organics Pvt Ltd
- Kuli Kuli Inc.
- KV Natural Ingredients Pvt. Ltd.
- Medikonda Nutrients
- Miracle Garden Texas
- Moringa Farms Inc.
- Moringa Malawi
- MoSagri Lda
- Mother Herbs P Ltd.
- ORGANIC India Pvt. Ltd.
- PT Moringa Indonesia Fangardana
- TRUE MORINGA
Qualitative and quantitative analysis of companies has been conducted to help clients understand the wider business environment as well as the strengths and weaknesses of key industry players. Data is qualitatively analyzed to categorize companies as pure play, category-focused, industry-focused, and diversified; it is quantitatively analyzed to categorize companies as dominant, leading, strong, tentative, and weak.
Research Analyst Overview
Moringa, derived from the Moringa Oleifera tree, has gained significant attention In the global market as a superfood item. This natural product is rich in nutrients, including vitamins, minerals, and antioxidants, making it a popular choice among health-conscious consumers. Moringa oil, powder, and seeds are the most common forms of this superfood, finding their way into various product categories. Organized retail outlets, including health food stores and organic stores, have allocated shelf space to moringa products. Private-label brands have also started incorporating moringa into their offerings, recognizing its potential as an alternative superfood. Moringa's versatility extends to various applications, including dietary supplements, herbal remedies, beverages, cosmetics, skincare, haircare, and herbal products.
Product innovation is a key driver In the moringa market, with new forms and uses continually emerging. Brands are focusing on quality assurance and sustainable agriculture to meet consumer demand for organic and natural moringa products. Moringa's medicinal uses, as an Ayurvedic medicine, add to its appeal. Online sales channels have also contributed to the growth of the moringa market, making it easily accessible to consumers worldwide. Moringa's nutrient content makes it a natural digestive aid and a source of natural alternatives to synthetic supplements. It competes with other popular superfoods, such as quinoa and hemp-based products, and organic superfoods. The market for moringa is expected to grow as consumers seek natural botanical extracts to enhance their wellness routines.
|
Market Scope |
|
|
Report Coverage |
Details |
|
Page number |
157 |
|
Base year |
2023 |
|
Historic period |
2018-2022 |
|
Forecast period |
2024-2028 |
|
Growth momentum & CAGR |
Accelerate at a CAGR of 9.59% |
|
Market growth 2024-2028 |
USD 4.19 billion |
|
Market structure |
Fragmented |
|
YoY growth 2023-2024(%) |
8.78 |
|
Key countries |
US, India, China, Germany, and UK |
|
Competitive landscape |
Leading Companies, Market Positioning of Companies, Competitive Strategies, and Industry Risks |
What are the Key Data Covered in this Moringa Products Market Research and Growth Report?
- CAGR of the Moringa Products industry during the forecast period
- Detailed information on factors that will drive the growth and forecasting between 2024 and 2028
- Precise estimation of the size of the market and its contribution of the industry in focus to the parent market
- Accurate predictions about upcoming growth and trends and changes in consumer behaviour
- Growth of the market across APAC, Europe, North America, Middle East and Africa, and South America
- Thorough analysis of the market's competitive landscape and detailed information about companies
- Comprehensive analysis of factors that will challenge the moringa products market growth of industry companies
We can help! Our analysts can customize this moringa products market research report to meet your requirements.
 RIA -
RIA - 
