Non-Meat Ingredients Market Size 2025-2029
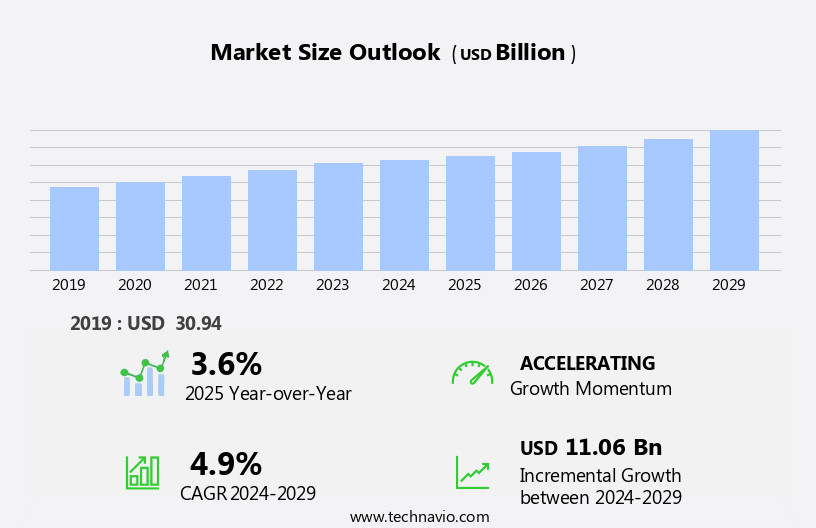
The non-meat ingredients market size is forecast to increase by USD 11.06 billion, at a CAGR of 4.9% between 2024 and 2029.
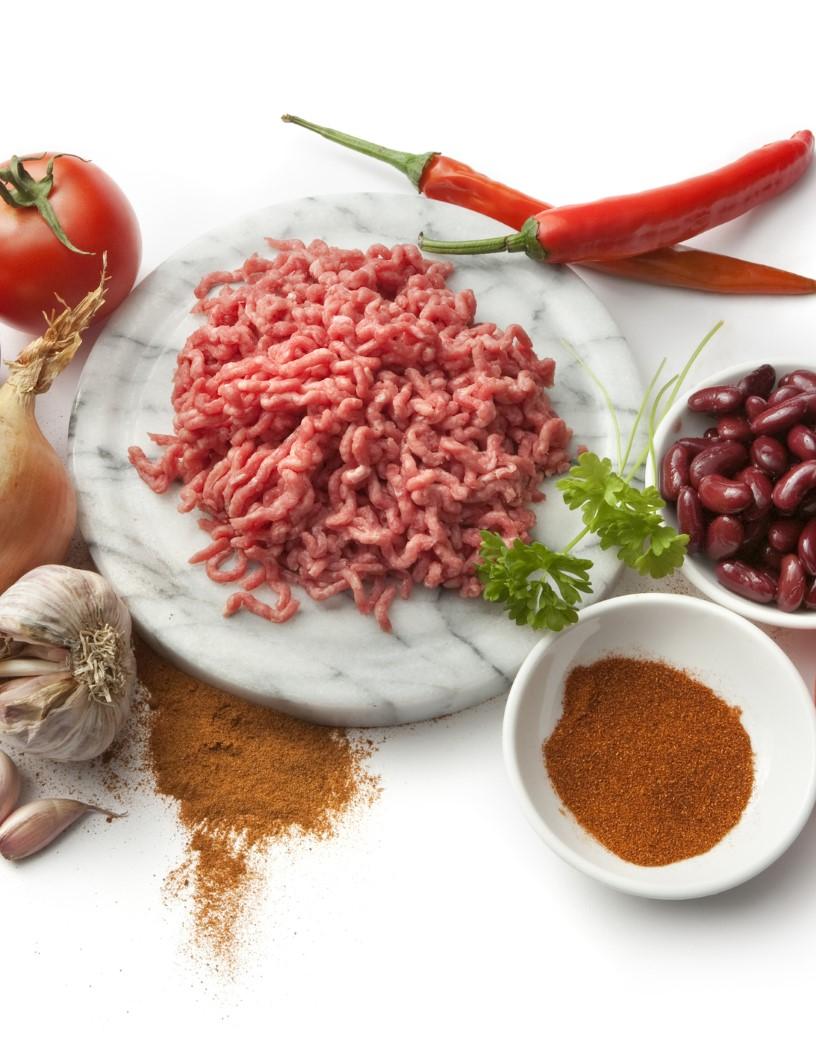
- The market is experiencing significant growth, driven by the increasing demand for plant-based food alternatives. This trend is being fueled by consumer preferences for healthier , nutritional and more sustainable food options, as well as ethical considerations. companies are responding to this demand by launching new products and expanding their offerings. However, the market faces challenges in the form of regulatory and labeling issues. As governments and regulatory bodies continue to implement stricter regulations on food labeling and safety standards, companies must navigate these complexities to ensure compliance. Additionally, the use of non-meat ingredients in food products may raise concerns regarding their safety and authenticity, necessitating clear and accurate labeling.
- Companies seeking to capitalize on market opportunities must stay informed of regulatory developments and invest in transparent labeling practices to build consumer trust and confidence. By addressing these challenges and meeting evolving consumer preferences, companies can effectively compete in the dynamic and growing the market.
What will be the Size of the Non-Meat Ingredients Market during the forecast period?
Explore in-depth regional segment analysis with market size data - historical 2019-2023 and forecasts 2025-2029 - in the full report.
Request Free Sample
The market continues to evolve as innovative protein sources emerge, pushing the boundaries of traditional plant-based and microbial-derived proteins. Amaranth protein extraction and textured vegetable protein are gaining traction in the food industry, offering unique textures and nutritional profiles. Sunflower protein extraction and chlorella protein purification are also attracting attention due to their high-protein content and sustainable production methods. Single-cell protein production from algae and microorganisms is revolutionizing the industry, providing novel protein sources with impressive sustainability benefits. Plant-based protein sources such as quinoa protein isolate and Pea Protein isolate are increasingly popular, while protein hydrolysate functionality offers versatility in various applications.
Algae-based Protein Ingredients, including spirulina protein concentrate and chlorella protein purification, are driving growth in the sector. Microbial fermentation optimization and algae biomass cultivation are key focus areas for companies seeking to optimize production and reduce environmental impact. Innovations in protein hydrolysate functionality, precision fermentation processes, and cellular agriculture technology are shaping the future of the market. Novel protein sources like insect protein processing and mushroom protein extraction are also gaining attention, expanding the market landscape. From sunflower seed protein and pumpkin seed protein to lentil protein concentrate and hydrolyzed vegetable protein, the market is teeming with diverse protein options.
Companies are continuously exploring new ways to optimize protein production, enhance functionality, and cater to evolving consumer preferences. The market is a dynamic and ever-changing landscape, with new innovations and applications unfolding at a rapid pace. The continuous exploration of novel protein sources and production methods ensures a vibrant and evolving market, offering significant opportunities for growth and development.
How is this Non-Meat Ingredients Industry segmented?
The non-meat ingredients industry research report provides comprehensive data (region-wise segment analysis), with forecasts and estimates in "USD billion" for the period 2025-2029, as well as historical data from 2019-2023 for the following segments.
- Type
- Flavoring agents
- Preservatives
- Fillers
- Coloring agents
- Others
- Application
- Processed and cured meat products
- Fresh meat products
- Marinated and seasoned meat products
- Ready-to-eat meat products
- Others
- Source
- Plant-Based (Soy, Pea, Wheat)
- Microbial
- Synthetic
- End-User
- Food Manufacturers
- Foodservice
- Household
- Geography
- North America
- US
- Canada
- Europe
- France
- Germany
- UK
- Middle East and Africa
- UAE
- APAC
- China
- India
- Japan
- South Korea
- South America
- Brazil
- Rest of World (ROW)
- North America
By Type Insights
The flavoring agents segment is estimated to witness significant growth during the forecast period.
In the evolving landscape of the market, flavoring agents assume a pivotal role. These agents are instrumental in replicating the savory, meat-like flavors that consumers have long associated with traditional meat products. With the growing demand for plant-based alternatives, manufacturers are investing significant resources in developing advanced flavoring solutions. These agents not only mimic the taste of meat but also cater to the preferences of health-conscious consumers, vegetarians, and vegans. Natural sources, such as yeast extracts and umami-rich compounds, are commonly used to produce these flavoring agents. However, fermentation processes are also employed to create complex flavors. Soy protein concentrate, hemp protein powder, and chickpea protein isolate are among the plant-based protein sources that undergo fermentation to produce savory flavors.
Mycoprotein fermentation and precision fermentation processes are also used to generate flavoring agents with meat-like taste profiles. Alternative protein production through microbial fermentation optimization, such as wheat gluten fractionation and lentil protein concentrate, contributes to the development of flavorful non-meat ingredients. Single-cell protein production from algae biomass cultivation and novel protein sources, like insect protein processing and mushroom protein extraction, are also gaining popularity. Sunflower seed protein, pumpkin seed protein, and potato protein extraction are other plant-based protein sources that can be utilized to create flavorful non-meat ingredients. Functional protein blends, such as hydrolyzed vegetable protein and soybean protein modification, play a crucial role in enhancing the taste and texture of non-meat products.
Spirulina protein concentrate, amaranth protein extraction, textured vegetable protein, and chlorella protein purification are additional examples of protein-rich ingredients that contribute to the development of flavorful non-meat alternatives. Algae-based protein ingredients, cellular agriculture technology, and protein hydrolysate functionality are other emerging trends in the market.
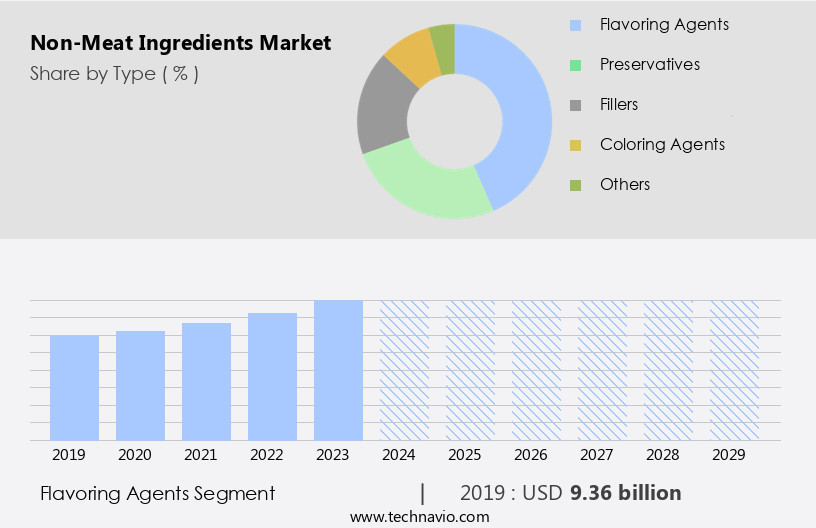
The Flavoring agents segment was valued at USD 9.36 billion in 2019 and showed a gradual increase during the forecast period.
Regional Analysis
North America is estimated to contribute 46% to the growth of the global market during the forecast period.Technavio's analysts have elaborately explained the regional trends and drivers that shape the market during the forecast period.
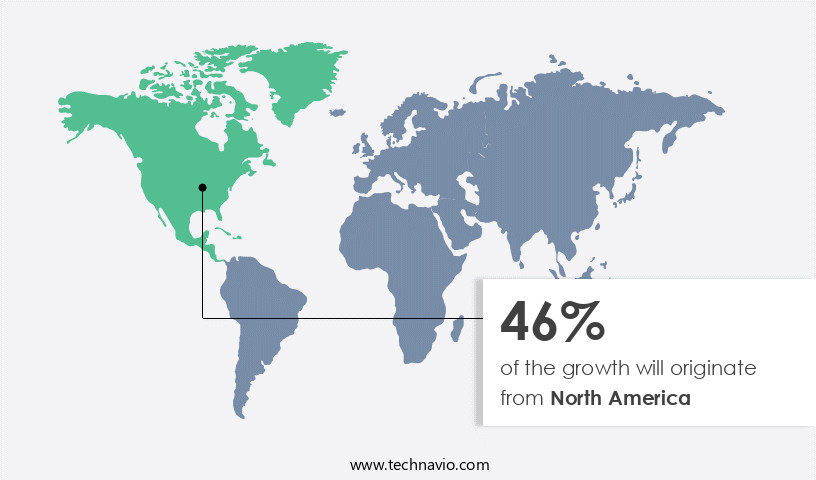
The market in North America, specifically in the US and Canada, is experiencing significant growth due to increasing consumer preference for plant-based food alternatives. Soy protein concentrate, hemp protein powder, and chickpea protein isolate are among the popular plant-based protein sources. Alternative protein production methods, such as mycoprotein fermentation, soybean protein modification, and watermelon seed protein, are gaining traction. Precision fermentation processes are also being explored for spirulina protein concentrate, amaranth protein extraction, and chlorella protein purification. Single-cell protein production from algae biomass cultivation and novel protein sources like microbial fermentation optimization, wheat gluten fractionation, pumpkin seed protein, and microalgae protein harvest are also emerging.
Functional protein blends made from pea protein isolate, insect protein processing, mushroom protein extraction, sunflower seed protein, lentil protein concentrate, potato protein extraction, hydrolyzed vegetable protein, and cottonseed protein are increasingly being used in various food applications. Cellular agriculture technology is another promising area, with companies focusing on developing innovative solutions. The shift towards plant-based diets is driven by ethical, environmental, and health considerations, with over 40% of Americans identifying as flexitarians and approximately 9 million and 2 million vegetarians and vegans in the US and Canada, respectively.
Market Dynamics
Our researchers analyzed the data with 2024 as the base year, along with the key drivers, trends, and challenges. A holistic analysis of drivers will help companies refine their marketing strategies to gain a competitive advantage.
The global non-meat ingredients market size and forecast projects growth, driven by non-meat ingredients market trends 2025-2029. B2B ingredient supply solutions leverage plant-based ingredient technologies for quality. Non-meat ingredients market growth opportunities 2025 include ingredients for vegan foods and non-meat flavor enhancers, meeting demand. Ingredient supply chain software optimizes operations, while non-meat ingredients market competitive analysis highlights key suppliers. Sustainable ingredient production practices align with eco-friendly food trends. Non-meat ingredients regulations 2025-2029 shapes ingredient demand in Europe 2025. High-quality non-meat solutions and premium non-meat ingredient insights boost adoption. Ingredients for plant-based meat and customized ingredient formulations target niches. Non-meat ingredients market challenges and solutions address sourcing, with direct procurement strategies for ingredients and ingredient pricing optimization enhancing profitability. Data-driven non-meat ingredient analytics and vegan ingredient trends drive innovation.
What are the key market drivers leading to the rise in the adoption of Non-Meat Ingredients Industry?
- The surge in consumer preference for plant-based products serves as the primary catalyst for market growth.
- The market is experiencing significant growth due to the increasing consumer preference for plant-based alternatives. This trend is driven by heightened awareness of the environmental and health benefits of reducing meat consumption. Between 2022 and 2027, the vegan food industry is projected to expand at a compound annual growth rate (CAGR) of around 11%. Key non-meat ingredients, such as soy protein concentrate, hemp protein powder, chickpea protein isolate, mycoprotein fermentation, soybean protein modification, watermelon seed protein, and spirulina protein concentrate, are gaining popularity as alternatives to animal-derived proteins. These ingredients are used in various food applications, including meat substitutes, plant-based milk, and Baked Goods.
- The environmental benefits of plant-based protein production, such as lower greenhouse gas emissions and reduced land and water use, are significant factors contributing to the market's growth. Additionally, advancements in precision fermentation processes and protein production technologies are enabling the production of high-quality, sustainable plant-based proteins. As consumers continue to seek out more sustainable and healthier food options, the demand for non-meat ingredients is expected to remain strong in the coming years. The market's growth is also being driven by the increasing availability of plant-based options in mainstream food retailers and the growing number of plant-based food startups.
- Overall, the market is an exciting and dynamic space, with significant opportunities for innovation and growth.
What are the market trends shaping the Non-Meat Ingredients Industry?
- The trend in the market is characterized by new product launches from companies. This professional and knowledgeable observation underscores the importance of staying informed about industry developments.
- The market is experiencing notable advancements as companies introduce innovative solutions to enhance the quality and consumer appeal of plant-based alternatives. In September 2023, Novozymes launched Vertera ProBite, a groundbreaking biosolution that addresses common consumer concerns regarding texture and lengthy ingredient lists in Plant-based meat products. Utilizing the enzyme MTGase, Vertera ProBite improves product texture without the need for labeling as a processing aid. This simplifies product formulations and increases transparency, making plant-based options more appealing. Another significant development occurred in June 2024 when Loryma, a plant-based brand under the Crespel and Deiters Group in Europe, introduced a wheat-based binder as a substitute for methylcellulose in vegan products.
- This innovation offers a natural alternative to traditional binders and addresses consumer preferences for cleaner labels. Both Vertera ProBite and the wheat-based binder contribute to the growing trend of using non-meat ingredients that cater to consumer demands for high-quality, sustainable, and transparent plant-based options.
What challenges does the Non-Meat Ingredients Industry face during its growth?
- The growth of the industry is significantly impacted by regulatory and labeling issues, requiring careful navigation to ensure compliance and maintain consumer trust.
- The market faces regulatory and labeling challenges that hinder market growth. Innovation in plant-based and alternative protein products is advancing at a rapid pace, yet existing regulatory frameworks struggle to keep up. In the European Union, for instance, plant-based alternatives to dairy products cannot use labels like almond milk or oat milk due to restrictions on milk terminology. Similar restrictions apply to meat-related terms such as snacks and burger or sausage in certain EU countries. These regulations compel manufacturers to use ambiguous labels like veggie discs or plant patties, which can confuse consumers and complicate marketing efforts.
- Advancements in non-meat ingredient production techniques, such as algae biomass cultivation, microbial fermentation optimization, wheat gluten fractionation, pumpkin seed protein, microalgae protein harvest, pea protein isolate, insect protein processing, and mushroom protein extraction, are driving market growth. However, regulatory inconsistencies and compliance difficulties pose significant hurdles. Manufacturers must navigate these challenges to bring innovative, label-compliant products to market. Collaboration between industry stakeholders and regulatory bodies is essential to establish clear and consistent labeling guidelines. By addressing these challenges, the market can continue to thrive and meet the growing demand for plant-based and alternative protein options.
Exclusive Customer Landscape
The non-meat ingredients market forecasting report includes the adoption lifecycle of the market, covering from the innovator's stage to the laggard's stage. It focuses on adoption rates in different regions based on penetration. Furthermore, the non-meat ingredients market report also includes key purchase criteria and drivers of price sensitivity to help companies evaluate and develop their market growth analysis strategies.

Customer Landscape
Key Companies & Market Insights
Companies are implementing various strategies, such as strategic alliances, non-meat ingredients market forecast, partnerships, mergers and acquisitions, geographical expansion, and product/service launches, to enhance their presence in the industry.
Angel Starch and Food Pvt. Ltd. - This company specializes in supplying non-meat ingredients for various industries. Their product portfolio includes functional native starches and plant-based proteins, contributing to innovative and sustainable food solutions.
The industry research and growth report includes detailed analyses of the competitive landscape of the market and information about key companies, including:
- Angel Starch and Food Pvt. Ltd.
- Archer Daniels Midland Co.
- Cargill Inc.
- Chr Hansen AS
- Givaudan SA
- Ingredion Inc.
- International Flavors and Fragrances Inc.
- Kemin Industries Inc.
- Kerry Group Plc
- Roquette Freres SA
- SPAC Starch Products India Pvt. Ltd.
- Symrise Group
- Tate and Lyle PLC
Qualitative and quantitative analysis of companies has been conducted to help clients understand the wider business environment as well as the strengths and weaknesses of key industry players. Data is qualitatively analyzed to categorize companies as pure play, category-focused, industry-focused, and diversified; it is quantitatively analyzed to categorize companies as dominant, leading, strong, tentative, and weak.
Recent Development and News in Non-Meat Ingredients Market
- In January 2024, DuPont Nutrition & Biosciences, a leading global ingredient manufacturer, launched a new line of plant-based texturizers, Protica PeaStar, to cater to the growing demand for non-meat alternatives in the food industry (DuPont press release).
- In March 2024, Cargill and Memphis Meats, a leading cell-based meat company, announced a strategic partnership to develop plant-based and cell-cultured meat alternatives using Cargill's texturizers and Memphis Meats' cellular agriculture technology (Cargill press release).
- In May 2024, The Quorn Foods Company, a major player in the market, raised £120 million in a funding round led by private equity firm Permira, to expand its production capacity and global presence (The Quorn Foods press release).
- In February 2025, the European Commission approved the use of soy protein isolate from genetically modified soybeans as a non-meat ingredient in food products, paving the way for increased adoption of plant-based alternatives in Europe (European Commission press release).
Research Analyst Overview
- The market experiences dynamic activity and trends, with a focus on regulatory compliance and functional food applications. Ingredient labeling regulations drive the demand for protein digestibility analysis and amino acid profiling to ensure nutritional protein quality. Protein solubility determination and emulsification capacity are essential for product application development, while protein denaturation prevention and texture analysis techniques optimize product texture and sensory appeal. Microbial contamination control and shelf-life extension methods are crucial for maintaining product safety and freshness. Supply chain traceability and regulatory compliance measures ensure transparency and trust for consumers. Cost-effective production methods and sustainable protein sourcing are key priorities for manufacturers.
- Protein gelling capacity and colorimetric analysis are important for ingredient functionality optimization, while process optimization techniques and packaging optimization strategies enhance overall efficiency and profitability. Ingredient stability testing and allergenic protein assessment are vital for maintaining product quality and safety. Bioavailability assessment and protein viscosity measurement are essential for understanding the impact of non-meat ingredients on nutritional value and texture. Protein foaming properties and sensory evaluation methods provide valuable insights into consumer preferences and market trends. Overall, the market is characterized by a strong focus on innovation, efficiency, and sustainability, with a commitment to delivering high-quality, functional, and safe ingredients for the food industry.
Dive into Technavio's robust research methodology, blending expert interviews, extensive data synthesis, and validated models for unparalleled Non-Meat Ingredients Market insights. See full methodology.
|
Market Scope |
|
|
Report Coverage |
Details |
|
Page number |
221 |
|
Base year |
2024 |
|
Historic period |
2019-2023 |
|
Forecast period |
2025-2029 |
|
Growth momentum & CAGR |
Accelerate at a CAGR of 4.9% |
|
Market growth 2025-2029 |
USD 11.06 billion |
|
Market structure |
Concentrated |
|
YoY growth 2024-2025(%) |
3.6 |
|
Key countries |
US, Germany, China, UK, France, Japan, Canada, India, South Korea, Brazil, and UAE |
|
Competitive landscape |
Leading Companies, Market Positioning of Companies, Competitive Strategies, and Industry Risks |
What are the Key Data Covered in this Non-Meat Ingredients Market Research and Growth Report?
- CAGR of the Non-Meat Ingredients industry during the forecast period
- Detailed information on factors that will drive the growth and forecasting between 2025 and 2029
- Precise estimation of the size of the market and its contribution of the industry in focus to the parent market
- Accurate predictions about upcoming growth and trends and changes in consumer behaviour
- Growth of the market across North America, Europe, APAC, South America, and Middle East and Africa
- Thorough analysis of the market's competitive landscape and detailed information about companies
- Comprehensive analysis of factors that will challenge the non-meat ingredients market growth of industry companies
We can help! Our analysts can customize this non-meat ingredients market research report to meet your requirements.
 RIA -
RIA - 
