Nutrigenomics Market Analysis, Size, and Forecast 2024-2028: North America (US and Canada), Europe (France, Germany, UK), APAC (Australia, India, Japan, South Korea), South America (Brazil), and Middle East and Africa (UAE)

Nutrigenomics Market Analysis, Size, and Forecast 2024-2028:
North America (US and Canada), Europe (France, Germany, UK), APAC (Australia, India, Japan, South Korea), South America (Brazil), and Middle East and Africa (UAE)

Published: Apr 2024 162 Pages SKU: IRTNTR40037

Market Overview at a Glance

$997.73 Mn
Market Opportunity
13.87%
CAGR
12.85
YoY growth 2023-2024(%)

Nutrigenomics Market Size 2024-2028

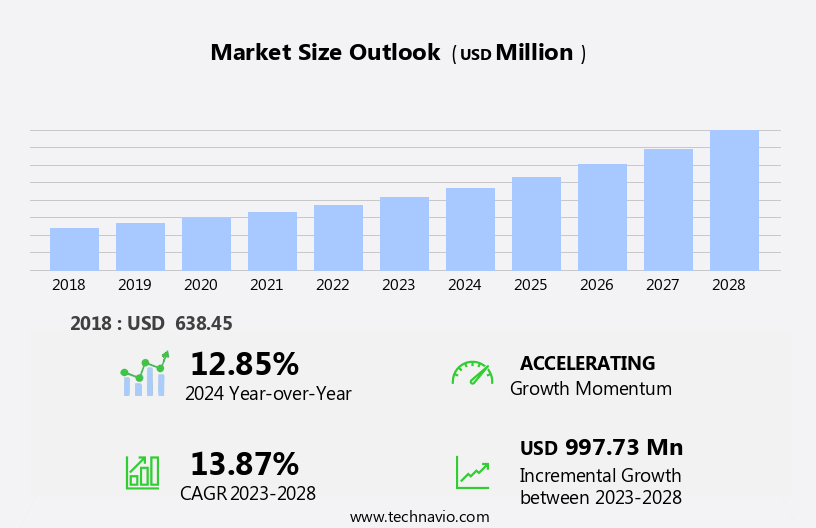
The nutrigenomics market size is forecast to increase by USD 997.73 million, at a CAGR of 13.87% between 2023 and 2028.

  • The market is experiencing significant growth, driven by the increasing cost of medical treatment and the advancements in the nutrigenomics industry. As healthcare expenses continue to rise, there is a growing demand for personalized and preventative healthcare solutions, which nutrigenomics offers through the analysis of the relationship between an individual's genetic makeup and the effect of food on their health. Moreover, the nutrigenomics industry is witnessing rapid developments, with ongoing research and technological advancements leading to new applications and tools for interpreting nutrigenomics datasets.
  • However, the high cost of these tools poses a significant challenge for market growth. Companies seeking to capitalize on market opportunities must focus on developing cost-effective solutions and collaborating with key industry players to access advanced technologies. Navigating this competitive landscape requires a deep understanding of the market dynamics and the ability to adapt to emerging trends and challenges.

What will be the Size of the Nutrigenomics Market during the forecast period?

Nutrigenomics Market Size

 Request Free Sample

The market continues to evolve, driven by advancements in genetic testing and personalized healthcare. This dynamic industry intertwines various sectors, including health coaching, dietary intervention, and direct-to-consumer (dtc) testing. Genetic information is used to provide tailored dietary recommendations based on metabolic pathways, nutrient absorption, and gene expression. Ethical considerations and privacy concerns remain ongoing discussions, as consumer genomics expands. Disease prevention is a significant focus, with nutrigenomics aiding in the identification of food intolerances and sensitivities, as well as personalized approaches to chronic diseases. Precision medicine and lifestyle modification are integral components, with nutrigenomics guiding functional foods and dietary supplement development.

Clinical trials and data analysis play a crucial role in advancing nutrigenomics, providing insights into nutrient metabolism, drug response, and the gut microbiome. Personalized healthcare and wellness programs leverage machine learning and artificial intelligence (AI) to analyze consumer data and deliver customized recommendations. The market's continuous unfolding is shaped by ongoing research and innovation, with applications extending to various industries and sectors. The integration of genetics and nutrition offers a promising future for improving health outcomes and enhancing overall well-being.

How is this Nutrigenomics Industry segmented?

The nutrigenomics industry research report provides comprehensive data (region-wise segment analysis), with forecasts and estimates in "USD million" for the period 2024-2028, as well as historical data from 2018-2022 for the following segments.

  • Application
    • Obesity
    • Cardiovascular diseases
    • Cancer research
    • Diabetes
    • Digestive health
  • Product
    • Reagents and kits
    • Services
    • Software
  • Technology
    • DNA sequencing
    • Microarray analysis
    • PCR.
  • End-User
    • Hospitals
    • Clinics
    • Research institutions
    • Direct-to-consumer
  • Geography
    • North America
      • US
      • Canada
    • Europe
      • France
      • Germany
      • UK
    • Middle East and Africa
      • UAE
    • APAC
      • Australia
      • India
      • Japan
      • South Korea
    • South America
      • Brazil
    • Rest of World (ROW)

    By Application Insights

    The obesity segment is estimated to witness significant growth during the forecast period.

    Genetic testing plays a pivotal role in the market, enabling personalized approaches to disease prevention and health outcomes. However, privacy concerns surrounding genetic information require ethical considerations and counseling. Nutritional genomics explores the relationship between genetics and metabolic pathways, influencing nutrient absorption and metabolism. Precision medicine and lifestyle modification based on nutritional status and gut microbiome analysis are key trends. Functional foods, dietary supplements, and health coaching offer customized solutions for consumers. Genome sequencing and clinical trials contribute to personalized healthcare and chronic disease management.

    Consumer genomics, including food intolerance and wellness programs, are gaining popularity. Machine learning and artificial intelligence facilitate data analysis, enabling personalized nutrition recommendations and drug response predictions. Nutrient metabolism, gene expression, and food sensitivity are essential areas of focus in this evolving market.

    Nutrigenomics Market Size

    Request Free Sample

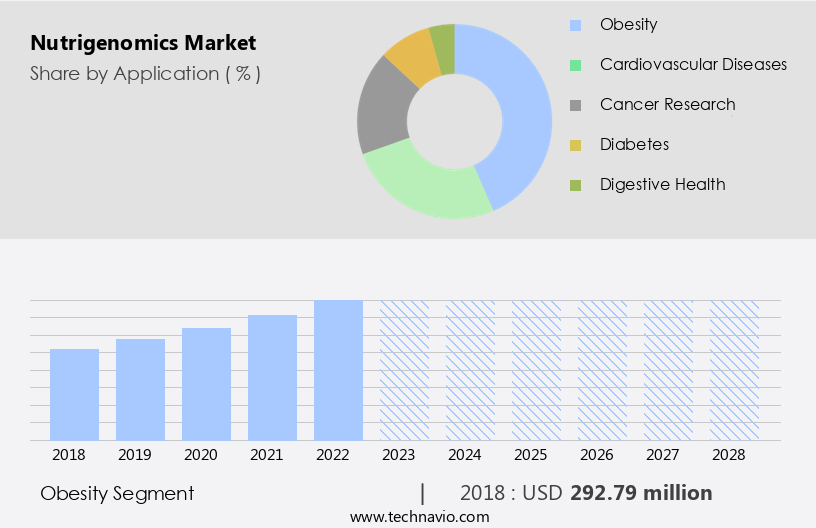
    The Obesity segment was valued at USD 292.79 million in 2018 and showed a gradual increase during the forecast period.

    Regional Analysis

    North America is estimated to contribute 41% to the growth of the global market during the forecast period.Technavio’s analysts have elaborately explained the regional trends and drivers that shape the market during the forecast period.

    Nutrigenomics Market Share by Geography

     Request Free Sample

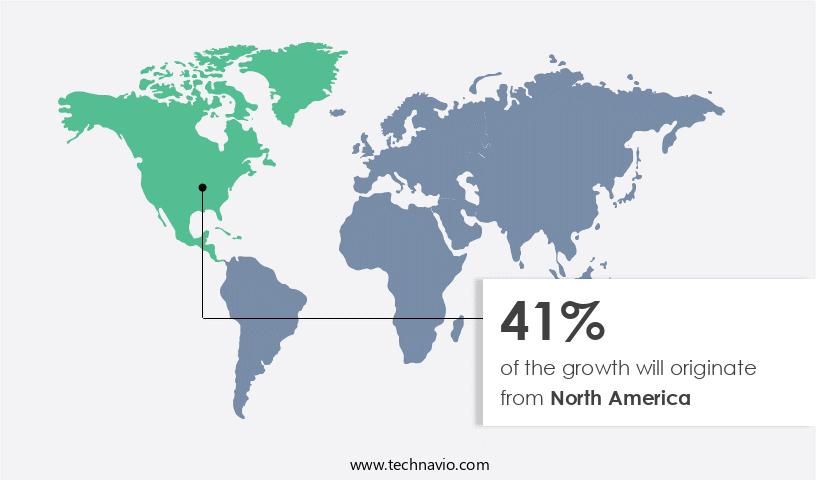
    In North America, the market is experiencing significant growth, fueled by a heightened awareness of personalized nutrition and preventative healthcare. With a high prevalence of lifestyle-related diseases such as obesity and diabetes, consumers are increasingly seeking ways to optimize their nutritional intake based on their unique genetic makeup. The region's advanced healthcare technologies and high disposable income further drive demand for nutrigenomics testing services. The US leads the market in North America due to the high number of people suffering from chronic diseases, cancer, and obesity. Nutrigenomics offers the potential to prevent, mitigate, and treat these conditions through targeted dietary changes, making it a valuable tool in the fight against chronic diseases.

    Ethical considerations surrounding genetic testing and privacy concerns are being addressed through rigorous data security measures and genetic counseling services. Metabolic pathways, nutrient absorption, and drug response are key areas of focus in nutrigenomics research, leading to the development of precision medicine and personalized healthcare solutions. Functional foods, nutrient metabolism, and dietary supplements are also gaining popularity as consumers seek to improve their nutritional status and overall health. The gut microbiome, food intolerance, and food sensitivity are also areas of interest in the market, with potential applications in wellness programs and lifestyle modification. Machine learning and artificial intelligence are being employed to analyze consumer data and provide personalized dietary recommendations based on an individual's genetic profile and health goals.

    Clinical trials and personalized nutrition are also key areas of research, with the ultimate goal of improving health outcomes and reducing the burden of chronic diseases.

    Market Dynamics

    Our researchers analyzed the data with 2023 as the base year, along with the key drivers, trends, and challenges. A holistic analysis of drivers will help companies refine their marketing strategies to gain a competitive advantage.

    What are the key market drivers leading to the rise in the adoption of Nutrigenomics Industry?

    • The escalating costs of medical treatment serve as the primary market driver. 

    • The market is experiencing significant growth due to the increasing prevalence of diseases and rising healthcare costs. According to the Centers for Disease Control and Prevention (CDC), approximately 610,000 people die of heart disease annually in the US. The escalating burden of these diseases directly impacts overall healthcare expenses, as patients often incur substantial costs on treatment, medication, and hospitalization. The high cost of branded drugs further contributes to medical expenditures, leading many individuals to explore alternative options. In response, there is a growing trend towards precision medicine and lifestyle modification, which includes the consumption of functional foods and nutritional supplements.
    • These products cater to the unique nutritional requirements of individuals based on their genome sequencing and nutrient metabolism. They contain essential nutrients, such as vitamins, proteins, carotenoids, fibers, polyphenols, and probiotics, which positively influence health and drug response. The gut microbiome, a critical component of nutrigenomics, plays a vital role in the absorption and metabolism of these nutrients. As a result, the market for nutrigenomics is expected to continue expanding as more people seek to optimize their health through personalized nutrition.

    What are the market trends shaping the Nutrigenomics Industry?

    • The nutrigenomics industry is experiencing significant advancements, positioning it as the next market trend. This field explores the relationship between genes and nutrition, offering personalized dietary solutions.

    • The market is experiencing notable growth due to the increasing emphasis on personalized healthcare and dietary intervention. Advanced genetic testing technologies, such as next-generation sequencing and microarray analysis, enable accurate assessment of an individual's genetic composition and its interaction with dietary factors. This information leads to personalized nutrition recommendations tailored to each person's unique genetic profile. Recent market developments include Xcode Life's introduction of an extensive gene nutrition test and SomaLogic's collaboration with Citogen to expand the authorized site program across Europe, utilizing SomaLogic's 7,000-plex SomaScan Platform for clinical research, population health studies, and nutrigenomics.
    • These advancements contribute to the market's expansion and highlight the potential for nutrigenomics in addressing chronic diseases through data analysis and personalized dietary recommendations.

    What challenges does the Nutrigenomics Industry face during its growth?

    • The high cost of interpreting nutrigenomics datasets is a significant challenge impeding the growth of the industry. Nutrigenomics, a field of nutritional science that explores the relationship between genes and nutrition, generates vast amounts of complex data. The analysis of this data requires specialized tools and expertise, leading to substantial expenses for companies. Overcoming this financial hurdle is essential for the continued expansion and advancement of the nutrigenomics industry. 

    • Nutrigenomics, the intersection of nutrition and genetics, is revolutionizing the way consumers approach their health and wellness. This field focuses on the impact of food on gene expression and individual responses to specific foods based on their genetic makeup. One significant application of nutrigenomics is in identifying food intolerances and sensitivities. Consumer genomics plays a pivotal role in this market, with companies offering genetic testing services that provide personalized dietary recommendations. For instance, Nutrigenomix Inc. Offers nutrigenomics testing, which includes genotyping, genetic test kits, and customized reports based on the latest research and scientific evidence.
    • However, the high cost of user-friendly tools for interpreting nutrigenomics data is a challenge hindering market growth. Advancements in technology, such as machine learning and artificial intelligence (AI), are helping to address this issue. These technologies enable the analysis of vast amounts of nutrigenomics data, providing insights into food sensitivity and gene expression. For example, specialized software can analyze combined nuclear magnetic resonance (NMR) and mass spectrometry (MS) data sets to identify critical steps for nutrigenomic analysis. Wellness programs are increasingly incorporating nutrigenomics to offer personalized recommendations for their members. As the importance of individualized nutrition becomes more recognized, the market is expected to continue growing.
    • Despite the challenges, the potential benefits of this field make it an exciting area for innovation and development.

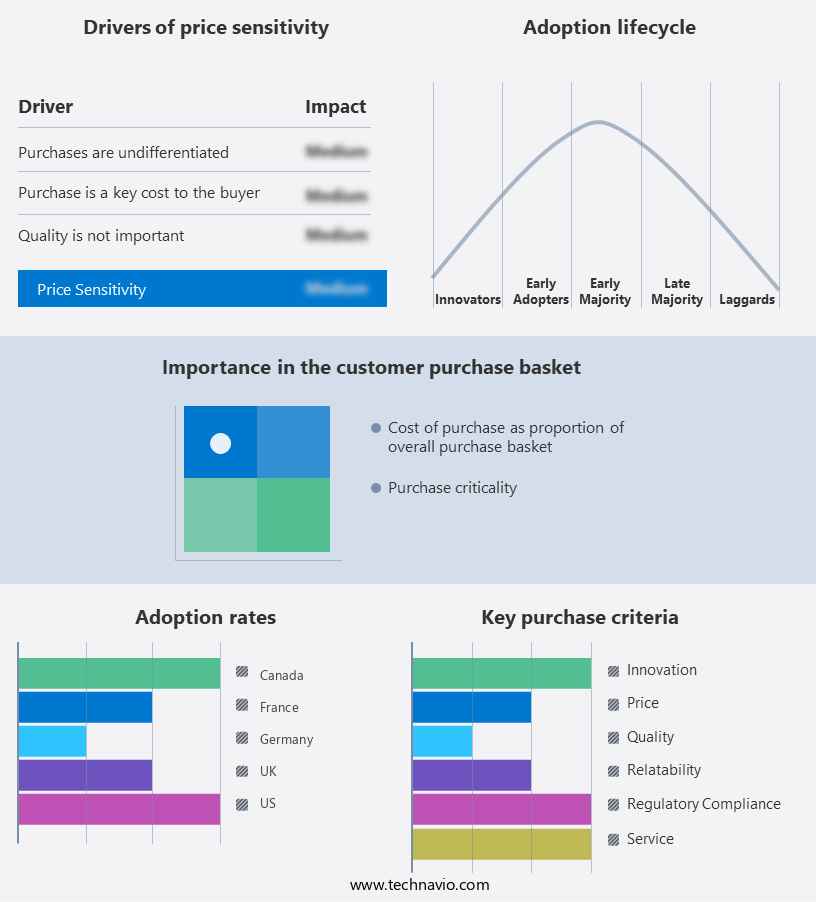
    Exclusive Customer Landscape

    The nutrigenomics market forecasting report includes the adoption lifecycle of the market, covering from the innovator’s stage to the laggard’s stage. It focuses on adoption rates in different regions based on penetration. Furthermore, the nutrigenomics market report also includes key purchase criteria and drivers of price sensitivity to help companies evaluate and develop their market growth analysis strategies.

    Nutrigenomics Market Share by Geography

     Customer Landscape

    Key Companies & Market Insights

    Companies are implementing various strategies, such as strategic alliances, nutrigenomics market forecast, partnerships, mergers and acquisitions, geographical expansion, and product/service launches, to enhance their presence in the industry.

    Nutrigenomix Inc. - The company specializes in nutrigenomics, providing essential vitamins and omega oils for optimal health. Our offerings encompass Vitamin K1, Vitamin A, B-complex Vitamins including B1, B12, and B5, Vitamin D3, Vitamin K2 as MK-7, Vitamin E, and Vegapure plant sterols. These nutrients support various bodily functions, enhancing overall wellness. Our commitment to scientific research underpins the selection and efficacy of each product.

    The industry research and growth report includes detailed analyses of the competitive landscape of the market and information about key companies, including:

    • Nutrigenomix Inc.
    • 23andMe Inc.
    • DNAfit
    • GX Sciences Inc.
    • Metagenics Inc.
    • Xcode Life
    • Vitagene
    • Mapmygenome
    • Koninklijke DSM N.V.
    • Danone S.A.
    • BASF SE
    • Nestlé Health Science GenoPalate Inc.
    • GeneOmbio Technologies
    • Holistic Health International
    • Pathway Genomics
    • Cura Integrative Medicine
    • WellGenix
    • Nutrigenetics Unlimited
    • Interleukin Genetics

    Qualitative and quantitative analysis of companies has been conducted to help clients understand the wider business environment as well as the strengths and weaknesses of key industry players. Data is qualitatively analyzed to categorize companies as pure play, category-focused, industry-focused, and diversified; it is quantitatively analyzed to categorize companies as dominant, leading, strong, tentative, and weak.

    Recent Development and News in Nutrigenomics Market

    • In February 2023, Nestle, a global leader in nutrition, health, and wellness, announced the launch of its new personalized nutrition service, "Nestle Health Science Nutrigenomics," which utilizes nutrigenomics to develop personalized dietary plans based on an individual's genetic makeup (Nestle Press Release, 2023).
    • In March 2024, Thermo Fisher Scientific, a leading biotechnology product developer and provider, entered into a strategic partnership with 23andMe, a consumer genetics and biotechnology company, to integrate Thermo Fisher's SEQüence Suite Bioinformatics Software into 23andMe's nutrigenomics offerings, enhancing the accuracy and accessibility of personalized nutrition recommendations (Thermo Fisher Scientific Press Release, 2024).
    • In June 2024, the European Food Safety Authority (EFSA) granted a positive opinion on the health claim for the nutrigenomic ingredient, OmniGen, developed by Lonza, a Swiss specialty ingredients supplier. This approval marks a significant milestone in the acceptance and regulation of nutrigenomics in the European market (Lonza Press Release, 2024).
    • In November 2025, Danone, a leading global food company, announced a strategic investment of €100 million in NutriLeads, a Danish biotech company specializing in nutrigenomics, to expand its presence in the personalized nutrition market and accelerate the development of novel nutrigenomic ingredients (Danone Press Release, 2025).

    Research Analyst Overview

    • The market encompasses various sectors, including public health initiatives, wearable technology, and the food industry. This market is driven by the integration of nutrigenomic databases and next-generation sequencing (NGS) technologies, enabling personalized dietary plans and health risk assessments. Wearable technology and mobile health (mHealth) platforms facilitate real-time dietary tracking and lifestyle coaching. Precision agriculture and agricultural biotechnology leverage genetic variant analysis and SNP chip arrays to optimize crop production. Data privacy and security are paramount concerns, with regulatory frameworks addressing genetic discrimination and informed consent. Genetic counseling services ensure accurate interpretation of genetic information, while digital health platforms facilitate biodata management and personalized medicine.
    • Mass spectrometry and gene-diet interaction studies further expand the scope of nutrigenomics research. Fitness programs and personalized nutrition products cater to individual needs, while NGS and exome sequencing provide comprehensive genetic information. Data privacy and security are essential in managing sensitive genetic information, with regulatory bodies implementing guidelines to protect consumer data. In the agricultural sector, nutrigenomics applications in precision agriculture and agricultural biotechnology aim to optimize crop yield and nutritional content, ensuring food security and sustainability. The food industry also benefits from nutrigenomics, with personalized dietary plans and nutrition education tailored to individual genetic makeup.
    • Overall, the market continues to evolve, driven by technological advancements and the growing demand for personalized health and wellness solutions.

    Dive into Technavio’s robust research methodology, blending expert interviews, extensive data synthesis, and validated models for unparalleled Nutrigenomics Market insights. See full methodology.

    Market Scope

    Report Coverage

    Details

    Page number

    162

    Base year

    2023

    Historic period

    2018-2022

    Forecast period

    2024-2028

    Growth momentum & CAGR

    Accelerate at a CAGR of 13.87%

    Market growth 2024-2028

    USD 997.73 million

    Market structure

    Fragmented

    YoY growth 2023-2024(%)

    12.85

    Key countries

    US, Canada, UK, France, India, Japan, South Korea, Australia, Germany, UAE, and Brazil

    Competitive landscape

    Leading Companies, Market Positioning of Companies, Competitive Strategies, and Industry Risks

    Request Free Sample

    What are the Key Data Covered in this Nutrigenomics Market Research and Growth Report?

    • CAGR of the Nutrigenomics industry during the forecast period
    • Detailed information on factors that will drive the growth and forecasting between 2024 and 2028
    • Precise estimation of the size of the market and its contribution of the industry in focus to the parent market
    • Accurate predictions about upcoming growth and trends and changes in consumer behaviour
    • Growth of the market across North America, Europe, APAC, South America, and Middle East and Africa
    • Thorough analysis of the market’s competitive landscape and detailed information about companies
    • Comprehensive analysis of factors that will challenge the nutrigenomics market growth of industry companies

    We can help! Our analysts can customize this nutrigenomics market research report to meet your requirements.

    Get in touch


    1 Executive Summary

    • 1.1 Market overview
      • Exhibit 01: Executive Summary – Chart on Market Overview
      • Exhibit 02: Executive Summary – Data Table on Market Overview
      • Exhibit 03: Executive Summary – Chart on Global Market Characteristics
      • Exhibit 04: Executive Summary – Chart on Market by Geography
      • Exhibit 05: Executive Summary – Chart on Market Segmentation by Application
      • Exhibit 06: Executive Summary – Chart on Market Segmentation by Product
      • Exhibit 07: Executive Summary – Chart on Incremental Growth
      • Exhibit 08: Executive Summary – Data Table on Incremental Growth
      • Exhibit 09: Executive Summary – Chart on Vendor Market Positioning

    2 Market Landscape

    • 2.1 Market ecosystem
      • Exhibit 10: Parent market
      • Exhibit 11: Market Characteristics

    3 Market Sizing

    • 3.1 Market definition
      • Exhibit 12: Offerings of vendors included in the market definition
    • 3.2 Market segment analysis
      • Exhibit 13: Market segments
    • 3.3 Market size 2023
      • 3.4 Market outlook: Forecast for 2023-2028
        • Exhibit 14: Chart on Global - Market size and forecast 2023-2028 ($ million)
        • Exhibit 15: Data Table on Global - Market size and forecast 2023-2028 ($ million)
        • Exhibit 16: Chart on Global Market: Year-over-year growth 2023-2028 (%)
        • Exhibit 17: Data Table on Global Market: Year-over-year growth 2023-2028 (%)

      4 Historic Market Size

      • 4.1 Global nutrigenomics market 2018 - 2022
        • Exhibit 18: Historic Market Size – Data Table on global nutrigenomics market 2018 - 2022 ($ million)
      • 4.2 Application Segment Analysis 2018 - 2022
        • Exhibit 19: Historic Market Size – Application Segment 2018 - 2022 ($ million)
      • 4.3 Product Segment Analysis 2018 - 2022
        • Exhibit 20: Historic Market Size – Product Segment 2018 - 2022 ($ million)
      • 4.4 Geography Segment Analysis 2018 - 2022
        • Exhibit 21: Historic Market Size – Geography Segment 2018 - 2022 ($ million)
      • 4.5 Country Segment Analysis 2018 - 2022
        • Exhibit 22: Historic Market Size – Country Segment 2018 - 2022 ($ million)

      5 Five Forces Analysis

      • 5.1 Five forces summary
        • Exhibit 23: Five forces analysis - Comparison between 2023 and 2028
      • 5.2 Bargaining power of buyers
        • Exhibit 24: Chart on Bargaining power of buyers – Impact of key factors 2023 and 2028
      • 5.3 Bargaining power of suppliers
        • Exhibit 25: Bargaining power of suppliers – Impact of key factors in 2023 and 2028
      • 5.4 Threat of new entrants
        • Exhibit 26: Threat of new entrants – Impact of key factors in 2023 and 2028
      • 5.5 Threat of substitutes
        • Exhibit 27: Threat of substitutes – Impact of key factors in 2023 and 2028
      • 5.6 Threat of rivalry
        • Exhibit 28: Threat of rivalry – Impact of key factors in 2023 and 2028
      • 5.7 Market condition
        • Exhibit 29: Chart on Market condition - Five forces 2023 and 2028

      6 Market Segmentation by Application

      • 6.1 Market segments
        • Chart on Application - Market share (2023-2028) (%)
        • Data Table on Application - Market share (2023-2028) (%)
      • 6.2 Comparison by Application
        • Chart on Comparison by Application
        • Data Table on Comparison by Application
      • 6.3 Obesity - Market size and forecast (2023-2028)
        • Chart on Obesity - Market size and forecast (2023-2028) ($ million)
        • Data Table on Obesity - Market size and forecast (2023-2028) ($ million)
        • Chart on Obesity - Year-over-year growth (2023-2028) (%)
        • Data Table on Obesity - Year-over-year growth (2023-2028) (%)
      • 6.4 Cardiovascular diseases - Market size and forecast (2023-2028)
        • Chart on Cardiovascular diseases - Market size and forecast (2023-2028) ($ million)
        • Data Table on Cardiovascular diseases - Market size and forecast (2023-2028) ($ million)
        • Chart on Cardiovascular diseases - Year-over-year growth (2023-2028) (%)
        • Data Table on Cardiovascular diseases - Year-over-year growth (2023-2028) (%)
      • 6.5 Cancer research - Market size and forecast (2023-2028)
        • Chart on Cancer research - Market size and forecast (2023-2028) ($ million)
        • Data Table on Cancer research - Market size and forecast (2023-2028) ($ million)
        • Chart on Cancer research - Year-over-year growth (2023-2028) (%)
        • Data Table on Cancer research - Year-over-year growth (2023-2028) (%)
      • 6.6 Diabetes - Market size and forecast (2023-2028)
        • Chart on Diabetes - Market size and forecast (2023-2028) ($ million)
        • Data Table on Diabetes - Market size and forecast (2023-2028) ($ million)
        • Chart on Diabetes - Year-over-year growth (2023-2028) (%)
        • Data Table on Diabetes - Year-over-year growth (2023-2028) (%)
      • 6.7 Digestive health - Market size and forecast (2023-2028)
        • Chart on Digestive health - Market size and forecast (2023-2028) ($ million)
        • Data Table on Digestive health - Market size and forecast (2023-2028) ($ million)
        • Chart on Digestive health - Year-over-year growth (2023-2028) (%)
        • Data Table on Digestive health - Year-over-year growth (2023-2028) (%)
      • 6.8 Market opportunity by Application
        • Market opportunity by Application ($ million)
        • Data Table on Market opportunity by Application ($ million)

      7 Market Segmentation by Product

      • 7.1 Market segments
        • Chart on Product - Market share (2023-2028) (%)
        • Data Table on Product - Market share (2023-2028) (%)
      • 7.2 Comparison by Product
        • Chart on Comparison by Product
        • Data Table on Comparison by Product
      • 7.3 Reagents and kits - Market size and forecast (2023-2028)
        • Chart on Reagents and kits - Market size and forecast (2023-2028) ($ million)
        • Data Table on Reagents and kits - Market size and forecast (2023-2028) ($ million)
        • Chart on Reagents and kits - Year-over-year growth (2023-2028) (%)
        • Data Table on Reagents and kits - Year-over-year growth (2023-2028) (%)
      • 7.4 Services - Market size and forecast (2023-2028)
        • Chart on Services - Market size and forecast (2023-2028) ($ million)
        • Data Table on Services - Market size and forecast (2023-2028) ($ million)
        • Chart on Services - Year-over-year growth (2023-2028) (%)
        • Data Table on Services - Year-over-year growth (2023-2028) (%)
      • 7.5 Software - Market size and forecast (2023-2028)
        • Chart on Software - Market size and forecast (2023-2028) ($ million)
        • Data Table on Software - Market size and forecast (2023-2028) ($ million)
        • Chart on Software - Year-over-year growth (2023-2028) (%)
        • Data Table on Software - Year-over-year growth (2023-2028) (%)
      • 7.6 Market opportunity by Product
        • Market opportunity by Product ($ million)
        • Data Table on Market opportunity by Product ($ million)

      8 Market Segmentation by Technology

      • 8.1 Market segments
        • Chart on Technology - Market share (2023-2028) (%)
        • Data Table on Technology - Market share (2023-2028) (%)
      • 8.2 Comparison by Technology
        • Chart on Comparison by Technology
        • Data Table on Comparison by Technology
      • 8.3 DNA sequencing - Market size and forecast (2023-2028)
        • Chart on DNA sequencing - Market size and forecast (2023-2028) ($ million)
        • Data Table on DNA sequencing - Market size and forecast (2023-2028) ($ million)
        • Chart on DNA sequencing - Year-over-year growth (2023-2028) (%)
        • Data Table on DNA sequencing - Year-over-year growth (2023-2028) (%)
      • 8.4 Microarray analysis - Market size and forecast (2023-2028)
        • Chart on Microarray analysis - Market size and forecast (2023-2028) ($ million)
        • Data Table on Microarray analysis - Market size and forecast (2023-2028) ($ million)
        • Chart on Microarray analysis - Year-over-year growth (2023-2028) (%)
        • Data Table on Microarray analysis - Year-over-year growth (2023-2028) (%)
      • 8.5 PCR. - Market size and forecast (2023-2028)
        • Chart on PCR. - Market size and forecast (2023-2028) ($ million)
        • Data Table on PCR. - Market size and forecast (2023-2028) ($ million)
        • Chart on PCR. - Year-over-year growth (2023-2028) (%)
        • Data Table on PCR. - Year-over-year growth (2023-2028) (%)
      • 8.6 Market opportunity by Technology
        • Market opportunity by Technology ($ million)
        • Data Table on Market opportunity by Technology ($ million)

      9 Market Segmentation by End-User

      • 9.1 Market segments
        • Chart on End-User - Market share (2023-2028) (%)
        • Data Table on End-User - Market share (2023-2028) (%)
      • 9.2 Comparison by End-User
        • Chart on Comparison by End-User
        • Data Table on Comparison by End-User
      • 9.3 Hospitals - Market size and forecast (2023-2028)
        • Chart on Hospitals - Market size and forecast (2023-2028) ($ million)
        • Data Table on Hospitals - Market size and forecast (2023-2028) ($ million)
        • Chart on Hospitals - Year-over-year growth (2023-2028) (%)
        • Data Table on Hospitals - Year-over-year growth (2023-2028) (%)
      • 9.4 Clinics - Market size and forecast (2023-2028)
        • Chart on Clinics - Market size and forecast (2023-2028) ($ million)
        • Data Table on Clinics - Market size and forecast (2023-2028) ($ million)
        • Chart on Clinics - Year-over-year growth (2023-2028) (%)
        • Data Table on Clinics - Year-over-year growth (2023-2028) (%)
      • 9.5 Research institutions - Market size and forecast (2023-2028)
        • Chart on Research institutions - Market size and forecast (2023-2028) ($ million)
        • Data Table on Research institutions - Market size and forecast (2023-2028) ($ million)
        • Chart on Research institutions - Year-over-year growth (2023-2028) (%)
        • Data Table on Research institutions - Year-over-year growth (2023-2028) (%)
      • 9.6 Direct-to-consumer - Market size and forecast (2023-2028)
        • Chart on Direct-to-consumer - Market size and forecast (2023-2028) ($ million)
        • Data Table on Direct-to-consumer - Market size and forecast (2023-2028) ($ million)
        • Chart on Direct-to-consumer - Year-over-year growth (2023-2028) (%)
        • Data Table on Direct-to-consumer - Year-over-year growth (2023-2028) (%)
      • 9.7 Market opportunity by End-User
        • Market opportunity by End-User ($ million)
        • Data Table on Market opportunity by End-User ($ million)

      8 Customer Landscape

      • 8.1 Customer landscape overview
        • Exhibit 62: Analysis of price sensitivity, lifecycle, customer purchase basket, adoption rates, and purchase criteria

      9 Geographic Landscape

      • 9.1 Geographic segmentation
        • Exhibit 63: Chart on Market share by geography 2023-2028 (%)
        • Exhibit 64: Data Table on Market share by geography 2023-2028 (%)
      • 9.2 Geographic comparison
        • Exhibit 65: Chart on Geographic comparison
        • Exhibit 66: Data Table on Geographic comparison
      • 9.3 North America - Market size and forecast 2023-2028
        • Exhibit 67: Chart on North America - Market size and forecast 2023-2028 ($ million)
        • Exhibit 68: Data Table on North America - Market size and forecast 2023-2028 ($ million)
        • Exhibit 69: Chart on North America - Year-over-year growth 2023-2028 (%)
        • Exhibit 70: Data Table on North America - Year-over-year growth 2023-2028 (%)
      • 9.4 Europe - Market size and forecast 2023-2028
        • Exhibit 71: Chart on Europe - Market size and forecast 2023-2028 ($ million)
        • Exhibit 72: Data Table on Europe - Market size and forecast 2023-2028 ($ million)
        • Exhibit 73: Chart on Europe - Year-over-year growth 2023-2028 (%)
        • Exhibit 74: Data Table on Europe - Year-over-year growth 2023-2028 (%)
      • 9.5 Asia - Market size and forecast 2023-2028
        • Exhibit 75: Chart on Asia - Market size and forecast 2023-2028 ($ million)
        • Exhibit 76: Data Table on Asia - Market size and forecast 2023-2028 ($ million)
        • Exhibit 77: Chart on Asia - Year-over-year growth 2023-2028 (%)
        • Exhibit 78: Data Table on Asia - Year-over-year growth 2023-2028 (%)
      • 9.6 Rest of World (ROW) - Market size and forecast 2023-2028
        • Exhibit 79: Chart on Rest of World (ROW) - Market size and forecast 2023-2028 ($ million)
        • Exhibit 80: Data Table on Rest of World (ROW) - Market size and forecast 2023-2028 ($ million)
        • Exhibit 81: Chart on Rest of World (ROW) - Year-over-year growth 2023-2028 (%)
        • Exhibit 82: Data Table on Rest of World (ROW) - Year-over-year growth 2023-2028 (%)
      • 9.7 US - Market size and forecast 2023-2028
        • Exhibit 83: Chart on US - Market size and forecast 2023-2028 ($ million)
        • Exhibit 84: Data Table on US - Market size and forecast 2023-2028 ($ million)
        • Exhibit 85: Chart on US - Year-over-year growth 2023-2028 (%)
        • Exhibit 86: Data Table on US - Year-over-year growth 2023-2028 (%)
      • 9.8 Germany - Market size and forecast 2023-2028
        • Exhibit 87: Chart on Germany - Market size and forecast 2023-2028 ($ million)
        • Exhibit 88: Data Table on Germany - Market size and forecast 2023-2028 ($ million)
        • Exhibit 89: Chart on Germany - Year-over-year growth 2023-2028 (%)
        • Exhibit 90: Data Table on Germany - Year-over-year growth 2023-2028 (%)
      • 9.9 UK - Market size and forecast 2023-2028
        • Exhibit 91: Chart on UK - Market size and forecast 2023-2028 ($ million)
        • Exhibit 92: Data Table on UK - Market size and forecast 2023-2028 ($ million)
        • Exhibit 93: Chart on UK - Year-over-year growth 2023-2028 (%)
        • Exhibit 94: Data Table on UK - Year-over-year growth 2023-2028 (%)
      • 9.10 France - Market size and forecast 2023-2028
        • Exhibit 95: Chart on France - Market size and forecast 2023-2028 ($ million)
        • Exhibit 96: Data Table on France - Market size and forecast 2023-2028 ($ million)
        • Exhibit 97: Chart on France - Year-over-year growth 2023-2028 (%)
        • Exhibit 98: Data Table on France - Year-over-year growth 2023-2028 (%)
      • 9.11 Canada - Market size and forecast 2023-2028
        • Exhibit 99: Chart on Canada - Market size and forecast 2023-2028 ($ million)
        • Exhibit 100: Data Table on Canada - Market size and forecast 2023-2028 ($ million)
        • Exhibit 101: Chart on Canada - Year-over-year growth 2023-2028 (%)
        • Exhibit 102: Data Table on Canada - Year-over-year growth 2023-2028 (%)
      • 9.12 Market opportunity by geography
        • Exhibit 103: Market opportunity by geography ($ million)
        • Exhibit 104: Data Tables on Market opportunity by geography ($ million)
      • 11.13 APAC - Market size and forecast (2023-2028)
        • Chart on APAC - Market size and forecast (2023-2028) ($ million)
        • Data Table on APAC - Market size and forecast (2023-2028) ($ million)
        • Chart on APAC - Year-over-year growth (2023-2028) (%)
        • Data Table on APAC - Year-over-year growth (2023-2028) (%)
      • 11.14 South America - Market size and forecast (2023-2028)
        • Chart on South America - Market size and forecast (2023-2028) ($ million)
        • Data Table on South America - Market size and forecast (2023-2028) ($ million)
        • Chart on South America - Year-over-year growth (2023-2028) (%)
        • Data Table on South America - Year-over-year growth (2023-2028) (%)
      • 11.15 Middle East and Africa - Market size and forecast (2023-2028)
        • Chart on Middle East and Africa - Market size and forecast (2023-2028) ($ million)
        • Data Table on Middle East and Africa - Market size and forecast (2023-2028) ($ million)
        • Chart on Middle East and Africa - Year-over-year growth (2023-2028) (%)
        • Data Table on Middle East and Africa - Year-over-year growth (2023-2028) (%)
      • 11.16 India - Market size and forecast (2023-2028)
        • Chart on India - Market size and forecast (2023-2028) ($ million)
        • Data Table on India - Market size and forecast (2023-2028) ($ million)
        • Chart on India - Year-over-year growth (2023-2028) (%)
        • Data Table on India - Year-over-year growth (2023-2028) (%)
      • 11.17 Japan - Market size and forecast (2023-2028)
        • Chart on Japan - Market size and forecast (2023-2028) ($ million)
        • Data Table on Japan - Market size and forecast (2023-2028) ($ million)
        • Chart on Japan - Year-over-year growth (2023-2028) (%)
        • Data Table on Japan - Year-over-year growth (2023-2028) (%)
      • 11.18 South Korea - Market size and forecast (2023-2028)
        • Chart on South Korea - Market size and forecast (2023-2028) ($ million)
        • Data Table on South Korea - Market size and forecast (2023-2028) ($ million)
        • Chart on South Korea - Year-over-year growth (2023-2028) (%)
        • Data Table on South Korea - Year-over-year growth (2023-2028) (%)
      • 11.19 Australia - Market size and forecast (2023-2028)
        • Chart on Australia - Market size and forecast (2023-2028) ($ million)
        • Data Table on Australia - Market size and forecast (2023-2028) ($ million)
        • Chart on Australia - Year-over-year growth (2023-2028) (%)
        • Data Table on Australia - Year-over-year growth (2023-2028) (%)
      • 11.20 UAE - Market size and forecast (2023-2028)
        • Chart on UAE - Market size and forecast (2023-2028) ($ million)
        • Data Table on UAE - Market size and forecast (2023-2028) ($ million)
        • Chart on UAE - Year-over-year growth (2023-2028) (%)
        • Data Table on UAE - Year-over-year growth (2023-2028) (%)
      • 11.21 Brazil - Market size and forecast (2023-2028)
        • Chart on Brazil - Market size and forecast (2023-2028) ($ million)
        • Data Table on Brazil - Market size and forecast (2023-2028) ($ million)
        • Chart on Brazil - Year-over-year growth (2023-2028) (%)
        • Data Table on Brazil - Year-over-year growth (2023-2028) (%)

      10 Drivers, Challenges, and Trends

      • 10.1 Market drivers
        • 10.2 Market challenges
          • 10.3 Impact of drivers and challenges
            • Exhibit 105: Impact of drivers and challenges in 2023 and 2028
          • 10.4 Market trends

            11 Vendor Landscape

            • 11.1 Overview
              • 11.2 Vendor landscape
                • Exhibit 106: Overview on Criticality of inputs and Factors of differentiation
              • 11.3 Landscape disruption
                • Exhibit 107: Overview on factors of disruption
              • 11.4 Industry risks
                • Exhibit 108: Impact of key risks on business

              14 Competitive Analysis

              • 14.1 Companies profiled
                • Companies covered
              • 14.2 Market positioning of companies
                • Matrix on companies position and classification
              • 14.3 Nutrigenomix Inc.
                • Nutrigenomix Inc. - Overview
                • Nutrigenomix Inc. - Product / Service
                • Nutrigenomix Inc. - Key offerings
              • 23andMe Inc.
                • 23andMe Inc. - Overview
                • 23andMe Inc. - Product / Service
                • 23andMe Inc. - Key offerings
              • 14.5 DNAfit
                • DNAfit - Overview
                • DNAfit - Product / Service
                • DNAfit - Key offerings
              • 14.6 GX Sciences Inc.
                • GX Sciences Inc. - Overview
                • GX Sciences Inc. - Product / Service
                • GX Sciences Inc. - Key offerings
              • 14.7 Metagenics Inc.
                • Metagenics Inc. - Overview
                • Metagenics Inc. - Product / Service
                • Metagenics Inc. - Key offerings
              • 14.8 Xcode Life
                • Xcode Life - Overview
                • Xcode Life - Product / Service
                • Xcode Life - Key offerings
              • 14.9 Vitagene
                • Vitagene - Overview
                • Vitagene - Product / Service
                • Vitagene - Key offerings
              • 14.10 Mapmygenome
                • Mapmygenome - Overview
                • Mapmygenome - Product / Service
                • Mapmygenome - Key offerings
              • 14.11 Koninklijke DSM N.V.
                • Koninklijke DSM N.V. - Overview
                • Koninklijke DSM N.V. - Product / Service
                • Koninklijke DSM N.V. - Key offerings
              • 14.12 Danone S.A.
                • Danone S.A. - Overview
                • Danone S.A. - Product / Service
                • Danone S.A. - Key offerings
              • 14.13 BASF SE
                • BASF SE - Overview
                • BASF SE - Product / Service
                • BASF SE - Key offerings
              • 14.14 Nestlé Health Science
                GenoPalate Inc.
                • Nestlé Health Science
                  GenoPalate Inc. - Overview
                • Nestlé Health Science
                  GenoPalate Inc. - Product / Service
                • Nestlé Health Science
                  GenoPalate Inc. - Key offerings
              • 14.15 GeneOmbio Technologies
                • GeneOmbio Technologies - Overview
                • GeneOmbio Technologies - Product / Service
                • GeneOmbio Technologies - Key offerings
              • 14.16 Holistic Health International
                • Holistic Health International - Overview
                • Holistic Health International - Product / Service
                • Holistic Health International - Key offerings
              • 14.17 Pathway Genomics
                • Pathway Genomics - Overview
                • Pathway Genomics - Product / Service
                • Pathway Genomics - Key offerings
              • 14.18 Cura Integrative Medicine
                • Cura Integrative Medicine - Overview
                • Cura Integrative Medicine - Product / Service
                • Cura Integrative Medicine - Key offerings
              • 14.19 WellGenix
                • WellGenix - Overview
                • WellGenix - Product / Service
                • WellGenix - Key offerings
              • 14.20 Nutrigenetics Unlimited
                • Nutrigenetics Unlimited - Overview
                • Nutrigenetics Unlimited - Product / Service
                • Nutrigenetics Unlimited - Key offerings
              • 14.21 Interleukin Genetics
                • Interleukin Genetics - Overview
                • Interleukin Genetics - Product / Service
                • Interleukin Genetics - Key offerings
              • 14.22 Nutrigenomix Inc.
                • Nutrigenomix Inc. - Overview
                • Nutrigenomix Inc. - Product / Service
                • Nutrigenomix Inc. - Key offerings
              • 23andMe Inc.
                • 23andMe Inc. - Overview
                • 23andMe Inc. - Product / Service
                • 23andMe Inc. - Key offerings
              • 14.24 DNAfit
                • DNAfit - Overview
                • DNAfit - Product / Service
                • DNAfit - Key offerings
              • 14.25 GX Sciences Inc.
                • GX Sciences Inc. - Overview
                • GX Sciences Inc. - Product / Service
                • GX Sciences Inc. - Key offerings
              • 14.26 Metagenics Inc.
                • Metagenics Inc. - Overview
                • Metagenics Inc. - Product / Service
                • Metagenics Inc. - Key offerings
              • 14.27 Xcode Life
                • Xcode Life - Overview
                • Xcode Life - Product / Service
                • Xcode Life - Key offerings
              • 14.28 Vitagene
                • Vitagene - Overview
                • Vitagene - Product / Service
                • Vitagene - Key offerings
              • 14.29 Mapmygenome
                • Mapmygenome - Overview
                • Mapmygenome - Product / Service
                • Mapmygenome - Key offerings
              • 14.30 Koninklijke DSM N.V.
                • Koninklijke DSM N.V. - Overview
                • Koninklijke DSM N.V. - Product / Service
                • Koninklijke DSM N.V. - Key offerings
              • 14.31 Danone S.A.
                • Danone S.A. - Overview
                • Danone S.A. - Product / Service
                • Danone S.A. - Key offerings
              • 14.32 BASF SE
                • BASF SE - Overview
                • BASF SE - Product / Service
                • BASF SE - Key offerings
              • 14.33 Nestlé Health Science
                GenoPalate Inc.
                • Nestlé Health Science
                  GenoPalate Inc. - Overview
                • Nestlé Health Science
                  GenoPalate Inc. - Product / Service
                • Nestlé Health Science
                  GenoPalate Inc. - Key offerings
              • 14.34 GeneOmbio Technologies
                • GeneOmbio Technologies - Overview
                • GeneOmbio Technologies - Product / Service
                • GeneOmbio Technologies - Key offerings
              • 14.35 Holistic Health International
                • Holistic Health International - Overview
                • Holistic Health International - Product / Service
                • Holistic Health International - Key offerings
              • 14.36 Pathway Genomics
                • Pathway Genomics - Overview
                • Pathway Genomics - Product / Service
                • Pathway Genomics - Key offerings
              • 14.37 Cura Integrative Medicine
                • Cura Integrative Medicine - Overview
                • Cura Integrative Medicine - Product / Service
                • Cura Integrative Medicine - Key offerings
              • 14.38 WellGenix
                • WellGenix - Overview
                • WellGenix - Product / Service
                • WellGenix - Key offerings
              • 14.39 Nutrigenetics Unlimited
                • Nutrigenetics Unlimited - Overview
                • Nutrigenetics Unlimited - Product / Service
                • Nutrigenetics Unlimited - Key offerings
              • 14.40 Interleukin Genetics
                • Interleukin Genetics - Overview
                • Interleukin Genetics - Product / Service
                • Interleukin Genetics - Key offerings

              13 Appendix

              • 13.1 Scope of the report
                • 13.2 Inclusions and exclusions checklist
                  • Exhibit 161: Inclusions checklist
                  • Exhibit 162: Exclusions checklist
                • 13.3 Currency conversion rates for US$
                  • Exhibit 163: Currency conversion rates for US$
                • 13.4 Research methodology
                  • Exhibit 164: Research methodology
                  • Exhibit 165: Validation techniques employed for market sizing
                  • Exhibit 166: Information sources
                • 13.5 List of abbreviations
                  • Exhibit 167: List of abbreviations

                Research Methodology

                Technavio presents a detailed picture of the market by way of study, synthesis, and summation of data from multiple sources. The analysts have presented the various facets of the market with a particular focus on identifying the key industry influencers. The data thus presented is comprehensive, reliable, and the result of extensive research, both primary and secondary.

                INFORMATION SOURCES

                Primary sources

                • Manufacturers and suppliers
                • Channel partners
                • Industry experts
                • Strategic decision makers

                Secondary sources

                • Industry journals and periodicals
                • Government data
                • Financial reports of key industry players
                • Historical data
                • Press releases

                DATA ANALYSIS

                Data Synthesis

                • Collation of data
                • Estimation of key figures
                • Analysis of derived insights

                Data Validation

                • Triangulation with data models
                • Reference against proprietary databases
                • Corroboration with industry experts

                REPORT WRITING

                Qualitative

                • Market drivers
                • Market challenges
                • Market trends
                • Five forces analysis

                Quantitative

                • Market size and forecast
                • Market segmentation
                • Geographical insights
                • Competitive landscape

                Interested in this report?

                Get your sample now to see our research methodology and insights!

                Download Now

                Frequently Asked Questions

                Nutrigenomics market growth will increase by $ 997.73 mn during 2024-2028.

                The Nutrigenomics market is expected to grow at a CAGR of 13.87% during 2024-2028.

                Nutrigenomics market is segmented by Application( Obesity, Cardiovascular diseases, Cancer research, Diabetes, Digestive health) Product( Reagents and kits, Services, Software, Rest of World (ROW))

                Nutrigenomix Inc., 23andMe Inc., DNAfit, GX Sciences Inc., Metagenics Inc., Xcode Life, Vitagene, Mapmygenome, Koninklijke DSM N.V., Danone S.A., BASF SE, Nestlé Health Science GenoPalate Inc., GeneOmbio Technologies, Holistic Health International, Pathway Genomics, Cura Integrative Medicine, WellGenix, Nutrigenetics Unlimited, Interleukin Genetics are a few of the key vendors in the Nutrigenomics market.

                North America will register the highest growth rate of 41% among the other regions. Therefore, the Nutrigenomics market in North America is expected to garner significant business opportunities for the vendors during the forecast period.

                US, Canada, Germany, UK, France, India, Japan, South Korea, Australia, Germany, UAE, Brazil, Rest of World (ROW)

                • Increasing cost of medical treatmentThe increased prevalence of diseases and the rising cost of medical treatment are the major factors leading to the growth of the market. According to the Centers for Disease Control and Prevention (CDC) is the driving factor this market.
                • about 610 is the driving factor this market.
                • 000 people die of heart disease in the US every year. The increasing burden of these diseases has a direct impact on overall healthcare costs is the driving factor this market.
                • as more patients are spending heavily on treatment is the driving factor this market.
                • medicine is the driving factor this market.
                • and hospitals to improve their medical condition. The high cost of branded drugs increases the medical expenditure of patients. Thus is the driving factor this market.
                • many people are opting for dietary supplements and fortified dairy products is the driving factor this market.
                • which contain nutrients is the driving factor this market.
                • such as vitamins is the driving factor this market.
                • proteins is the driving factor this market.
                • carotenoids is the driving factor this market.
                • fibers is the driving factor this market.
                • polyphenols is the driving factor this market.
                • and probiotics is the driving factor this market.
                • based on nutrigenomics. These nutrients help in treating or preventing the occurrence of certain diseases. The high cost of medical treatment is a factor that is compelling for patients to opt for nutrigenomics to treat underlying medical conditions. With nutrigenomics is the driving factor this market.
                • generalized nutrition guidance is given to these individuals. The availability of nutrigenomic technologies to individuals allows them to make better decisions about their nutrition and health. Individuals are increasingly opting for nutrigenomics to control the rising healthcare costs and reduce the increasing burden of diseases and health conditions. There is an increasing need among patients to reduce the high costs associated with frequent hospital visits and treatment is the driving factor this market.
                • particularly among patients who do not have access to advanced healthcare facilities. Thus is the driving factor this market.
                • the demand for nutrigenomics is growing rapidly. This is expected to drive the growth of the global nutrigenomics market during the forecast period. is the driving factor this market.

                The Nutrigenomics market vendors should focus on grabbing business opportunities from the Obesity segment as it accounted for the largest market share in the base year.
                RIA - Research AI Assistant
                Ask RIA