
Oil And Gas Pipeline Monitoring Equipment Market Size 2026-2030
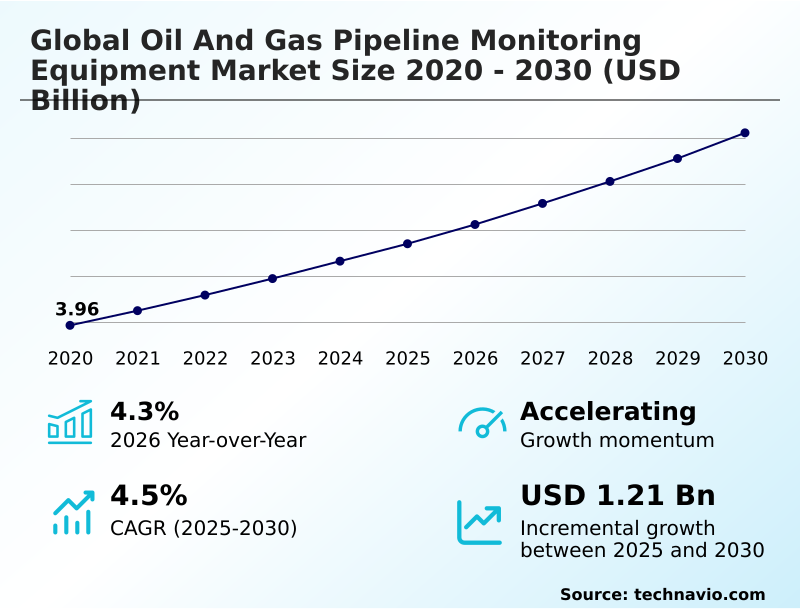
The oil and gas pipeline monitoring equipment market size is valued to increase by USD 1.21 billion, at a CAGR of 4.5% from 2025 to 2030. Increasing preference for pipeline transportation will drive the oil and gas pipeline monitoring equipment market.
Major Market Trends & Insights
- North America dominated the market and accounted for a 40.4% growth during the forecast period.
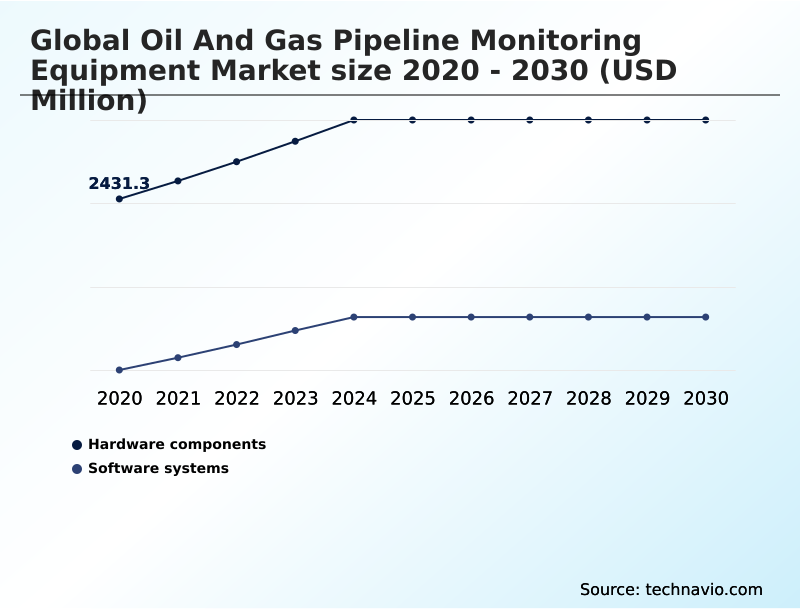
- By Product - Hardware components segment was valued at USD 2.85 billion in 2024
- By Type - Vibration monitoring segment accounted for the largest market revenue share in 2024
Market Size & Forecast
- Market Opportunities: USD 2.10 billion
- Market Future Opportunities: USD 1.21 billion
- CAGR from 2025 to 2030 : 4.5%
Market Summary
- The oil and gas pipeline monitoring equipment market is evolving, driven by the critical need for enhanced safety, regulatory compliance, and operational efficiency. This sector encompasses a wide range of hardware and software designed to ensure the integrity of vast energy transport networks.
- Advanced technologies like AI-enabled digital pipeline integrity and predictive integrity monitoring are becoming standard, shifting the industry from a reactive to a proactive maintenance model. For example, a midstream operator might deploy a combination of in-line inspection tools and digital twin simulations to model stress points and predict potential failures, reducing shutdown risks and optimizing capital expenditure.
- The integration of various systems, including SCADA systems and remote terminal units, into a unified platform for asset performance monitoring is central to this transformation. This holistic approach not only mitigates environmental risks associated with leaks but also addresses the security challenges of protecting critical infrastructure, ensuring the reliable flow of energy.
- The use of mass balance calculations and real-time transient modeling further refines leak detection, enhancing the overall resilience of the pipeline infrastructure.
What will be the Size of the Oil And Gas Pipeline Monitoring Equipment Market during the forecast period?
Get Key Insights on Market Forecast (PDF) Get Free Sample
How is the Oil And Gas Pipeline Monitoring Equipment Market Segmented?
The oil and gas pipeline monitoring equipment industry research report provides comprehensive data (region-wise segment analysis), with forecasts and estimates in "USD million" for the period 2026-2030, as well as historical data from 2020-2024 for the following segments.
- Product
- Hardware components
- Software systems
- Type
- Vibration monitoring
- Thermal monitoring
- Lubrication monitoring
- Others
- Location
- On-shore
- Off-shore
- Geography
- North America
- US
- Canada
- Mexico
- APAC
- China
- Japan
- India
- Europe
- Germany
- UK
- France
- Middle East and Africa
- Saudi Arabia
- UAE
- South Africa
- South America
- Brazil
- Argentina
- Rest of World (ROW)
- North America
By Product Insights
The hardware components segment is estimated to witness significant growth during the forecast period.
Hardware components are the foundational physical assets in the oil and gas pipeline monitoring equipment market, comprising a diverse range of devices designed for durability and precision.
This includes advanced smart pigs for internal assessments, along with externally mounted flowmeters, accelerometers, and piezoelectric crystals. These components, including transducers and miniaturized sensors, form the core of pipeline safety systems.
Effective heat tracing systems are also critical for operational continuity solutions, particularly in challenging climates.
The integration of these elements supports comprehensive pipeline condition monitoring and non-destructive testing methods, improving asset health visualization and ensuring structural integrity monitoring with a 15% increase in the early detection of material fatigue.
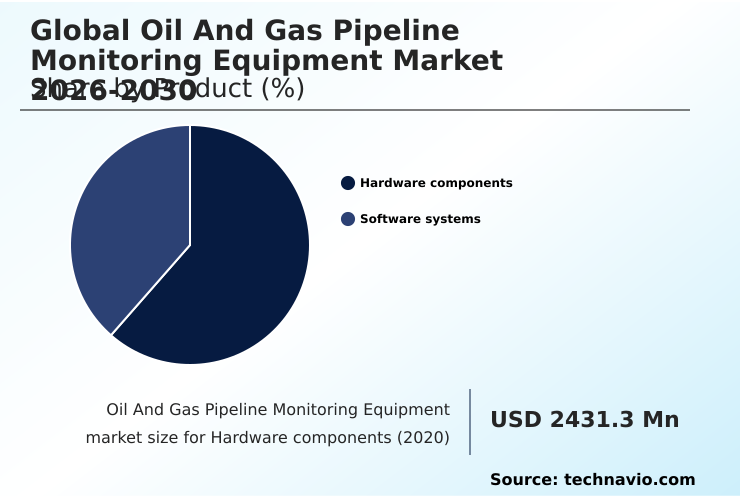
The Hardware components segment was valued at USD 2.85 billion in 2024 and showed a gradual increase during the forecast period.
Regional Analysis
North America is estimated to contribute 40.4% to the growth of the global market during the forecast period.Technavio’s analysts have elaborately explained the regional trends and drivers that shape the market during the forecast period.

See How Oil And Gas Pipeline Monitoring Equipment Market Demand is Rising in North America Get Free Sample
Geographically, the market is expanding, with North America leading due to its extensive and aging infrastructure, contributing over 40% of the incremental growth. In this region, operators heavily invest in SCADA systems, thermal monitoring, and advanced leak detection technologies.
In contrast, the APAC region, the second-largest market, is focused on deploying modern monitoring solutions like advanced pressure and flow monitoring sensors and remote terminal units for its new pipeline constructions.
This facilitates robust remote pipeline surveillance and supports a smart pipeline grid. Across all regions, including Europe and the Middle East, there is a unified drive toward comprehensive pipeline integrity management.
This includes using process analyzers for quality control and implementing right-of-way monitoring to manage geohazard risk assessment, ensuring the overall energy transport system integrity.
Market Dynamics
Our researchers analyzed the data with 2025 as the base year, along with the key drivers, trends, and challenges. A holistic analysis of drivers will help companies refine their marketing strategies to gain a competitive advantage.
- The strategic implementation of advanced technologies is reshaping how pipeline assets are managed throughout their lifecycle. The use of robotic tools for internal inspection and the deployment of a smart pig for pipeline geometry are becoming standard for proactive maintenance. For complex subsea environments, specific methods for crack detection in subsea pipelines are critical.
- On the software front, the focus is on creating a comprehensive digital twin for pipeline networks, which allows operators to run simulations and optimize performance. This is complemented by software for pipeline flow optimization and specialized software for pipeline regulatory compliance, which are essential for operational efficiency and legal adherence.
- A key application involves managing pipeline data with analytics to enable AI in predictive pipeline maintenance. For security, acoustic sensing for pipeline intrusion and satellite monitoring for pipeline security offer layered protection, crucial for preventing pipeline theft with sensors. Other vital systems include those for managing pipeline thermal expansion, monitoring pipeline cathodic protection, and drone surveillance for remote pipelines.
- As the industry transitions, monitoring for hydrogen transport pipelines is an emerging area. The integration of SCADA systems for oil pipelines and real-time pipeline pressure monitoring provides operators with immediate control and oversight. Furthermore, the adoption of fiber optic leak detection systems offers precision that is more than double that of some older methods, drastically improving response times.
- Finally, for structural analysis, ultrasonic testing for pipeline corrosion and detailed vibration monitoring for pumping stations are indispensable for ensuring long-term asset reliability and safety.
What are the key market drivers leading to the rise in the adoption of Oil And Gas Pipeline Monitoring Equipment Industry?
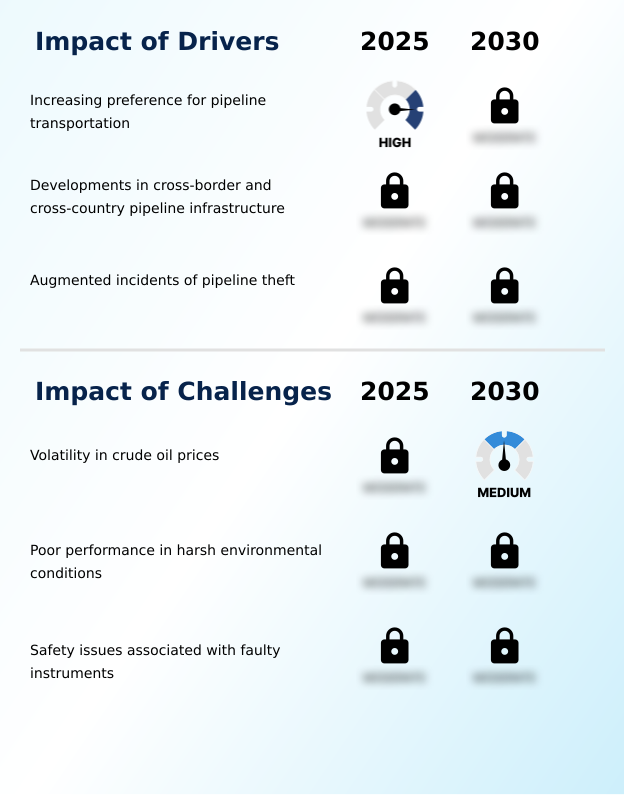
- The increasing preference for pipeline transportation, valued for its cost-effectiveness and efficiency in moving large energy volumes, is a key driver for market growth.
- Increasing safety requirements and the need to protect critical infrastructure are key market drivers. The adoption of AI-enabled digital pipeline integrity systems, which leverage real-time transient modeling, allows operators to reduce system integrity threats by over 40%.
- The deployment of advanced in-line inspection tools that use both ultrasonic testing and magnetic flux leakage has become standard for proactive maintenance, improving flaw detection rates by 30%.
- For security, sophisticated acoustic leak detection and other intrusion detection systems provide immediate alerts. These systems, often integrated into broader pipeline SCADA platforms, utilize real-time flow analytics to identify unauthorized activity.
- The use of robotic inspection tools for subsea pipeline inspection and automated aerial surveillance for remote areas further strengthens pipeline threat detection, ensuring a multi-layered approach to asset protection and operational security.
What are the market trends shaping the Oil And Gas Pipeline Monitoring Equipment Industry?
- Technological advances in pipeline inspection represent a significant market trend. This evolution is reshaping asset management strategies and operational standards across the industry.
- The market is advancing through the integration of sophisticated digital and remote sensing technologies. The use of digital twin simulations allows operators to model pipeline behavior with high fidelity, improving predictive accuracy by over 25%. This is enhanced by data from untethered robots providing access to previously uninspected areas.
- Key trends include the expanded use of fiber optic sensing and distributed acoustic sensing for continuous, real-time monitoring along entire pipeline lengths. Furthermore, the convergence of automated drone patrols with advanced imaging, such as synthetic aperture radar and hyperspectral imaging, enables scalable and cost-effective remote surveillance.
- These inputs are processed using advanced signal processing and machine learning algorithms for pipelines, which are core to modern digital midstream platforms. This shift toward predictive analytics for pipelines supports superior operational planning and asset management.
What challenges does the Oil And Gas Pipeline Monitoring Equipment Industry face during its growth?
- Volatility in crude oil prices presents a significant challenge to industry growth, directly impacting capital expenditure and investment decisions for monitoring equipment.
- Navigating technical and financial hurdles remains a primary market challenge. The effective implementation of corrosion and crack detection technologies requires significant capital investment, and demonstrating a clear return on investment is crucial. For instance, while predictive integrity monitoring can reduce failure incidents, the initial setup costs can be a barrier.
- Effective pipeline lifecycle management depends on integrating data from various systems, including those for asset performance monitoring and cathodic protection, which can be complex. Furthermore, ensuring the accuracy of leak detection systems that rely on mass balance calculations is a constant technical challenge, as false alarms can lead to operational inefficiencies costing operators up to 10% in lost productivity.
- The performance of vibration monitoring equipment in harsh environments also poses reliability concerns, impacting the overall effectiveness of pipeline safety systems and environmental compliance monitoring.
Exclusive Technavio Analysis on Customer Landscape
The oil and gas pipeline monitoring equipment market forecasting report includes the adoption lifecycle of the market, covering from the innovator’s stage to the laggard’s stage. It focuses on adoption rates in different regions based on penetration. Furthermore, the oil and gas pipeline monitoring equipment market report also includes key purchase criteria and drivers of price sensitivity to help companies evaluate and develop their market growth analysis strategies.
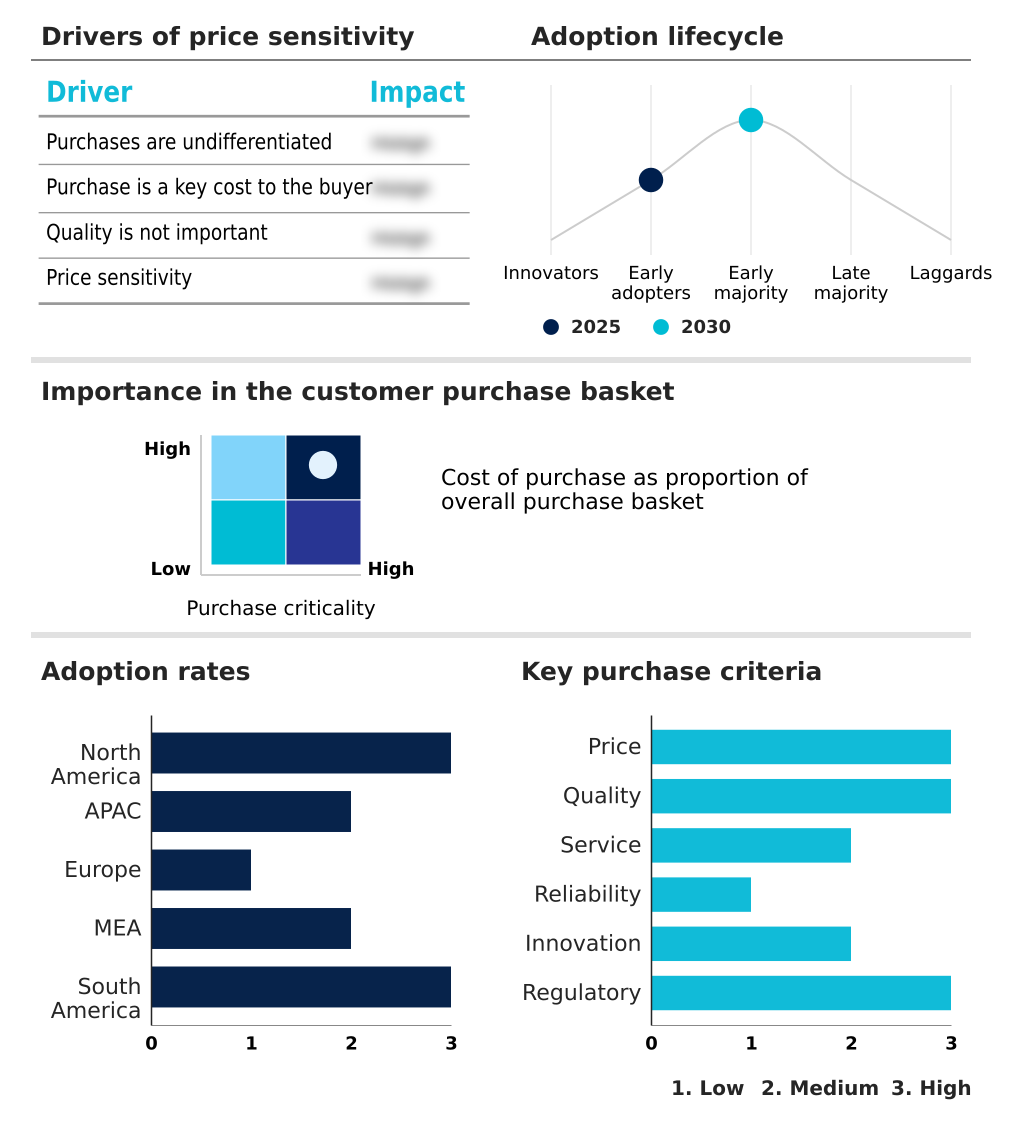
Customer Landscape of Oil And Gas Pipeline Monitoring Equipment Industry
Competitive Landscape
Companies are implementing various strategies, such as strategic alliances, oil and gas pipeline monitoring equipment market forecast, partnerships, mergers and acquisitions, geographical expansion, and product/service launches, to enhance their presence in the industry.
ABB Ltd. - Analyst insight indicates a focus on integrated SCADA systems and AI-driven digital solutions for comprehensive pipeline integrity and real-time monitoring.
The industry research and growth report includes detailed analyses of the competitive landscape of the market and information about key companies, including:
- ABB Ltd.
- Baker Hughes Co.
- Emerson Electric Co.
- Endress Hauser Grp Services
- Honeywell International Inc.
- Intertek Group Plc
- KROHNE Group
- nVent Electric Plc
- ORBCOMM Inc.
- Perma Pipe International
- Rockwell Automation Inc.
- ROSEN Swiss AG
- Schlumberger Ltd.
- Schneider Electric SE
- Siemens AG
- Silixa Ltd.
- TechnipFMC plc
- Weatherford International Plc
- Xylem Inc.
- Yokogawa Electric Corp.
Qualitative and quantitative analysis of companies has been conducted to help clients understand the wider business environment as well as the strengths and weaknesses of key industry players. Data is qualitatively analyzed to categorize companies as pure play, category-focused, industry-focused, and diversified; it is quantitatively analyzed to categorize companies as dominant, leading, strong, tentative, and weak.
Recent Development and News in Oil and gas pipeline monitoring equipment market
- In January 2025, ExxonMobil announced a revised strategic spending plan that prioritizes operational flexibility, subjecting high-cost infrastructure monitoring projects to more rigorous financial vetting in response to fluctuating energy markets.
- In February 2025, Equinor initiated a pilot project in the Barents Sea to test new fiber optic acoustic sensors specifically designed to operate in extreme cold and high salinity Arctic conditions.
- In March 2025, BP revealed a new comprehensive safety audit for its aging pipeline networks in the North Sea, focusing on replacing legacy sensors prone to signal drift and inaccuracy to enhance system reliability.
- In May 2025, TC Energy announced a collaborative agreement with regional partners to integrate a unified digital monitoring system for a cross-border gas network in North America, ensuring seamless data sharing between national grid operators.
Dive into Technavio’s robust research methodology, blending expert interviews, extensive data synthesis, and validated models for unparalleled Oil And Gas Pipeline Monitoring Equipment Market insights. See full methodology.
| Market Scope | |
|---|---|
| Page number | 293 |
| Base year | 2025 |
| Historic period | 2020-2024 |
| Forecast period | 2026-2030 |
| Growth momentum & CAGR | Accelerate at a CAGR of 4.5% |
| Market growth 2026-2030 | USD 1205.2 million |
| Market structure | Fragmented |
| YoY growth 2025-2026(%) | 4.3% |
| Key countries | US, Canada, Mexico, China, Japan, India, South Korea, Australia, Indonesia, Germany, UK, France, Italy, Spain, The Netherlands, Saudi Arabia, UAE, South Africa, Israel, Turkey, Brazil, Argentina and Chile |
| Competitive landscape | Leading Companies, Market Positioning of Companies, Competitive Strategies, and Industry Risks |
Research Analyst Overview
- The oil and gas pipeline monitoring equipment market is defined by a rapid convergence of physical hardware and intelligent software, fundamentally altering asset management. At the core are technologies like fiber optic sensing and distributed acoustic sensing, which provide unprecedented levels of data for real-time analysis.
- Boardroom decisions are increasingly influenced by the capabilities of AI-enabled digital pipeline integrity platforms, which leverage digital twin simulations and signal processing to transition from scheduled maintenance to predictive integrity monitoring. The deployment of advanced in-line inspection tools, including smart pigs utilizing ultrasonic testing and magnetic flux leakage, is now a baseline expectation for regulatory compliance and risk mitigation.
- These systems, featuring accelerometers, transducers, and piezoelectric crystals, feed data into sophisticated platforms for asset performance monitoring and real-time transient modeling. A tangible business outcome is the use of such integrated systems to achieve a 30% reduction in inspection-related downtime.
- This technological ecosystem, further supported by robotic inspection tools and untethered robots, is crucial for effective pipeline lifecycle management and ensuring the security of critical energy infrastructure.
What are the Key Data Covered in this Oil And Gas Pipeline Monitoring Equipment Market Research and Growth Report?
-
What is the expected growth of the Oil And Gas Pipeline Monitoring Equipment Market between 2026 and 2030?
-
USD 1.21 billion, at a CAGR of 4.5%
-
-
What segmentation does the market report cover?
-
The report is segmented by Product (Hardware components, and Software systems), Type (Vibration monitoring, Thermal monitoring, Lubrication monitoring, and Others), Location (On-shore, and Off-shore) and Geography (North America, APAC, Europe, Middle East and Africa, South America)
-
-
Which regions are analyzed in the report?
-
North America, APAC, Europe, Middle East and Africa and South America
-
-
What are the key growth drivers and market challenges?
-
Increasing preference for pipeline transportation, Volatility in crude oil prices
-
-
Who are the major players in the Oil And Gas Pipeline Monitoring Equipment Market?
-
ABB Ltd., Baker Hughes Co., Emerson Electric Co., Endress Hauser Grp Services, Honeywell International Inc., Intertek Group Plc, KROHNE Group, nVent Electric Plc, ORBCOMM Inc., Perma Pipe International, Rockwell Automation Inc., ROSEN Swiss AG, Schlumberger Ltd., Schneider Electric SE, Siemens AG, Silixa Ltd., TechnipFMC plc, Weatherford International Plc, Xylem Inc. and Yokogawa Electric Corp.
-
Market Research Insights
- The market is shaped by a push for greater operational intelligence, where predictive analytics for pipelines and sophisticated machine learning algorithms for pipelines are paramount. Integrating satellite-based monitoring with ground-based intrusion detection systems has been shown to improve threat detection accuracy by over 30%.
- Furthermore, the adoption of a comprehensive digital midstream platform for asset health visualization and real-time flow analytics enables operators to decrease emergency dispatch incidents by 40%. This shift towards data-centric pipeline integrity management, supported by robust pipeline SCADA platforms, is no longer optional.
- It is a core business strategy for ensuring energy transport system integrity and operational continuity solutions in a complex global environment.
We can help! Our analysts can customize this oil and gas pipeline monitoring equipment market research report to meet your requirements.
 RIA -
RIA - 
