
Oil Country Tubular Goods Market Size 2025-2029
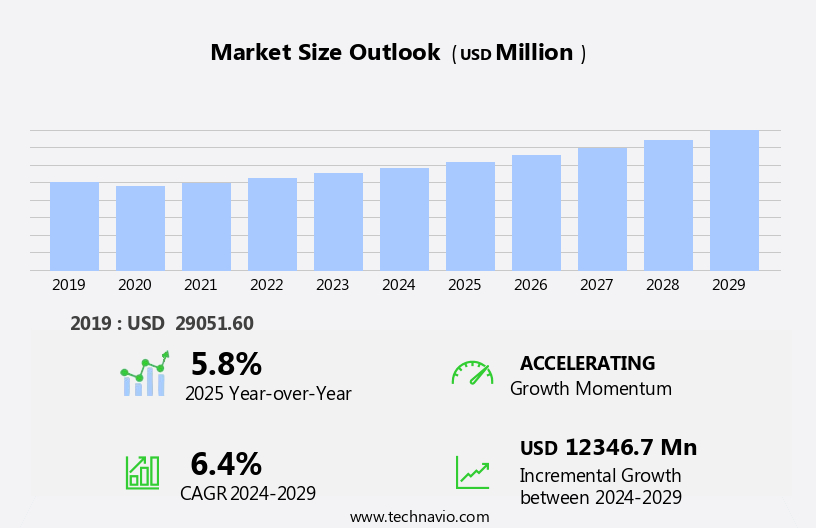
The oil country tubular goods (OCTG) market size is forecast to increase by USD 12.35 billion at a CAGR of 6.4% between 2024 and 2029.
- The market is experiencing significant growth driven by increasing investments in upstream activities, particularly in deep-water and ultra-deep-water exploration and production. This trend is expected to continue as companies seek to expand their reserves and meet rising energy demand. However, the market is not without challenges. Environmental concerns related to drilling are becoming increasingly prominent, with stricter regulations and growing public pressure. As a result, OCTG manufacturers must adapt to meet evolving sustainability standards and reduce their carbon footprint. Additionally, price volatility in raw materials and geopolitical risks can impact market dynamics.
- The OCTG market is also witnessing the integration of emerging technologies like blockchain technology, advanced manufacturing techniques, and additive manufacturing to enhance data security and optimize production processes. Companies seeking to capitalize on this market's opportunities must stay informed of regulatory developments, invest in research and development to improve product sustainability, and build resilient supply chains to navigate price fluctuations and geopolitical risks. By doing so, they can effectively navigate the complexities of the OCTG market and position themselves for long-term success.
What will be the Size of the Oil Country Tubular Goods (OCTG) Market during the forecast period?
- The market in the United States experiences significant activity due to the ongoing demand for tubing and related products in the oil and gas industry. Factors driving market growth include the increasing adoption of hydraulic fracturing and other advanced drilling techniques, the need for corrosion prevention and flow assurance, and the integration of digital technologies such as simulation software, artificial intelligence, and digital twins. High-performance tubing, lightweight materials, and premium OCTG are gaining popularity due to their ability to enhance production efficiency and reduce operational costs.
- Technological advancements in areas like automated welding, laser cutting, and materials science continue to shape the market. Additionally, the use of specialty tubular goods, such as those with ceramic and thermal spray coatings, is on the rise for their ability to improve pipeline integrity and reduce downtime. Overall, the market is expected to continue growing, driven by the increasing demand for oil and gas and the continuous innovation in tubing technologies.
How is this Oil Country Tubular Goods (OCTG) Industry segmented?
The oil country tubular goods (OCTG) industry research report provides comprehensive data (region-wise segment analysis), with forecasts and estimates in "USD million" for the period 2025-2029, as well as historical data from 2019-2023 for the following segments.
- Product
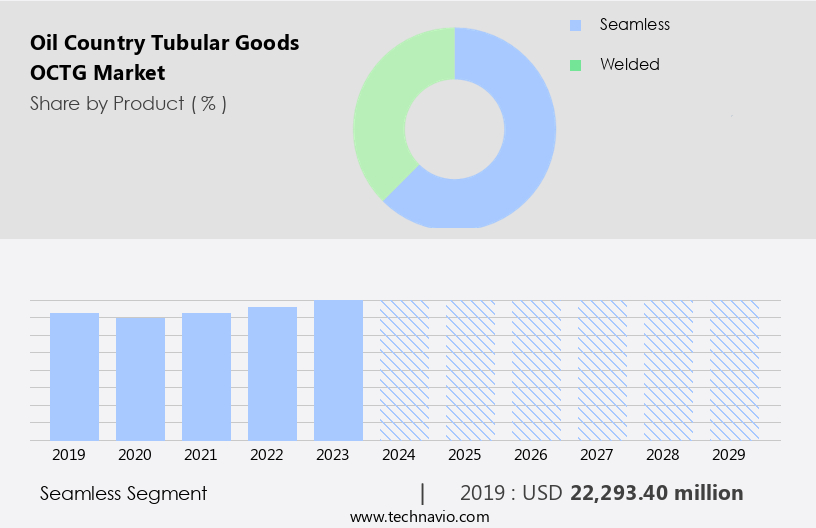
- Seamless
- Welded
- Application
- Onshore
- Offshore
- Type
- Well casing
- Production tubing
- Drill pipe
- Others
- Grade Type
- API grade
- Premium grade
- Geography
- North America
- US
- Canada
- APAC
- China
- India
- Japan
- South Korea
- Europe
- Germany
- UK
- South America
- Brazil
- Middle East and Africa
- North America
By Product Insights
The seamless segment is estimated to witness significant growth during the forecast period. Seamless tubular goods, specifically drill pipes, represent a significant segment in the oil and gas industry. Produced in pipe mills using specialized processes, seamless OCTG are manufactured from solid cylindrical steel billets, which are then rolled and stretched to meet customer specifications. The superior mechanical properties of seamless OCTG, including high tensile and yield strength, make them ideal for high-pressure drilling environments. The absence of welded seams in seamless OCTG eliminates potential leakage sources, ensuring greater reliability. Additionally, the accurate calculation of pipe pressure is facilitated by the seamless design. Advanced technologies, such as Artificial Intelligence (AI), Digital Transformation, and Non-Destructive Testing (NDT), are increasingly being integrated into the production process to enhance quality control, production optimization, and well life extension.
Seamless OCTG finds extensive applications in various drilling operations, including subsea production, directional drilling, and deepwater drilling. Downhole tools, wellhead equipment, and casing strings are essential components where high-strength alloys and premium connections are crucial. Enhanced oil recovery techniques, such as Carbon Capture and high-pressure/high-temperature (HPHT) drilling, require the use of OCTG with enhanced corrosion resistance and burst strength. Supply chain management, inventory optimization, and distribution networks are essential aspects of the OCTG market. The integration of technologies like Cloud Computing, Data Analytics, and Remote Monitoring enables real-time monitoring and optimization of drilling operations, ensuring efficient and cost-effective production. Additionally, the adoption of green technology in the oil and gas industry is driving the demand for OCTG with enhanced environmental performance.
The seamless OCTG market is driven by the increasing demand for reliable and high-performance tubular goods in the oil and gas industry. The integration of advanced technologies and the focus on sustainability are key trends shaping the market's growth.
Get a glance at the market report of share of various segments Request Free Sample
The Seamless segment was valued at USD 22.29 billion in 2019 and showed a gradual increase during the forecast period.
Regional Analysis
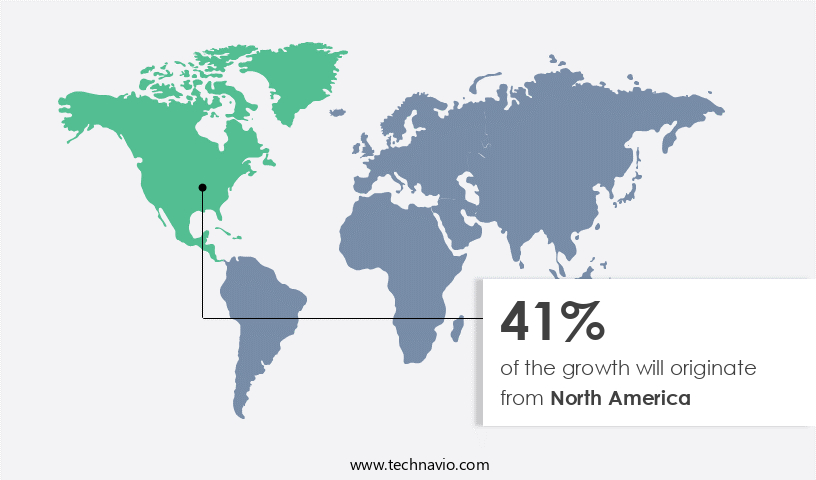
North America is estimated to contribute 41% to the growth of the global market during the forecast period. Technavio's analysts have elaborately explained the regional trends and drivers that shape the market during the forecast period.
For more insights on the market size of various regions, Request Free Sample
The market in North America is significant, with the US and Canada being the major contributors. The US, as one of the largest crude oil producers, witnesses increased oil and gas production due to unconventional exploration and production activities. These include drilling in shale reserves and oil sands. The OCTG market in North America is driven by the high demand for Drill Pipe, Line Pipe, and Wellhead Equipment in various drilling operations. Advancements in technology are transforming the OCTG industry. Digital Transformation is being embraced, with Artificial Intelligence (AI) and Data Analytics used for Production Optimization and Quality Control. Non-Destructive Testing (NDT) techniques like Fatigue Testing and Hydrostatic Testing ensure Wellbore Integrity and enhance the overall performance of OCTG. The industry continues to innovate, with ongoing research in Corrosion Resistance, Drilling Fluids, and Stress Analysis.
Market Dynamics
Our researchers analyzed the data with 2024 as the base year, along with the key drivers, trends, and challenges. A holistic analysis of drivers will help companies refine their marketing strategies to gain a competitive advantage.
What are the key market drivers leading to the rise in the adoption of Oil Country Tubular Goods (OCTG) Industry?
- Increasing investments in upstream activities are the key drivers of the market. The market is experiencing growth due to the increasing investments in the upstream oil and gas sector. With population and industrial development on the rise, securing energy resources has become a priority for many countries. To meet this demand, operators are exploring untapped oil and gas resources using advanced technologies, leading to an increase in exploration and production activities. These activities stimulate the use of OCTG products, such as drill pipes, casing, and tubing, in drilling and completion processes. As conventional oilfields reach production decline, operators are investing in mature fields to maximize revenue. This trend is expected to drive the growth of the global OCTG market during the forecast period.
- The upstream oil and gas sector's expansion is a significant market dynamic, as it increases the demand for OCTG products in the drilling and completion process. This investment in mature oilfields is a strategic move to maintain energy security and ensure continued production. The global OCTG market is poised for growth as a result of these market drivers.
What are the market trends shaping the Oil Country Tubular Goods (OCTG) Industry?
- A rise in deep-water and ultra-deep-water exploration and production activities is the upcoming market trend. Offshore Exploration and Production (OE&P) in the oil and gas industry has evolved significantly over the years, with companies shifting their focus from shallow waters to deeper, harder-to-reach resources in response to depleting reserves in easily accessible onshore locations. This transition presents unique challenges, as offshore drilling operates in harsher environments compared to onshore drilling.
- However, the increasing cost of hydrocarbon acquisition necessitates the exploration of these lesser-explored areas. The shift towards deepwater and ultra-deepwater resources has led to advancements in technology and innovation, enabling companies to extract oil and gas from increasingly challenging conditions. Despite these challenges, the potential rewards are substantial, with large untapped reserves waiting to be discovered. As the industry continues to adapt to changing market conditions, OE&P companies will need to remain agile and innovative to stay competitive.
What challenges does the Oil Country Tubular Goods (OCTG) Industry face during its growth?
- Environmental concerns related to drilling are a key challenge affecting the industry's growth. The oil and gas industry plays a significant role in powering various sectors, including transportation, heating, and manufacturing. However, the exploration and production activities associated with this industry have detrimental effects on the environment. Oil spills, air and water pollution from toxic chemical emissions, and climate change due to methane emissions are some of the environmental concerns arising from oil and gas production. In the deepwater drilling process, drilling fluids are utilized to cool and lubricate drill bits and pipes. These fluids, upon release into the water, can harm marine life due to the toxic chemicals they contain.
- The environmental impact of the oil and gas industry necessitates ongoing research and the development of eco-friendly alternatives to mitigate the damage caused by these activities. The industry's market dynamics are influenced by various factors, including regulatory policies, technological advancements, and consumer preferences. As an assistant, I am committed to providing accurate and up-to-date information on this critical topic.
Exclusive Customer Landscape
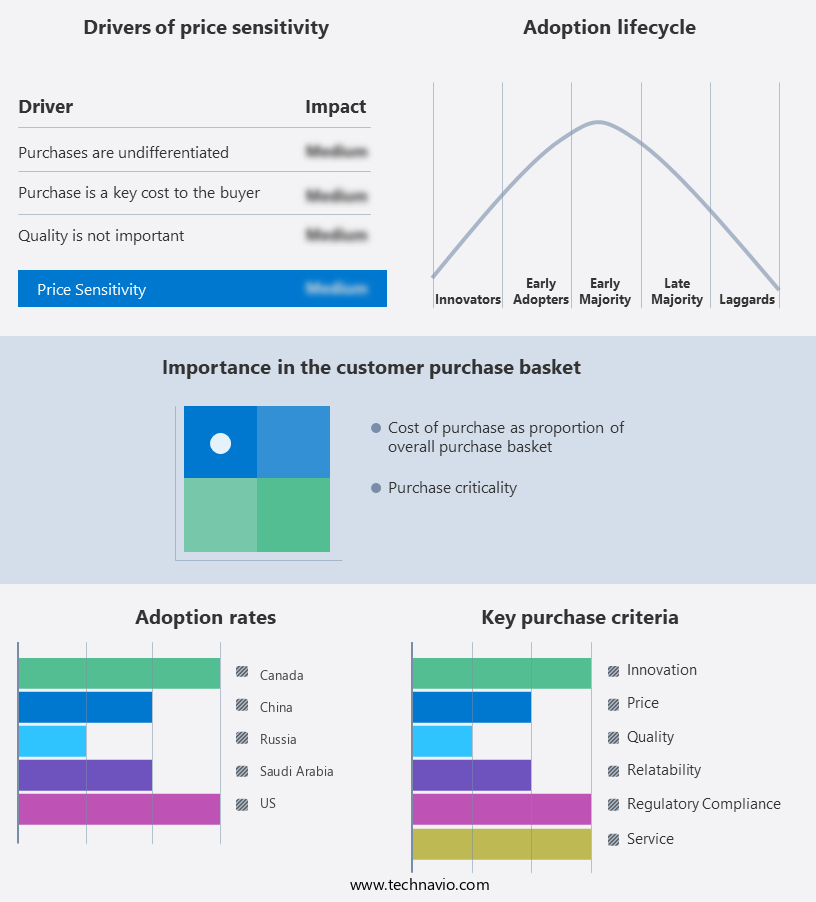
The oil country tubular goods (OCTG) market forecasting report includes the adoption lifecycle of the market, covering from the innovator's stage to the laggard's stage. It focuses on adoption rates in different regions based on penetration. Furthermore, the oil country tubular goods (OCTG) market report also includes key purchase criteria and drivers of price sensitivity to help companies evaluate and develop their market growth analysis strategies.
Customer Landscape
Key Companies & Market Insights
Companies are implementing various strategies, such as strategic alliances, oil country tubular goods (OCTG) market forecast, partnerships, mergers and acquisitions, geographical expansion, and product/service launches, to enhance their presence in the industry.
ArcelorMittal - The company offers OCTG such as Seamless OCTG casing and tubing, Jubail OCTG, Roman OCTG.
The industry research and growth report includes detailed analyses of the competitive landscape of the market and information about key companies, including:
- ArcelorMittal
- EVRAZ Plc
- Hunting Plc
- Iljin Co. Ltd.
- JFE Holdings Inc.
- Jindal SAW Ltd.
- Nippon Steel Corp.
- SB International Inc.
- Tenaris SA
- Tenergy Equipment and Service Ltd.
- TMK
- Trident Steel Corp.
- UMW HOLDINGS BERHAD
- United States Steel Corp.
- US Steel Tubular Products Inc.
- Vallourec SA
- voestalpine AG
- Zekelman Industries
Qualitative and quantitative analysis of companies has been conducted to help clients understand the wider business environment as well as the strengths and weaknesses of key industry players. Data is qualitatively analyzed to categorize companies as pure play, category-focused, industry-focused, and diversified; it is quantitatively analyzed to categorize companies as dominant, leading, strong, tentative, and weak.
Research Analyst Overview
The market encompasses a diverse range of products essential to the exploration and production (E&P) industry. These products include but are not limited to, drill pipe, line pipe, and wellhead equipment. The market is characterized by continuous innovation and advancements in technology, driven by the evolving needs of E&P companies. One significant trend shaping the OCTG market is the integration of Artificial Intelligence (AI) and Digital Transformation. AI is being employed in various applications, such as Non-Destructive Testing (NDT) and production optimization. NDT, a critical process in ensuring wellbore integrity, is being enhanced through AI-powered predictive maintenance, enabling early detection of potential issues and reducing downtime.
Similarly, AI is being utilized to optimize drilling operations by analyzing real-time data and providing recommendations to improve efficiency. Another area of focus is the application of advanced technologies in subsea production. Digital transformation is facilitating the deployment of cloud computing and data analytics to optimize production from subsea wells. This includes the use of remote monitoring systems for real-time data collection and analysis, enabling timely interventions and reducing operational costs. Quality control remains a top priority in the OCTG market. Advanced testing methods, such as fatigue testing and stress analysis, are being employed to ensure the highest standards of product integrity.
These tests help assess the tensile and yield strength of tubular goods, ensuring they can withstand the extreme conditions encountered in drilling and production operations. Inventory optimization is another critical aspect of the OCTG market. With the volatility in oil prices and the need for operational efficiency, service providers are leveraging advanced technologies to optimize their inventory management. This includes the use of AI-powered forecasting tools to predict demand and optimize stock levels, reducing the need for excessive inventory and associated costs. The OCTG market is also witnessing significant advancements in materials science. High-strength alloys, carbon capture technologies, and green technology are some of the areas where innovation is driving growth.
The Oil Country Tubular Goods (OCTG) Market supports critical operations like our gas service, ensuring efficiency in energy exploration. Technologies such as coiled tubing and cementing services play a pivotal role in well construction and maintenance. Advances in well stimulation and reservoir stimulation enhance recovery rates. Solutions like gas lift and artificial lift optimize production, while downhole monitoring and production logging improve operational accuracy. Emphasis on pipeline inspection and corrosion mitigation ensures longevity and safety of infrastructure. Innovations like 3D printing are revolutionizing the manufacturing and customization of OCTG, catering to specific industry needs. These developments reflect a commitment to innovation and efficiency, shaping the future of the OCTG market in a competitive energy sector.
For instance, high-strength alloys are being used to manufacture casing strings and tubing strings that can withstand high-pressure/high-temperature (HPHT) conditions. Carbon capture technologies are being employed to reduce the carbon footprint of the E&P industry, while green technology is being used to develop sustainable alternatives to traditional drilling fluids. The OCTG market is a complex ecosystem, with various stakeholders, including rig operators, oilfield services companies, and distribution networks, all playing critical roles. Collaboration and partnerships are essential to ensure the efficient and effective delivery of tubular goods from the pipe mill to the wellsite. The OCTG market is a dynamic and evolving landscape, driven by technological advancements, operational efficiency, and sustainability.
|
Market Scope |
|
|
Report Coverage |
Details |
|
Page number |
229 |
|
Base year |
2024 |
|
Historic period |
2019-2023 |
|
Forecast period |
2025-2029 |
|
Growth momentum & CAGR |
Accelerate at a CAGR of 6.4% |
|
Market growth 2025-2029 |
USD 12.35 billion |
|
Market structure |
Fragmented |
|
YoY growth 2024-2025(%) |
5.8 |
|
Key countries |
US, China, Canada, Japan, Germany, India, UK, South Korea, Brazil, and Saudi Arabia |
|
Competitive landscape |
Leading Companies, Market Positioning of Companies, Competitive Strategies, and Industry Risks |
What are the Key Data Covered in this Oil Country Tubular Goods (OCTG) Market Research and Growth Report?
- CAGR of the Oil Country Tubular Goods (OCTG) industry during the forecast period
- Detailed information on factors that will drive the growth and forecasting between 2025 and 2029
- Precise estimation of the size of the market and its contribution of the industry in focus to the parent market
- Accurate predictions about upcoming growth and trends and changes in consumer behaviour
- Growth of the market across North America, APAC, Europe, South America, and Middle East and Africa
- Thorough analysis of the market's competitive landscape and detailed information about companies
- Comprehensive analysis of factors that will challenge the oil country tubular goods (OCTG) market growth and forecasting
We can help! Our analysts can customize this oil country tubular goods (OCTG) market research report to meet your requirements.
 RIA -
RIA - 
