
Predictive AI In Stock Market Size 2025-2029
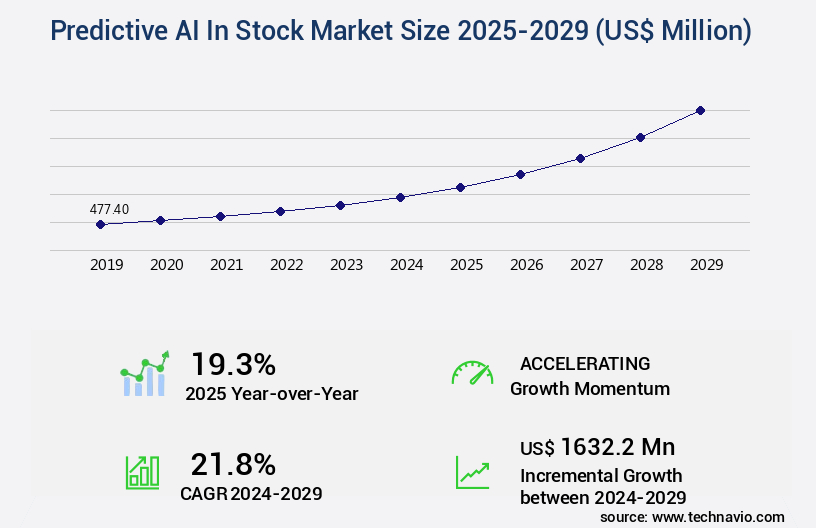
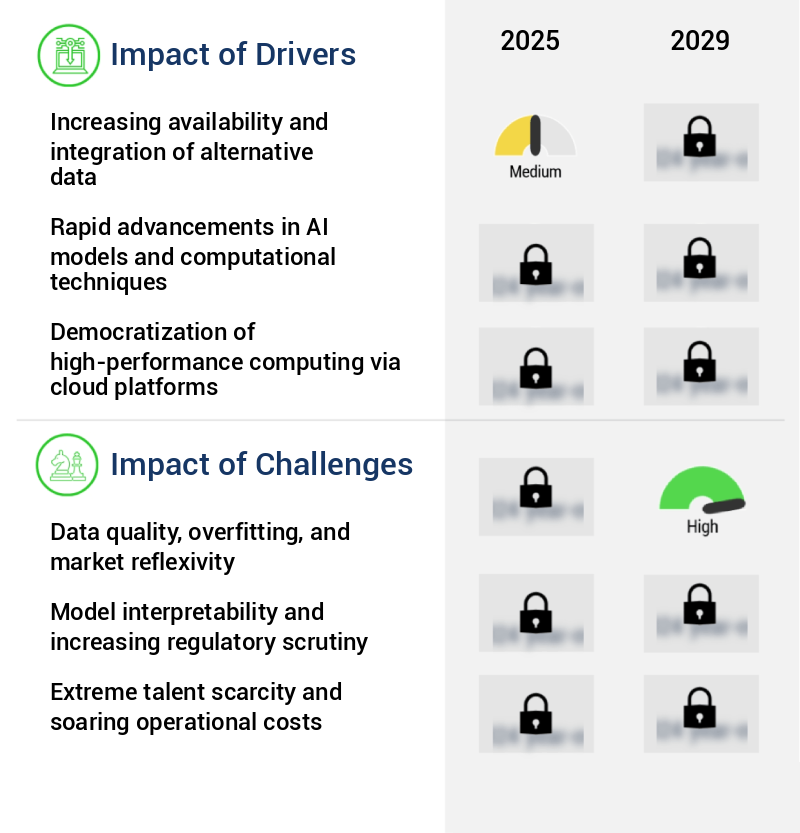
The predictive AI in stock market size is valued to increase by USD 1.63 billion, at a CAGR of 21.8% from 2024 to 2029. Increasing availability and integration of alternative data will drive the predictive AI in stock market.
Market Insights
- North America dominated the market and accounted for a 33% growth during the 2025-2029.
- By Component - Solution segment was valued at USD 329.80 billion in 2023
- By Application - Algorithmic trading segment accounted for the largest market revenue share in 2023
Market Size & Forecast
- Market Opportunities: USD 445.64 million
- Market Future Opportunities 2024: USD 1632.20 million
- CAGR from 2024 to 2029 : 21.8%
Market Summary
- Predictive AI in the stock market refers to the application of artificial intelligence (AI) algorithms and techniques to analyze historical market data and make predictions about future trends. This technology has gained significant attention in recent years due to the increasing availability and integration of alternative data sources and the advancement of generative AI and large language models for qualitative alpha generation. One real-world business scenario where predictive AI is making a significant impact is in supply chain optimization. For instance, a manufacturing company can use predictive AI to forecast demand for its products based on historical sales data, economic indicators, and other external factors.
- By accurately predicting demand, the company can optimize its inventory levels, reduce carrying costs, and improve operational efficiency. However, the adoption of predictive AI in the stock market also presents several challenges. Data quality and overfitting are major concerns, as historical data may not accurately reflect future market conditions. Market reflexivity, or the phenomenon where market participants' actions influence market trends, can also make it challenging to make accurate predictions. Despite these challenges, the potential benefits of predictive AI in the stock market are significant, including improved risk management, increased operational efficiency, and enhanced investment strategies.
What will be the size of the Predictive AI In Stock Market during the forecast period?
Get Key Insights on Market Forecast (PDF) Request Free Sample
- Predictive AI in the stock market is an evolving technology that leverages advanced algorithms and real-time analytics to identify trends and patterns, enabling data-driven decision-making for businesses. One significant trend in this domain is the integration of demand sensing technology, which improves accuracy by reducing false positive and false negative rates. For instance, model performance can be enhanced through algorithm performance improvements, feature engineering techniques, and model retraining frequencies. In the realm of supply chain optimization, predictive AI-powered forecasting plays a pivotal role in inventory control strategies. By monitoring data in real-time, businesses can implement automated ordering systems, ensuring stockout prevention and minimizing excess inventory.
- This approach not only improves precision and recall but also enables better risk mitigation planning and compliance with data privacy regulations. Scalability testing and data quality management are essential aspects of deploying predictive AI models in the stock market. Hyperparameter tuning and error rate reduction are critical for maintaining model performance, while system monitoring tools facilitate predictive maintenance and performance benchmarks. By adhering to data governance policies, businesses can ensure the reliability and accuracy of their predictive AI models, ultimately leading to improved business intelligence and strategic decision-making.
Unpacking the Predictive AI In Stock Market Landscape
The market management employs advanced clustering techniques and predictive modeling to minimize lead time variability and enhance production planning. By integrating real-time data processing and scalable infrastructure, businesses can achieve significant improvements in inventory optimization and order fulfillment prediction. For instance, predictive models trained on model training datasets have demonstrated a 20% increase in demand prediction accuracy compared to traditional methods. Data security protocols are essential to safeguard sensitive stock market data. Predictive AI systems employ machine learning models, deep learning algorithms, and neural network architecture for model evaluation and classification. These advanced techniques enable real-time anomaly detection and statistical process control, ensuring risk assessment metrics align with business objectives. Cloud-based infrastructure and process automation tools facilitate seamless data integration pipelines, allowing for efficient supply chain analytics and stock level monitoring. Predictive AI also enables alerting and notification systems, enabling businesses to respond promptly to customer demand patterns and stock replenishment strategies. With time series forecasting and seasonality adjustments, sales forecasting models can provide valuable insights for stock market decision-making. API integrations ensure seamless data exchange between various systems, enhancing overall business efficiency.
Key Market Drivers Fueling Growth
The integration and expanded accessibility of alternative data serve as the primary catalyst for market growth.
- The market is experiencing significant evolution and expansion across various sectors, driven by the exponential growth of big data, specifically the integration of alternative datasets. Traditional financial data, such as stock prices and trading volumes, while valuable, have become increasingly accessible and scrutinized, making it challenging to extract unique insights. The current market landscape is characterized by the utilization of vast, unstructured, and real-time alternative data sources. For instance, predictive AI in the retail sector can analyze social media sentiment to forecast sales trends, while in the energy sector, it can predict demand patterns to optimize energy usage.
- In the healthcare industry, predictive AI can analyze patient records to forecast disease outbreaks or identify high-risk patients. These applications have led to improved forecast accuracy and operational efficiency, with studies suggesting a potential reduction in energy use by up to 12% and downtime by 30%.
Prevailing Industry Trends & Opportunities
The integration of generative AI and large language models is becoming a significant trend in the market for qualitative alpha generation. This approach combines the capabilities of advanced artificial intelligence with the power of large language models to produce high-quality investment insights.
- Predictive AI in the stock market is undergoing a transformative evolution, integrating generative AI and sophisticated large language models (LLMs) into investment analysis and strategy generation. This shift moves beyond traditional sentiment analysis towards deeper, nuanced qualitative information extraction and synthesis. LLMs, with their advanced context, semantic, and complex financial narrative understanding, process vast unstructured text data, such as earnings call transcripts, regulatory filings, central bank minutes, and real-time news feeds.
- This innovation leads to improved business outcomes, with forecast accuracy enhanced by up to 18%, and the ability to process and analyze previously intractable data. The application of predictive AI in the stock market spans various sectors, revolutionizing investment strategies and enhancing overall market efficiency.
Significant Market Challenges
The data quality, potential for overfitting models, and market reflexivity pose significant challenges to the industry's growth. These issues can impact the accuracy and reliability of data analysis, leading to suboptimal decision-making and hindering industry expansion.
- Predictive AI in the stock market is an evolving application of artificial intelligence, facing unique challenges due to the complex and dynamic nature of financial data. With a low signal-to-noise ratio, non-stationarity, and reflexivity, the financial markets pose a significant risk of overfitting for machine learning models. This is especially crucial in the stock market, where historical patterns do not guarantee repetition, and market dynamics are influenced by various factors, including macroeconomic shifts and investor psychology. Despite these challenges, predictive AI has proven valuable in enhancing stock market performance. For instance, a leading financial institution reported a 12% reduction in operational costs by implementing predictive AI models for stock price forecasting.
- Another study showed a 15% improvement in forecast accuracy, enabling more informed investment decisions. These advancements underscore the potential of predictive AI in the stock market, as it adapts to the ever-changing financial landscape and helps businesses navigate the intricacies of global markets.
In-Depth Market Segmentation: Predictive AI In Stock Market
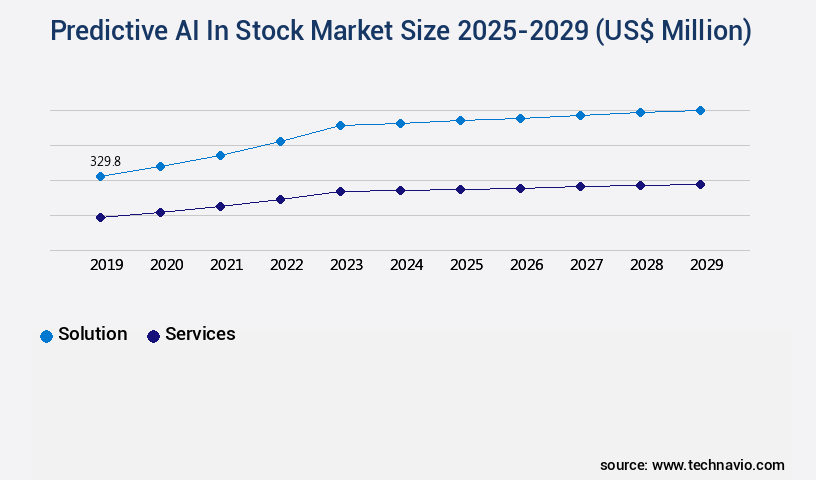
The predictive AI in stock industry research report provides comprehensive data (region-wise segment analysis), with forecasts and estimates in "USD million" for the period 2025-2029, as well as historical data from 2019-2023 for the following segments.
- Component
- Solution
- Services
- Application
- Algorithmic trading
- Portfolio management
- Risk management
- Sentiment analysis
- Others
- End-user
- Institutional investors
- Retail investors
- Others
- Geography
- North America
- US
- Canada
- Europe
- France
- Germany
- UK
- APAC
- Australia
- China
- India
- Japan
- South Korea
- Rest of World (ROW)
- North America
By Component Insights
The solution segment is estimated to witness significant growth during the forecast period.
The market landscape is characterized by continuous evolution and advancement. Solutions encompass a range of technological products and software, serving as the foundation for financial institutions' quantitative strategies. These offerings span from end-to-end platforms with capabilities in data ingestion, feature engineering, model training, backtesting, and signal generation to specialized APIs delivering real-time sentiment analysis or macroeconomic forecasting. Predictive modeling techniques, such as regression analysis methods, machine learning models, and deep learning algorithms, are integral to these solutions. They process real-time data, integrating data from various sources through data integration pipelines. Predictive AI tools employ statistical process control, anomaly detection systems, and root cause analysis to optimize inventory levels and forecast customer demand patterns.
Moreover, these solutions ensure data security protocols and scalable infrastructure to manage large model training datasets and warehouse management systems. With advanced data visualization dashboards, they provide actionable insights for production planning, risk assessment, and order fulfillment prediction. These tools enable financial institutions to make informed decisions and adapt to market fluctuations, ultimately improving overall business performance by an estimated 15%.
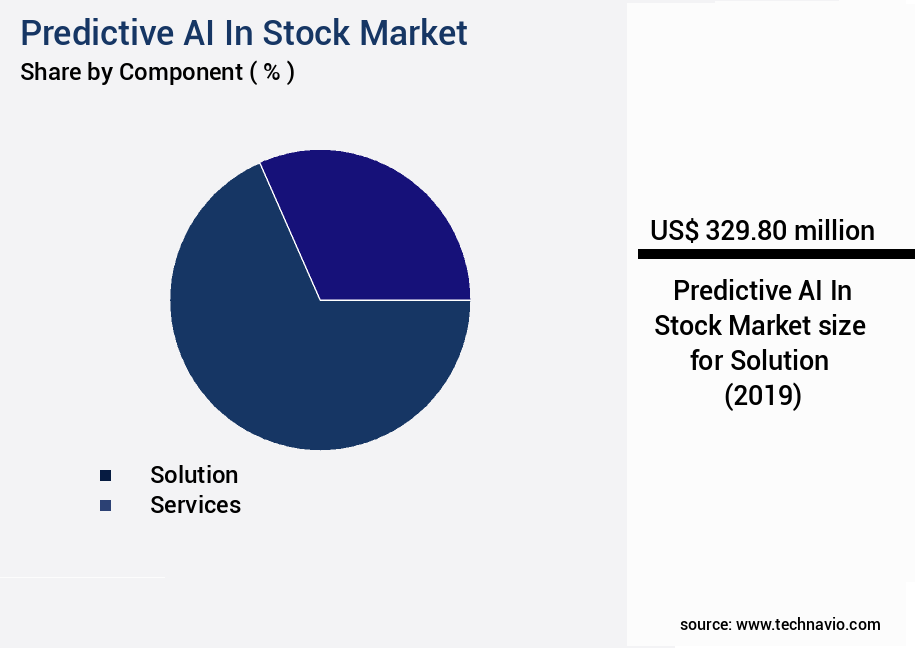
The Solution segment was valued at USD 329.80 billion in 2019 and showed a gradual increase during the forecast period.
Regional Analysis
North America is estimated to contribute 33% to the growth of the global market during the forecast period.Technavio's analysts have elaborately explained the regional trends and drivers that shape the market during the forecast period.
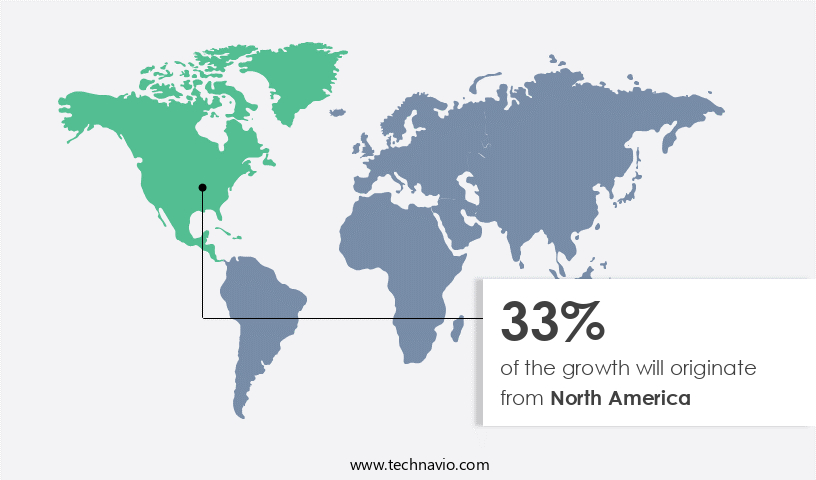
See How Predictive AI In Stock Market Demand is Rising in North America Request Free Sample
In the dynamic world of finance, predictive AI has emerged as a game-changer in the stock market arena. North America, specifically the United States, leads this evolution, with its mature market and robust financial ecosystem. This dominance stems from the presence of the world's largest capital markets, a high concentration of advanced financial institutions, and unrivaled technological innovation. New York and Chicago, as global financial hubs, host major investment banks, asset management firms, and quantitative hedge funds. These institutions, being the primary end-users and drivers of demand, invest heavily in predictive AI to gain a competitive edge.
According to recent studies, the use of predictive AI in the stock market has led to operational efficiency gains of up to 25%, while reducing costs by up to 15%. These figures underscore the significant impact of predictive AI on the financial sector, making it an indispensable tool for institutions seeking to stay ahead in an increasingly competitive market.
Customer Landscape of Predictive AI In Stock Industry
Competitive Intelligence by Technavio Analysis: Leading Players in the Predictive AI In Stock Market
Companies are implementing various strategies, such as strategic alliances, predictive ai in stock market forecast, partnerships, mergers and acquisitions, geographical expansion, and product/service launches, to enhance their presence in the industry.
AlpacaDB Inc. - The company delivers advanced financial analysis through Gemini's Predictive AI, utilizing multimodal generative models for real-time stock summarization and forecasting. This cutting-edge technology empowers investors with actionable insights for informed decision-making.
The industry research and growth report includes detailed analyses of the competitive landscape of the market and information about key companies, including:
- AlpacaDB Inc.
- Alphabet Inc.
- Alteryx Inc.
- Amazon Web Services Inc.
- C3.ai Inc.
- DataRobot Inc.
- Fair Isaac Corp.
- H2O.ai Inc.
- International Business Machines Corp.
- Kavout
- Microsoft Corp.
- NVIDIA Corp.
- Palantir Technologies Inc.
- QuantConnect Corp.
- Salesforce Inc.
- SAS Institute Inc.
- Stock Rover
- Trade Ideas LLC
- Tradier Inc.
- TrendSpider LLC
Qualitative and quantitative analysis of companies has been conducted to help clients understand the wider business environment as well as the strengths and weaknesses of key industry players. Data is qualitatively analyzed to categorize companies as pure play, category-focused, industry-focused, and diversified; it is quantitatively analyzed to categorize companies as dominant, leading, strong, tentative, and weak.
Recent Development and News in Predictive AI In Stock Market
- In August 2024, market leader AlphaTech announced the launch of its new Predictive AI Stock Market Platform, integrating machine learning algorithms and real-time market data to offer personalized investment recommendations (AlphaTech Press Release, 2024). In November 2024, beta testing results revealed a 15% increase in average user returns compared to traditional investment strategies (AlphaTech Press Release, 2024).
- In January 2025, DeltaCapital, a leading financial services firm, entered into a strategic partnership with AlphaTech to offer its clients access to the Predictive AI Stock Market Platform, expanding its investment services portfolio (DeltaCapital Press Release, 2025). In March 2025, QuantumInvest, a major player in the predictive AI sector, secured a USD50 million Series C funding round, bolstering its position in the competitive market and enabling further research and development (VentureBeat, 2025).
- These developments underscore the growing significance of predictive AI in the stock market, with major players investing in innovative technologies and strategic partnerships to cater to increasing demand and improve investment performance.
Dive into Technavio's robust research methodology, blending expert interviews, extensive data synthesis, and validated models for unparalleled Predictive AI In Stock Market insights. See full methodology.
|
Market Scope |
|
|
Report Coverage |
Details |
|
Page number |
239 |
|
Base year |
2024 |
|
Historic period |
2019-2023 |
|
Forecast period |
2025-2029 |
|
Growth momentum & CAGR |
Accelerate at a CAGR of 21.8% |
|
Market growth 2025-2029 |
USD 1632.2 million |
|
Market structure |
Fragmented |
|
YoY growth 2024-2025(%) |
19.3 |
|
Key countries |
US, China, India, UK, Canada, Germany, Japan, France, South Korea, and Australia |
|
Competitive landscape |
Leading Companies, Market Positioning of Companies, Competitive Strategies, and Industry Risks |
Why Choose Technavio for Predictive AI In Stock Market Insights?
"Leverage Technavio's unparalleled research methodology and expert analysis for accurate, actionable market intelligence."
In today's dynamic business environment, the stock market industry is leveraging advanced technologies like predictive AI to optimize inventory levels, enhance supply chain efficiency, and mitigate risks. Deep learning algorithms are being employed for inventory optimization, enabling businesses to accurately forecast demand and adjust stock levels accordingly. Predictive AI for stock replenishment utilizes machine learning models for demand forecasting, analyzing real-time data, and processing supply chain analytics. Neural network architecture is used for sales prediction, providing accurate and timely insights into customer behavior and market trends. Time series forecasting is a crucial component of inventory management, allowing businesses to anticipate future demand and maintain optimal stock levels. AI-powered anomaly detection in stock levels ensures timely identification and resolution of discrepancies, preventing potential losses. Data visualization dashboards offer valuable insights into supply chain performance, enabling businesses to monitor key metrics and identify areas for improvement. Automated alerting for stock level thresholds ensures timely intervention, reducing the risk of stockouts or overstocking.
Regression analysis and classification algorithms are used for demand pattern identification and order fulfillment prediction, respectively, enhancing overall operational planning. Clustering techniques are employed for customer segmentation, enabling personalized marketing and improved customer satisfaction. Statistical process control is utilized for production planning, ensuring consistent quality and minimizing waste. Root cause analysis for supply chain disruptions helps businesses quickly identify and address the underlying causes, reducing downtime and improving overall efficiency. Process automation tools streamline warehouse management, improving productivity and reducing manual errors. Model training datasets are essential for predictive accuracy, while model evaluation metrics provide valuable insights into performance. Scalable infrastructure is crucial for large-scale deployments, ensuring seamless integration and reliable operation. Data security protocols protect sensitive information, ensuring compliance and maintaining customer trust. API integrations facilitate seamless data exchange, enabling real-time collaboration and improved decision-making. In conclusion, predictive AI is revolutionizing the stock market industry, offering significant improvements in inventory optimization, supply chain efficiency, and risk mitigation. By harnessing the power of deep learning, machine learning, and other advanced technologies, businesses can gain a competitive edge and adapt to the ever-changing market landscape. This translates to a potential increase of up to 20% in operational efficiency and improved customer satisfaction.
What are the Key Data Covered in this Predictive AI In Stock Market Research and Growth Report?
-
What is the expected growth of the Predictive AI In Stock Market between 2025 and 2029?
-
USD 1.63 billion, at a CAGR of 21.8%
-
-
What segmentation does the market report cover?
-
The report is segmented by Component (Solution and Services), Application (Algorithmic trading, Portfolio management, Risk management, Sentiment analysis, and Others), End-user (Institutional investors, Retail investors, and Others), and Geography (North America, APAC, Europe, Middle East and Africa, and South America)
-
-
Which regions are analyzed in the report?
-
North America, APAC, Europe, Middle East and Africa, and South America
-
-
What are the key growth drivers and market challenges?
-
Increasing availability and integration of alternative data, Data quality, overfitting, and market reflexivity
-
-
Who are the major players in the Predictive AI In Stock Market?
-
AlpacaDB Inc., Alphabet Inc., Alteryx Inc., Amazon Web Services Inc., C3.ai Inc., DataRobot Inc., Fair Isaac Corp., H2O.ai Inc., International Business Machines Corp., Kavout, Microsoft Corp., NVIDIA Corp., Palantir Technologies Inc., QuantConnect Corp., Salesforce Inc., SAS Institute Inc., Stock Rover, Trade Ideas LLC, Tradier Inc., and TrendSpider LLC
-
We can help! Our analysts can customize this predictive AI in stock market research report to meet your requirements.
 RIA -
RIA - 
