Robotics Market Analysis, Size, and Forecast 2026-2030: APAC (China, Japan, and South Korea), Europe (Germany, France, and UK), North America (US, Canada, and Mexico), Middle East and Africa (Saudi Arabia, UAE, and Israel), South America (Brazil and Argentina), and Rest of World (ROW)

Robotics Market Analysis, Size, and Forecast 2026-2030:
APAC (China, Japan, and South Korea), Europe (Germany, France, and UK), North America (US, Canada, and Mexico), Middle East and Africa (Saudi Arabia, UAE, and Israel), South America (Brazil and Argentina), and Rest of World (ROW)

Published: Apr 2026 302 Pages SKU: IRTNTR44162

Market Overview at a Glance

$21.64 B
Market Opportunity
6.6%
CAGR 2025 - 2030
56.7%
APAC Growth
$31.08 B
Industrial segment 2024

Robotics Market Size 2026-2030

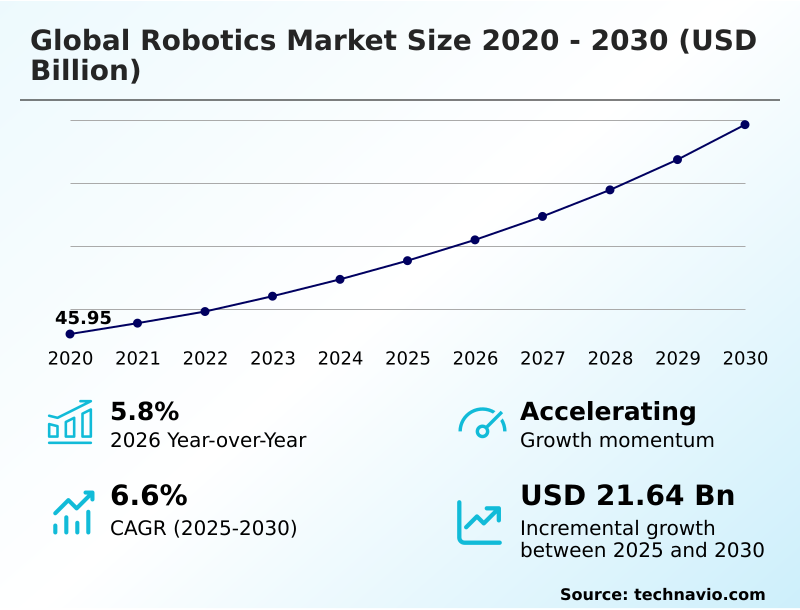
The robotics market size is valued to increase by USD 21.64 billion, at a CAGR of 6.6% from 2025 to 2030. Critical shortages of labor and demographic shifts will drive the robotics market.

Major Market Trends & Insights

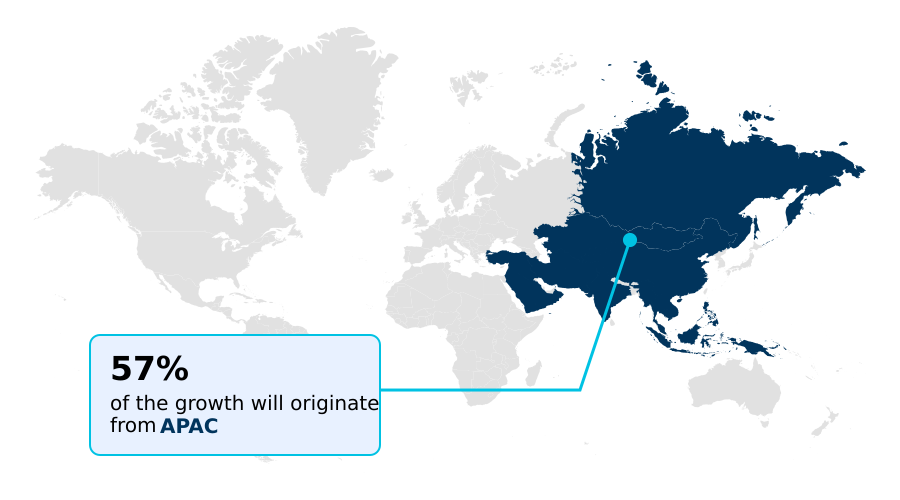
  • APAC dominated the market and accounted for a 56.7% growth during the forecast period.
  • By Application - Industrial segment was valued at USD 31.08 billion in 2024
  • By End-user - Manufacturing segment accounted for the largest market revenue share in 2024

Market Size & Forecast

  • Market Opportunities: USD 33.30 billion
  • Market Future Opportunities: USD 21.64 billion
  • CAGR from 2025 to 2030 : 6.6%

Market Summary

  • The robotics market is undergoing a critical transformation, shifting from task-specific automation toward adaptive, software-defined systems. This evolution is driven by the convergence of generative artificial intelligence and high-fidelity physical simulation, enabling robotic platforms to generalize learning from virtual training to unstructured, real-world settings.
  • As sectors from logistics to healthcare confront persistent labor shortages and escalating operational costs, demand has expanded beyond traditional automotive assembly into complex domains like precision agriculture and domestic assistance. The industrialization of physical AI is a pivotal development, equipping robots with perception-driven architectures for autonomous decision-making and safer human-robot collaboration.
  • For instance, in a modern fulfillment center, a fleet of autonomous mobile robots navigates dynamic layouts to optimize order picking, reducing walk times for human associates by over 60% and directly improving throughput. This technical redirection is supported by the democratization of technology, as falling component costs and flexible Robot-as-a-Service models enable small and medium-sized enterprises to adopt scalable solutions.
  • The focus on energy efficiency, lightweight materials, and advanced gripper technology further ensures that automated operations align with global sustainability mandates, cementing robotics as a cornerstone of the modern economy.

What will be the Size of the Robotics Market during the forecast period?

Get Key Insights on Market Forecast (PDF) Get Free Sample

How is the Robotics Market Segmented?

The robotics industry research report provides comprehensive data (region-wise segment analysis), with forecasts and estimates in "USD million" for the period 2026-2030, as well as historical data from 2020-2024 for the following segments.

  • Application
    • Industrial
    • Services
  • End-user
    • Manufacturing
    • Healthcare
    • Aerospace and defense
    • Media and entertainment
    • Others
  • Component
    • Hardware
    • Software
    • Services
  • Geography
    • APAC
      • China
      • Japan
      • South Korea
    • Europe
      • Germany
      • France
      • UK
    • North America
      • US
      • Canada
      • Mexico
    • Middle East and Africa
      • Saudi Arabia
      • UAE
      • Israel
    • South America
      • Brazil
      • Argentina
    • Rest of World (ROW)

By Application Insights

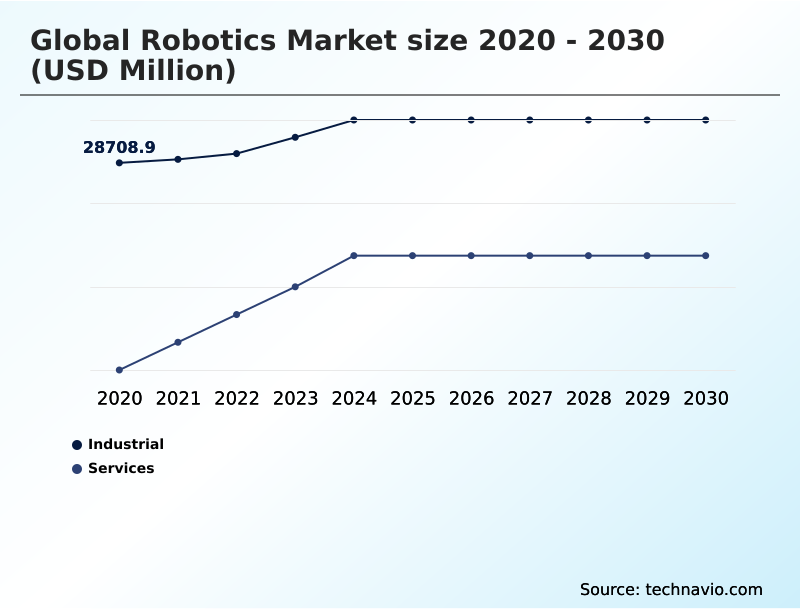
The industrial segment is estimated to witness significant growth during the forecast period.

The industrial segment is defined by the deployment of automated systems in manufacturing. Modern industrial robotics are moving beyond static roles, with perception-driven architectures enabling high-precision assembly and dynamic task handling.

This evolution is central to Industry 4.0 automation, where smart factory environments require seamless human-robot collaboration and adaptability. Innovations in actuators and end-effectors, guided by bionic design principles, allow for greater dexterity.

The integration of robotic process automation with physical systems is becoming critical, though challenges with legacy infrastructure integration remain.

Modular robotics are gaining traction, allowing for scalable high-throughput logistics and production lines, with some systems achieving a 20% reduction in reconfiguration downtime.

Get Free Sample

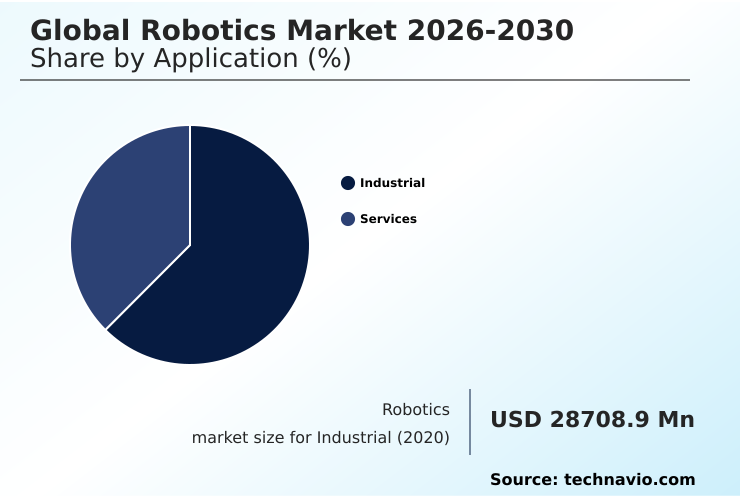
The Industrial segment was valued at USD 31.08 billion in 2024 and showed a gradual increase during the forecast period.

Get Free Sample

Regional Analysis

APAC is estimated to contribute 56.7% to the growth of the global market during the forecast period.Technavio’s analysts have elaborately explained the regional trends and drivers that shape the market during the forecast period.

See How Robotics Market Demand is Rising in APAC Get Free Sample

The geographic landscape is dominated by APAC, which accounts for over 56% of the incremental growth, driven by massive industrialization and a burgeoning demand for service robotics.

This region is a key testing ground for last-mile delivery solutions using autonomous mobile robots.

In contrast, North America, with a more modest growth rate of 3.5%, leads in innovation, particularly in surgical robots featuring advanced haptic feedback systems and endoluminal systems.

Europe is focusing on sustainable automation and human-robot interaction to support its reshoring manufacturing initiatives. The adoption of robots-as-a-service (RaaS) models is growing globally, lowering entry barriers.

Meanwhile, specialized applications like exoskeletons for rehabilitation and autonomous drone inspection for infrastructure are gaining traction in developed markets.

Market Dynamics

Our researchers analyzed the data with 2025 as the base year, along with the key drivers, trends, and challenges. A holistic analysis of drivers will help companies refine their marketing strategies to gain a competitive advantage.

  • The strategic deployment of advanced robotics is reshaping industries, with a focus on specialized, high-value applications. The development of robotic systems for hazardous environments is paramount in sectors like energy and defense, mitigating risks to human personnel. In business operations, the integration of AI in robotic process automation is streamlining back-office functions, linking digital workflows with physical execution.
  • The logistics sector is being revolutionized by humanoid robots in logistics automation, which promise to navigate spaces designed for people. Meanwhile, collaborative robots for SME manufacturing are lowering the barrier to entry for automation. The evolution of agentic AI for autonomous navigation is making mobile robots more intelligent and adaptable in complex spaces.
  • The impact of 5G on industrial robotics is enabling low-latency communication for real-time control and data processing. New robots-as-a-service business models are changing procurement strategies, shifting focus from capital expenditure to operational performance, achieving more than 2x faster technology adoption cycles for some firms. In quality assurance, machine vision for quality control is becoming standard.
  • Emerging fields include swarm robotics in precision agriculture for optimized farm management and 3d concrete printing for construction. However, challenges in robotic fleet management and the need for clear interoperability standards for industrial robots persist. The use of vision-language models for robot control is making interaction more intuitive.
  • Healthcare is benefiting from the role of exoskeletons in rehabilitation, while edge computing in autonomous mobile robots ensures rapid decision-making. Hardware innovations like force-torque sensors in collaborative robots and bionic gripper technology for delicate handling enhance capability.
  • Finally, successfully integrating ROS with legacy factory systems and establishing robust security protocols for connected robots are critical for success, alongside predictive maintenance for robotic arms to ensure uptime.

What are the key market drivers leading to the rise in the adoption of Robotics Industry?

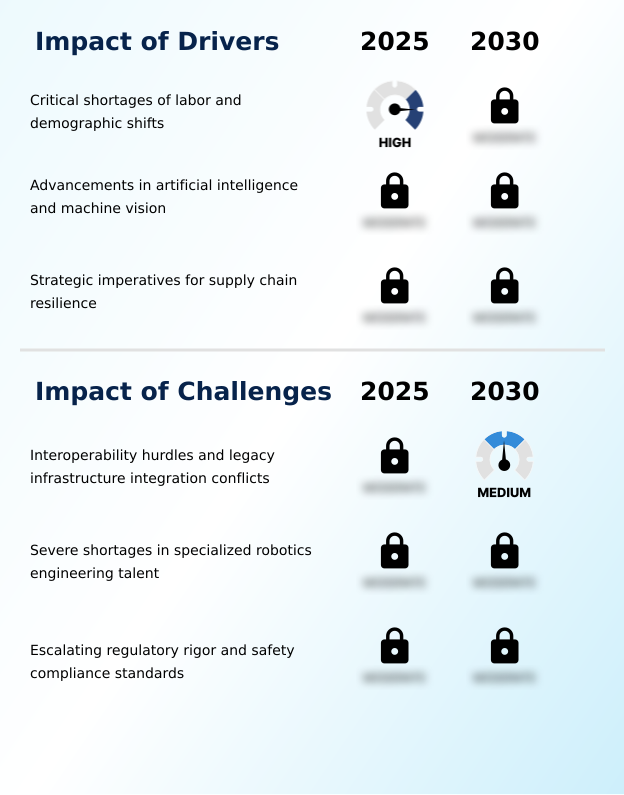
  • Critical shortages of skilled labor and ongoing demographic shifts are key drivers propelling growth and investment in the robotics market.

  • Key drivers include acute labor shortages and the strategic need for supply chain resilience, which is accelerating reshoring manufacturing efforts. Companies are deploying collaborative robots to augment human workers, boosting productivity in some plants by 25%.
  • This human-robot collaboration is central to the smart factory vision of Industry 4.0 automation. Advancements in mechatronics and computer vision have expanded robot capabilities, enabling effective autonomous navigation in dynamic settings.
  • The integration of edge computing facilitates real-time data processing for predictive maintenance, which can reduce equipment downtime by 40%.
  • This synergy of intelligent software and hardware, promoting better human-robot interaction, is critical for achieving sustainable manufacturing automation and maintaining operational continuity.

What are the market trends shaping the Robotics Industry?

  • The proliferation of swarm robotics and decentralized intelligence is emerging as a significant market trend. This is driving the adoption of coordinated, autonomous units across various sectors.

  • A key market trend is the shift toward decentralized intelligence through swarm robotics, where coordinated units improve efficiency in logistics and agriculture by over 30% compared to single-robot systems. The integration of agentic AI and vision-language models into the robotic operating system allows machines to interpret complex commands via natural language processing for robots, reducing programming complexity.
  • This move toward production-scale physical AI is accelerated by low-code programming interfaces. Digital twin simulation in robotic simulation environments allows for virtual testing, cutting physical deployment times by up to 50%. Advancements in machine vision systems and soft robotics are enabling software-defined automation solutions that are more adaptable to unstructured environments.

What challenges does the Robotics Industry face during its growth?

  • Significant interoperability hurdles and conflicts arising from the integration of modern robotics with legacy infrastructure present a key challenge affecting industry-wide growth.

  • A primary market challenge is the difficulty of legacy infrastructure integration, which complicates the implementation of a cohesive data-driven operational strategy. The lack of interoperability standards hinders effective robotic fleet management, with over 60% of companies citing integration issues as a major barrier.
  • Deploying advanced systems like automated guided vehicles or robots with sophisticated LiDAR sensors and bionic gripper technology in older facilities often requires cost-prohibitive retrofitting. Furthermore, a severe shortage of skilled technicians capable of maintaining specialized hardware for hazardous environment operation or circular economy robotics increases operational costs.
  • This talent gap affects even niche applications like automated fiber placement and 3d concrete printing, slowing adoption despite clear efficiency benefits.

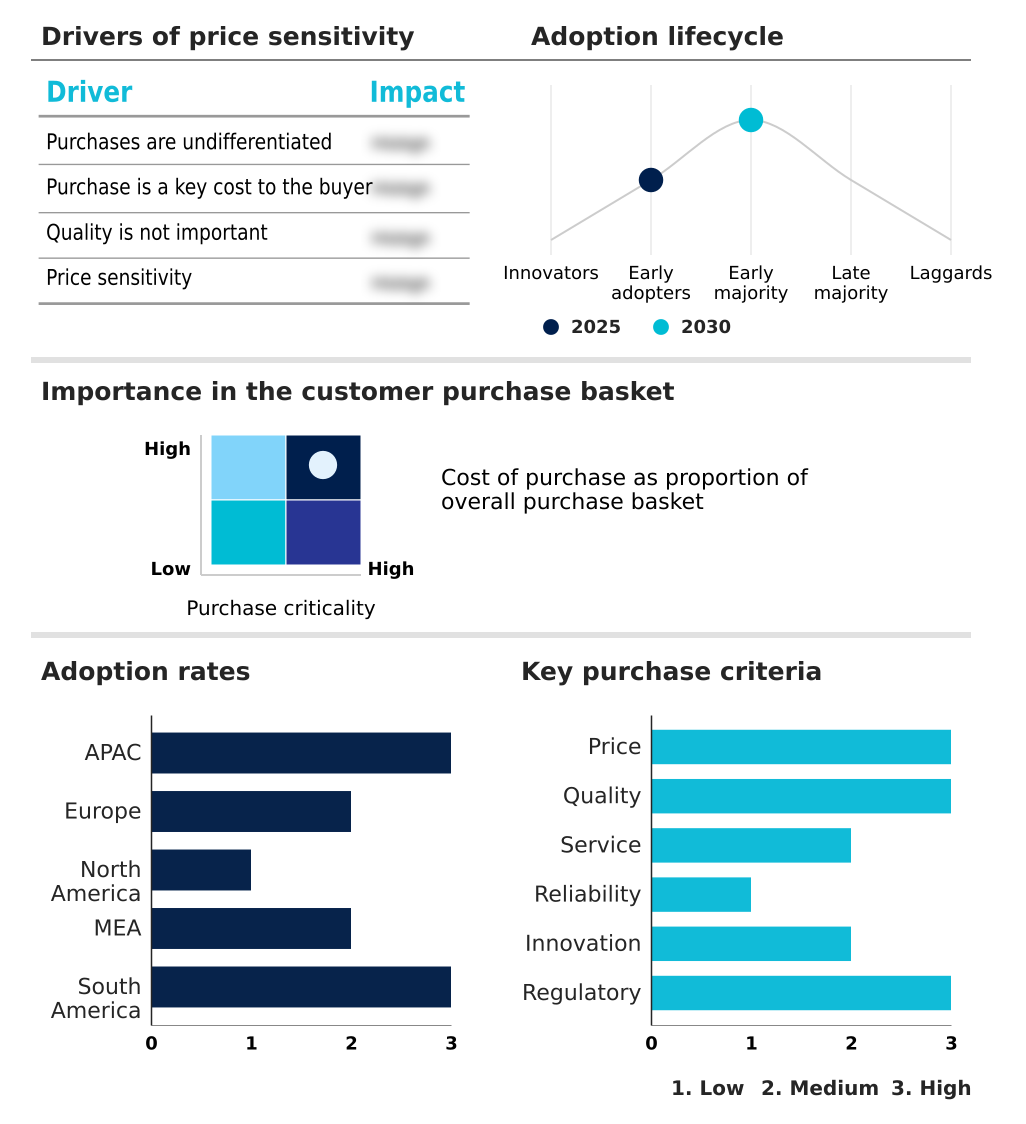
Exclusive Technavio Analysis on Customer Landscape

The robotics market forecasting report includes the adoption lifecycle of the market, covering from the innovator’s stage to the laggard’s stage. It focuses on adoption rates in different regions based on penetration. Furthermore, the robotics market report also includes key purchase criteria and drivers of price sensitivity to help companies evaluate and develop their market growth analysis strategies.

Customer Landscape of Robotics Industry

Competitive Landscape

Companies are implementing various strategies, such as strategic alliances, robotics market forecast, partnerships, mergers and acquisitions, geographical expansion, and product/service launches, to enhance their presence in the industry.

ABB Ltd. - Delivers integrated automation solutions, combining high-precision robotics and advanced control systems for complex manufacturing and logistics environments.

The industry research and growth report includes detailed analyses of the competitive landscape of the market and information about key companies, including:

  • ABB Ltd.
  • Agility Robotics Inc.
  • Apptronik Inc.
  • Boston Dynamics Inc.
  • Comau SpA
  • DENSO Corp.
  • FANUC Corp.
  • Grey Orange Pte. Ltd.
  • HD Hyundai Robotics
  • Intuitive Surgical Inc.
  • Kawasaki Robotics USA Inc.
  • KUKA AG
  • Mitsubishi Electric Corp.
  • Nachi Fujikoshi Corp.
  • OMRON Corp.
  • Seiko Epson Corp.
  • Staubli International
  • UBTECH ROBOTICS CORP LTD
  • Universal Robots AS
  • Yaskawa Electric Corp.

Qualitative and quantitative analysis of companies has been conducted to help clients understand the wider business environment as well as the strengths and weaknesses of key industry players. Data is qualitatively analyzed to categorize companies as pure play, category-focused, industry-focused, and diversified; it is quantitatively analyzed to categorize companies as dominant, leading, strong, tentative, and weak.

Recent Development and News in Robotics market

  • In January 2025, Boston Dynamics Inc. unveiled its all-electric Atlas humanoid robot, a platform engineered for a wide range of industrial tasks and initially deployed for application testing with automotive and technology partners.
  • In February 2025, HD Hyundai Robotics and KUKA AG announced an expanded collaboration to develop standardized communication protocols, aiming to ensure seamless interoperability for collaborative robots within heterogeneous smart factory ecosystems.
  • In March 2025, Intuitive Surgical Inc. began the global rollout of its next-generation da Vinci 5 surgical system, which incorporates integrated force-feedback technology and advanced digital tools to enhance surgeon control in high-precision procedures.
  • In April 2025, NVIDIA launched the Nemotron Coalition, a strategic initiative with prominent AI research labs focused on creating open-source frontier models optimized to provide a standardized computational framework for advanced humanoid robotics.

Dive into Technavio’s robust research methodology, blending expert interviews, extensive data synthesis, and validated models for unparalleled Robotics Market insights. See full methodology.

Market Scope
Page number 302
Base year 2025
Historic period 2020-2024
Forecast period 2026-2030
Growth momentum & CAGR Accelerate at a CAGR of 6.6%
Market growth 2026-2030 USD 21636.4 million
Market structure Fragmented
YoY growth 2025-2026(%) 5.8%
Key countries China, Japan, South Korea, India, Australia, Indonesia, Germany, France, UK, Italy, Spain, The Netherlands, US, Canada, Mexico, Saudi Arabia, UAE, Israel, Turkey, South Africa, Brazil, Argentina and Chile
Competitive landscape Leading Companies, Market Positioning of Companies, Competitive Strategies, and Industry Risks

Request Free Sample

Research Analyst Overview

  • The robotics market is advancing through the integration of agentic AI and computer vision, creating intelligent systems for applications ranging from industrial robotics to advanced service robotics. Core technologies like the robotic operating system (ROS) are enabling complex human-robot interaction and the deployment of collaborative robots. The development of specialized hardware, including high-performance actuators, precise LiDAR sensors, and versatile end-effectors, is crucial.
  • We see humanoid robots and autonomous mobile robots transforming logistics, while surgical robots and exoskeletons redefine healthcare. Swarm robotics and soft robotics open new possibilities, with digital twin simulation accelerating development. In manufacturing, automated fiber placement and 3d concrete printing showcase niche applications.
  • For boardroom decisions, the shift to robots-as-a-service models impacts capital budgeting, allowing firms to adopt robotic process automation without massive upfront investment, with some achieving a 30% reduction in processing time. Systems now use force-torque sensors, vision-language models, bionic gripper technology, and perception-driven architectures, managed via edge computing for predictive maintenance.
  • This landscape includes modular robotics, tactical reconnaissance units, animatronics, automated guided vehicle systems, and advancements in mechatronics for high-precision assembly and autonomous navigation.

What are the Key Data Covered in this Robotics Market Research and Growth Report?

  • What is the expected growth of the Robotics Market between 2026 and 2030?

    • USD 21.64 billion, at a CAGR of 6.6%

  • What segmentation does the market report cover?

    • The report is segmented by Application (Industrial, and Services), End-user (Manufacturing, Healthcare, Aerospace and defense, Media and entertainment, and Others), Component (Hardware, Software, and Services) and Geography (APAC, Europe, North America, Middle East and Africa, South America)

  • Which regions are analyzed in the report?

    • APAC, Europe, North America, Middle East and Africa and South America

  • What are the key growth drivers and market challenges?

    • Critical shortages of labor and demographic shifts, Interoperability hurdles and legacy infrastructure integration conflicts

  • Who are the major players in the Robotics Market?

    • ABB Ltd., Agility Robotics Inc., Apptronik Inc., Boston Dynamics Inc., Comau SpA, DENSO Corp., FANUC Corp., Grey Orange Pte. Ltd., HD Hyundai Robotics, Intuitive Surgical Inc., Kawasaki Robotics USA Inc., KUKA AG, Mitsubishi Electric Corp., Nachi Fujikoshi Corp., OMRON Corp., Seiko Epson Corp., Staubli International, UBTECH ROBOTICS CORP LTD, Universal Robots AS and Yaskawa Electric Corp.

Market Research Insights

  • Market dynamics are increasingly influenced by the convergence of software-defined automation and physical artificial intelligence. This shift enables a data-driven operational strategy where robotic fleet management systems optimize for supply chain resilience, improving on-time delivery rates by up to 25% compared to legacy systems. The adoption of low-code programming interfaces has democratized deployment, reducing implementation time by 40% for SMEs.
  • Digital enterprise integration allows for remote robotic monitoring and robotic process orchestration, which are crucial for hazardous environment operation and sustainable manufacturing automation. Advances in natural language processing for robots and decentralized intelligence are facilitating the move toward production-scale physical AI, while circular economy robotics and precision agriculture robotics open new avenues for resource efficiency.

We can help! Our analysts can customize this robotics market research report to meet your requirements.

Get in touch

1. Executive Summary

1.1 Market overview

Executive Summary - Chart on Market Overview
Executive Summary - Data Table on Market Overview
Executive Summary - Chart on Global Market Characteristics
Executive Summary - Chart on Market by Geography
Executive Summary - Chart on Market Segmentation by Application
Executive Summary - Chart on Market Segmentation by End-user
Executive Summary - Chart on Market Segmentation by Component
Executive Summary - Chart on Incremental Growth
Executive Summary - Data Table on Incremental Growth
Executive Summary - Chart on Company Market Positioning

2. Technavio Analysis

2.1 Analysis of price sensitivity, lifecycle, customer purchase basket, adoption rates, and purchase criteria

2.2 Criticality of inputs and Factors of differentiation

Chart on Overview on criticality of inputs and factors of differentiation

2.3 Factors of disruption

Chart on Overview on factors of disruption

2.4 Impact of drivers and challenges

Chart on Impact of drivers and challenges in 2025 and 2030

3. Market Landscape

3.1 Market ecosystem

Chart on Parent Market
Data Table on - Parent Market

3.2 Market characteristics

Chart on Market characteristics analysis

3.3 Value chain analysis

Chart on Value chain analysis

4. Market Sizing

4.1 Market definition

Data Table on Offerings of companies included in the market definition

4.2 Market segment analysis

Market segments

4.3 Market size 2025

4.4 Market outlook: Forecast for 2025-2030

Chart on Global - Market size and forecast 2025-2030 ($ million)
Data Table on Global - Market size and forecast 2025-2030 ($ million)
Chart on Global Market: Year-over-year growth 2025-2030 (%)
Data Table on Global Market: Year-over-year growth 2025-2030 (%)

5. Historic Market Size

5.1 Global Robotics Market 2020 - 2024

Historic Market Size - Data Table on Global Robotics Market 2020 - 2024 ($ million)

5.2 Application segment analysis 2020 - 2024

Historic Market Size - Application Segment 2020 - 2024 ($ million)

5.3 End-user segment analysis 2020 - 2024

Historic Market Size - End-user Segment 2020 - 2024 ($ million)

5.4 Component segment analysis 2020 - 2024

Historic Market Size - Component Segment 2020 - 2024 ($ million)

5.5 Geography segment analysis 2020 - 2024

Historic Market Size - Geography Segment 2020 - 2024 ($ million)

5.6 Country segment analysis 2020 - 2024

Historic Market Size - Country Segment 2020 - 2024 ($ million)

6. Qualitative Analysis

6.1 Impact of AI in global robotics market

6.2 Impact of geopolitical conflict on global robotics market

7. Five Forces Analysis

7.1 Five forces summary

Five forces analysis - Comparison between 2025 and 2030

7.2 Bargaining power of buyers

Bargaining power of buyers - Impact of key factors 2025 and 2030

7.3 Bargaining power of suppliers

Bargaining power of suppliers - Impact of key factors in 2025 and 2030

7.4 Threat of new entrants

Threat of new entrants - Impact of key factors in 2025 and 2030

7.5 Threat of substitutes

Threat of substitutes - Impact of key factors in 2025 and 2030

7.6 Threat of rivalry

Threat of rivalry - Impact of key factors in 2025 and 2030

7.7 Market condition

Chart on Market condition - Five forces 2025 and 2030

8. Market Segmentation by Application

8.1 Market segments

Chart on Application - Market share 2025-2030 (%)
Data Table on Application - Market share 2025-2030 (%)

8.2 Comparison by Application

Chart on Comparison by Application
Data Table on Comparison by Application

8.3 Industrial - Market size and forecast 2025-2030

Chart on Industrial - Market size and forecast 2025-2030 ($ million)
Data Table on Industrial - Market size and forecast 2025-2030 ($ million)
Chart on Industrial - Year-over-year growth 2025-2030 (%)
Data Table on Industrial - Year-over-year growth 2025-2030 (%)

8.4 Services - Market size and forecast 2025-2030

Chart on Services - Market size and forecast 2025-2030 ($ million)
Data Table on Services - Market size and forecast 2025-2030 ($ million)
Chart on Services - Year-over-year growth 2025-2030 (%)
Data Table on Services - Year-over-year growth 2025-2030 (%)

8.5 Market opportunity by Application

Market opportunity by Application ($ million)
Data Table on Market opportunity by Application ($ million)

9. Market Segmentation by End-user

9.1 Market segments

Chart on End-user - Market share 2025-2030 (%)
Data Table on End-user - Market share 2025-2030 (%)

9.2 Comparison by End-user

Chart on Comparison by End-user
Data Table on Comparison by End-user

9.3 Manufacturing - Market size and forecast 2025-2030

Chart on Manufacturing - Market size and forecast 2025-2030 ($ million)
Data Table on Manufacturing - Market size and forecast 2025-2030 ($ million)
Chart on Manufacturing - Year-over-year growth 2025-2030 (%)
Data Table on Manufacturing - Year-over-year growth 2025-2030 (%)

9.4 Healthcare - Market size and forecast 2025-2030

Chart on Healthcare - Market size and forecast 2025-2030 ($ million)
Data Table on Healthcare - Market size and forecast 2025-2030 ($ million)
Chart on Healthcare - Year-over-year growth 2025-2030 (%)
Data Table on Healthcare - Year-over-year growth 2025-2030 (%)

9.5 Aerospace and defense - Market size and forecast 2025-2030

Chart on Aerospace and defense - Market size and forecast 2025-2030 ($ million)
Data Table on Aerospace and defense - Market size and forecast 2025-2030 ($ million)
Chart on Aerospace and defense - Year-over-year growth 2025-2030 (%)
Data Table on Aerospace and defense - Year-over-year growth 2025-2030 (%)

9.6 Media and entertainment - Market size and forecast 2025-2030

Chart on Media and entertainment - Market size and forecast 2025-2030 ($ million)
Data Table on Media and entertainment - Market size and forecast 2025-2030 ($ million)
Chart on Media and entertainment - Year-over-year growth 2025-2030 (%)
Data Table on Media and entertainment - Year-over-year growth 2025-2030 (%)

9.7 Others - Market size and forecast 2025-2030

Chart on Others - Market size and forecast 2025-2030 ($ million)
Data Table on Others - Market size and forecast 2025-2030 ($ million)
Chart on Others - Year-over-year growth 2025-2030 (%)
Data Table on Others - Year-over-year growth 2025-2030 (%)

9.8 Market opportunity by End-user

Market opportunity by End-user ($ million)
Data Table on Market opportunity by End-user ($ million)

10. Market Segmentation by Component

10.1 Market segments

Chart on Component - Market share 2025-2030 (%)
Data Table on Component - Market share 2025-2030 (%)

10.2 Comparison by Component

Chart on Comparison by Component
Data Table on Comparison by Component

10.3 Hardware - Market size and forecast 2025-2030

Chart on Hardware - Market size and forecast 2025-2030 ($ million)
Data Table on Hardware - Market size and forecast 2025-2030 ($ million)
Chart on Hardware - Year-over-year growth 2025-2030 (%)
Data Table on Hardware - Year-over-year growth 2025-2030 (%)

10.4 Software - Market size and forecast 2025-2030

Chart on Software - Market size and forecast 2025-2030 ($ million)
Data Table on Software - Market size and forecast 2025-2030 ($ million)
Chart on Software - Year-over-year growth 2025-2030 (%)
Data Table on Software - Year-over-year growth 2025-2030 (%)

10.5 Services - Market size and forecast 2025-2030

Chart on Services - Market size and forecast 2025-2030 ($ million)
Data Table on Services - Market size and forecast 2025-2030 ($ million)
Chart on Services - Year-over-year growth 2025-2030 (%)
Data Table on Services - Year-over-year growth 2025-2030 (%)

10.6 Market opportunity by Component

Market opportunity by Component ($ million)
Data Table on Market opportunity by Component ($ million)

11. Customer Landscape

11.1 Customer landscape overview

Analysis of price sensitivity, lifecycle, customer purchase basket, adoption rates, and purchase criteria

12. Geographic Landscape

12.1 Geographic segmentation

Chart on Market share by geography 2025-2030 (%)
Data Table on Market share by geography 2025-2030 (%)

12.2 Geographic comparison

Chart on Geographic comparison
Data Table on Geographic comparison

12.3 APAC - Market size and forecast 2025-2030

Chart on APAC - Market size and forecast 2025-2030 ($ million)
Data Table on APAC - Market size and forecast 2025-2030 ($ million)
Chart on APAC - Year-over-year growth 2025-2030 (%)
Data Table on APAC - Year-over-year growth 2025-2030 (%)
Chart on Regional Comparison - APAC
Data Table on Regional Comparison - APAC

12.3.1 China - Market size and forecast 2025-2030

Chart on China - Market size and forecast 2025-2030 ($ million)
Data Table on China - Market size and forecast 2025-2030 ($ million)
Chart on China - Year-over-year growth 2025-2030 (%)
Data Table on China - Year-over-year growth 2025-2030 (%)

12.3.2 Japan - Market size and forecast 2025-2030

Chart on Japan - Market size and forecast 2025-2030 ($ million)
Data Table on Japan - Market size and forecast 2025-2030 ($ million)
Chart on Japan - Year-over-year growth 2025-2030 (%)
Data Table on Japan - Year-over-year growth 2025-2030 (%)

12.3.3 South Korea - Market size and forecast 2025-2030

Chart on South Korea - Market size and forecast 2025-2030 ($ million)
Data Table on South Korea - Market size and forecast 2025-2030 ($ million)
Chart on South Korea - Year-over-year growth 2025-2030 (%)
Data Table on South Korea - Year-over-year growth 2025-2030 (%)

12.3.4 India - Market size and forecast 2025-2030

Chart on India - Market size and forecast 2025-2030 ($ million)
Data Table on India - Market size and forecast 2025-2030 ($ million)
Chart on India - Year-over-year growth 2025-2030 (%)
Data Table on India - Year-over-year growth 2025-2030 (%)

12.3.5 Australia - Market size and forecast 2025-2030

Chart on Australia - Market size and forecast 2025-2030 ($ million)
Data Table on Australia - Market size and forecast 2025-2030 ($ million)
Chart on Australia - Year-over-year growth 2025-2030 (%)
Data Table on Australia - Year-over-year growth 2025-2030 (%)

12.3.6 Indonesia - Market size and forecast 2025-2030

Chart on Indonesia - Market size and forecast 2025-2030 ($ million)
Data Table on Indonesia - Market size and forecast 2025-2030 ($ million)
Chart on Indonesia - Year-over-year growth 2025-2030 (%)
Data Table on Indonesia - Year-over-year growth 2025-2030 (%)

12.4 Europe - Market size and forecast 2025-2030

Chart on Europe - Market size and forecast 2025-2030 ($ million)
Data Table on Europe - Market size and forecast 2025-2030 ($ million)
Chart on Europe - Year-over-year growth 2025-2030 (%)
Data Table on Europe - Year-over-year growth 2025-2030 (%)
Chart on Regional Comparison - Europe
Data Table on Regional Comparison - Europe

12.4.1 Germany - Market size and forecast 2025-2030

Chart on Germany - Market size and forecast 2025-2030 ($ million)
Data Table on Germany - Market size and forecast 2025-2030 ($ million)
Chart on Germany - Year-over-year growth 2025-2030 (%)
Data Table on Germany - Year-over-year growth 2025-2030 (%)

12.4.2 France - Market size and forecast 2025-2030

Chart on France - Market size and forecast 2025-2030 ($ million)
Data Table on France - Market size and forecast 2025-2030 ($ million)
Chart on France - Year-over-year growth 2025-2030 (%)
Data Table on France - Year-over-year growth 2025-2030 (%)

12.4.3 UK - Market size and forecast 2025-2030

Chart on UK - Market size and forecast 2025-2030 ($ million)
Data Table on UK - Market size and forecast 2025-2030 ($ million)
Chart on UK - Year-over-year growth 2025-2030 (%)
Data Table on UK - Year-over-year growth 2025-2030 (%)

12.4.4 Italy - Market size and forecast 2025-2030

Chart on Italy - Market size and forecast 2025-2030 ($ million)
Data Table on Italy - Market size and forecast 2025-2030 ($ million)
Chart on Italy - Year-over-year growth 2025-2030 (%)
Data Table on Italy - Year-over-year growth 2025-2030 (%)

12.4.5 Spain - Market size and forecast 2025-2030

Chart on Spain - Market size and forecast 2025-2030 ($ million)
Data Table on Spain - Market size and forecast 2025-2030 ($ million)
Chart on Spain - Year-over-year growth 2025-2030 (%)
Data Table on Spain - Year-over-year growth 2025-2030 (%)

12.4.6 The Netherlands - Market size and forecast 2025-2030

Chart on The Netherlands - Market size and forecast 2025-2030 ($ million)
Data Table on The Netherlands - Market size and forecast 2025-2030 ($ million)
Chart on The Netherlands - Year-over-year growth 2025-2030 (%)
Data Table on The Netherlands - Year-over-year growth 2025-2030 (%)

12.5 North America - Market size and forecast 2025-2030

Chart on North America - Market size and forecast 2025-2030 ($ million)
Data Table on North America - Market size and forecast 2025-2030 ($ million)
Chart on North America - Year-over-year growth 2025-2030 (%)
Data Table on North America - Year-over-year growth 2025-2030 (%)
Chart on Regional Comparison - North America
Data Table on Regional Comparison - North America

12.5.1 US - Market size and forecast 2025-2030

Chart on US - Market size and forecast 2025-2030 ($ million)
Data Table on US - Market size and forecast 2025-2030 ($ million)
Chart on US - Year-over-year growth 2025-2030 (%)
Data Table on US - Year-over-year growth 2025-2030 (%)

12.5.2 Canada - Market size and forecast 2025-2030

Chart on Canada - Market size and forecast 2025-2030 ($ million)
Data Table on Canada - Market size and forecast 2025-2030 ($ million)
Chart on Canada - Year-over-year growth 2025-2030 (%)
Data Table on Canada - Year-over-year growth 2025-2030 (%)

12.5.3 Mexico - Market size and forecast 2025-2030

Chart on Mexico - Market size and forecast 2025-2030 ($ million)
Data Table on Mexico - Market size and forecast 2025-2030 ($ million)
Chart on Mexico - Year-over-year growth 2025-2030 (%)
Data Table on Mexico - Year-over-year growth 2025-2030 (%)

12.6 Middle East and Africa - Market size and forecast 2025-2030

Chart on Middle East and Africa - Market size and forecast 2025-2030 ($ million)
Data Table on Middle East and Africa - Market size and forecast 2025-2030 ($ million)
Chart on Middle East and Africa - Year-over-year growth 2025-2030 (%)
Data Table on Middle East and Africa - Year-over-year growth 2025-2030 (%)
Chart on Regional Comparison - Middle East and Africa
Data Table on Regional Comparison - Middle East and Africa

12.6.1 Saudi Arabia - Market size and forecast 2025-2030

Chart on Saudi Arabia - Market size and forecast 2025-2030 ($ million)
Data Table on Saudi Arabia - Market size and forecast 2025-2030 ($ million)
Chart on Saudi Arabia - Year-over-year growth 2025-2030 (%)
Data Table on Saudi Arabia - Year-over-year growth 2025-2030 (%)

12.6.2 UAE - Market size and forecast 2025-2030

Chart on UAE - Market size and forecast 2025-2030 ($ million)
Data Table on UAE - Market size and forecast 2025-2030 ($ million)
Chart on UAE - Year-over-year growth 2025-2030 (%)
Data Table on UAE - Year-over-year growth 2025-2030 (%)

12.6.3 Israel - Market size and forecast 2025-2030

Chart on Israel - Market size and forecast 2025-2030 ($ million)
Data Table on Israel - Market size and forecast 2025-2030 ($ million)
Chart on Israel - Year-over-year growth 2025-2030 (%)
Data Table on Israel - Year-over-year growth 2025-2030 (%)

12.6.4 Turkey - Market size and forecast 2025-2030

Chart on Turkey - Market size and forecast 2025-2030 ($ million)
Data Table on Turkey - Market size and forecast 2025-2030 ($ million)
Chart on Turkey - Year-over-year growth 2025-2030 (%)
Data Table on Turkey - Year-over-year growth 2025-2030 (%)

12.6.5 South Africa - Market size and forecast 2025-2030

Chart on South Africa - Market size and forecast 2025-2030 ($ million)
Data Table on South Africa - Market size and forecast 2025-2030 ($ million)
Chart on South Africa - Year-over-year growth 2025-2030 (%)
Data Table on South Africa - Year-over-year growth 2025-2030 (%)

12.7 South America - Market size and forecast 2025-2030

Chart on South America - Market size and forecast 2025-2030 ($ million)
Data Table on South America - Market size and forecast 2025-2030 ($ million)
Chart on South America - Year-over-year growth 2025-2030 (%)
Data Table on South America - Year-over-year growth 2025-2030 (%)
Chart on Regional Comparison - South America
Data Table on Regional Comparison - South America

12.7.1 Brazil - Market size and forecast 2025-2030

Chart on Brazil - Market size and forecast 2025-2030 ($ million)
Data Table on Brazil - Market size and forecast 2025-2030 ($ million)
Chart on Brazil - Year-over-year growth 2025-2030 (%)
Data Table on Brazil - Year-over-year growth 2025-2030 (%)

12.7.2 Argentina - Market size and forecast 2025-2030

Chart on Argentina - Market size and forecast 2025-2030 ($ million)
Data Table on Argentina - Market size and forecast 2025-2030 ($ million)
Chart on Argentina - Year-over-year growth 2025-2030 (%)
Data Table on Argentina - Year-over-year growth 2025-2030 (%)

12.7.3 Chile - Market size and forecast 2025-2030

Chart on Chile - Market size and forecast 2025-2030 ($ million)
Data Table on Chile - Market size and forecast 2025-2030 ($ million)
Chart on Chile - Year-over-year growth 2025-2030 (%)
Data Table on Chile - Year-over-year growth 2025-2030 (%)

12.8 Market opportunity by geography

Market opportunity by geography ($ million)
Data Tables on Market opportunity by geography ($ million)

13. Drivers, Challenges, and Opportunity

13.1 Market drivers

Critical shortages of labor and demographic shifts
Advancements in artificial intelligence and machine vision
Strategic imperatives for supply chain resilience

13.2 Market challenges

Interoperability hurdles and legacy infrastructure integration conflicts
Severe shortages in specialized robotics engineering talent
Escalating regulatory rigor and safety compliance standards

13.3 Impact of drivers and challenges

Impact of drivers and challenges in 2025 and 2030

13.4 Market opportunities

Proliferation of swarm robotics and decentralized intelligence
Integration of agentic AI and vision-language models
Convergence of IT and OT in versatile robotics

14. Competitive Landscape

14.1 Overview

14.2

Overview on criticality of inputs and factors of differentiation

14.3 Landscape disruption

Overview on factors of disruption

14.4 Industry risks

Impact of key risks on business

15. Competitive Analysis

15.1 Companies profiled

Companies covered

15.2 Company ranking index

15.3 Market positioning of companies

Matrix on companies position and classification

15.4 ABB Ltd.

ABB Ltd. - Overview
ABB Ltd. - Business segments
ABB Ltd. - Key offerings
ABB Ltd. - Segment focus
SWOT

15.5 Comau SpA

Comau SpA - Overview
Comau SpA - Product / Service
Comau SpA - Key offerings
SWOT

15.6 DENSO Corp.

DENSO Corp. - Overview
DENSO Corp. - Business segments
DENSO Corp. - Key offerings
DENSO Corp. - Segment focus
SWOT

15.7 FANUC Corp.

FANUC Corp. - Overview
FANUC Corp. - Product / Service
FANUC Corp. - Key news
FANUC Corp. - Key offerings
SWOT

15.8 HD Hyundai Robotics

HD Hyundai Robotics - Overview
HD Hyundai Robotics - Product / Service
HD Hyundai Robotics - Key offerings
SWOT

15.9 Intuitive Surgical Inc.

Intuitive Surgical Inc. - Overview
Intuitive Surgical Inc. - Product / Service
Intuitive Surgical Inc. - Key offerings
SWOT

15.10 Kawasaki Robotics USA Inc.

Kawasaki Robotics USA Inc. - Overview
Kawasaki Robotics USA Inc. - Product / Service
Kawasaki Robotics USA Inc. - Key offerings
SWOT

15.11 KUKA AG

KUKA AG - Overview
KUKA AG - Product / Service
KUKA AG - Key offerings
SWOT

15.12 Mitsubishi Electric Corp.

Mitsubishi Electric Corp. - Overview
Mitsubishi Electric Corp. - Business segments
Mitsubishi Electric Corp. - Key offerings
Mitsubishi Electric Corp. - Segment focus
SWOT

15.13 Nachi Fujikoshi Corp.

Nachi Fujikoshi Corp. - Overview
Nachi Fujikoshi Corp. - Business segments
Nachi Fujikoshi Corp. - Key offerings
Nachi Fujikoshi Corp. - Segment focus
SWOT

15.14 OMRON Corp.

OMRON Corp. - Overview
OMRON Corp. - Business segments
OMRON Corp. - Key offerings
OMRON Corp. - Segment focus
SWOT

15.15 Seiko Epson Corp.

Seiko Epson Corp. - Overview
Seiko Epson Corp. - Business segments
Seiko Epson Corp. - Key offerings
Seiko Epson Corp. - Segment focus
SWOT

15.16 Staubli International

Staubli International - Overview
Staubli International - Product / Service
Staubli International - Key offerings
SWOT

15.17 UBTECH ROBOTICS CORP LTD

UBTECH ROBOTICS CORP LTD - Overview
UBTECH ROBOTICS CORP LTD - Product / Service
UBTECH ROBOTICS CORP LTD - Key offerings
SWOT

15.18 Yaskawa Electric Corp.

Yaskawa Electric Corp. - Overview
Yaskawa Electric Corp. - Business segments
Yaskawa Electric Corp. - Key offerings
Yaskawa Electric Corp. - Segment focus
SWOT

16. Appendix

16.1 Scope of the report

Market definition
Objectives
Notes and caveats

16.2 Inclusions and exclusions checklist

Inclusions checklist
Exclusions checklist

16.3 Currency conversion rates for US$

16.4 Research methodology

16.5 Data procurement

Information sources

16.6 Data validation

16.7 Validation techniques employed for market sizing

16.8 Data synthesis

16.9 360 degree market analysis

16.10 List of abbreviations

Research Methodology

Technavio presents a detailed picture of the market by way of study, synthesis, and summation of data from multiple sources. The analysts have presented the various facets of the market with a particular focus on identifying the key industry influencers. The data thus presented is comprehensive, reliable, and the result of extensive research, both primary and secondary.

INFORMATION SOURCES

Primary sources

  • Manufacturers and suppliers
  • Channel partners
  • Industry experts
  • Strategic decision makers

Secondary sources

  • Industry journals and periodicals
  • Government data
  • Financial reports of key industry players
  • Historical data
  • Press releases

DATA ANALYSIS

Data Synthesis

  • Collation of data
  • Estimation of key figures
  • Analysis of derived insights

Data Validation

  • Triangulation with data models
  • Reference against proprietary databases
  • Corroboration with industry experts

REPORT WRITING

Qualitative

  • Market drivers
  • Market challenges
  • Market trends
  • Five forces analysis

Quantitative

  • Market size and forecast
  • Market segmentation
  • Geographical insights
  • Competitive landscape

Interested in this report?

Get your sample now to see our research methodology and insights!

Download Now

Frequently Asked Questions

Robotics market growth will increase by USD 21636.4 million during 2026-2030.

The Robotics market is expected to grow at a CAGR of 6.6% during 2026-2030.

Robotics market is segmented by Application (Industrial, Services) End-user (Manufacturing, Healthcare, Aerospace and defense, Media and entertainment, Others) Component (Hardware, Software, Services)

ABB Ltd., Agility Robotics Inc., Apptronik Inc., Boston Dynamics Inc., Comau SpA, DENSO Corp., FANUC Corp., Grey Orange Pte. Ltd., HD Hyundai Robotics, Intuitive Surgical Inc., Kawasaki Robotics USA Inc., KUKA AG, Mitsubishi Electric Corp., Nachi Fujikoshi Corp., OMRON Corp., Seiko Epson Corp., Staubli International, UBTECH ROBOTICS CORP LTD, Universal Robots AS, Yaskawa Electric Corp. are a few of the key vendors in the Robotics market.

APAC will register the highest growth rate of 56.7% among the other regions. Therefore, the Robotics market in APAC is expected to garner significant business opportunities for the vendors during the forecast period.

China, Japan, South Korea, India, Australia, Indonesia, Germany, France, UK, Italy, Spain, The Netherlands, US, Canada, Mexico, Saudi Arabia, UAE, Israel, Turkey, South Africa, Brazil, Argentina, Chile

  • Critical shortages of labor and demographic shifts is the driving factor this market.

The Robotics market vendors should focus on grabbing business opportunities from the Application segment as it accounted for the largest market share in the base year.
RIA - Research AI Assistant
Ask RIA