Smart Container Market Analysis, Size, and Forecast 2026-2030: APAC (China, India, and Japan), Europe (Germany, The Netherlands, and UK), North America (US, Canada, and Mexico), South America (Brazil, Argentina, and Colombia), Middle East and Africa (UAE, Saudi Arabia, and South Africa), and Rest of World (ROW)

Smart Container Market Analysis, Size, and Forecast 2026-2030:
APAC (China, India, and Japan), Europe (Germany, The Netherlands, and UK), North America (US, Canada, and Mexico), South America (Brazil, Argentina, and Colombia), Middle East and Africa (UAE, Saudi Arabia, and South Africa), and Rest of World (ROW)

Published: Mar 2026 303 Pages SKU: IRTNTR81276

Market Overview at a Glance

$8.67 B
Market Opportunity
19.1%
CAGR 2025 - 2030
42%
APAC Growth
$2.36 B
Hardware segment 2024

Smart Container Market Size 2026-2030

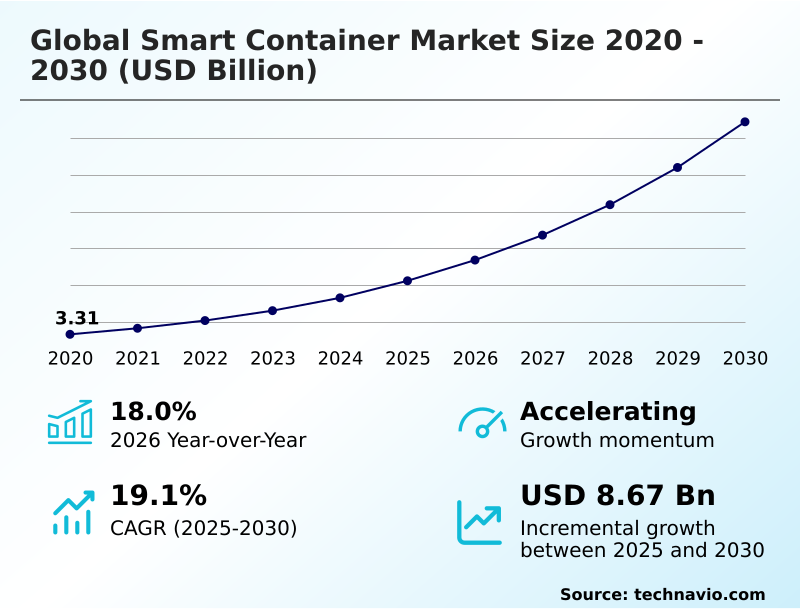
The smart container market size is valued to increase by USD 8.67 billion, at a CAGR of 19.1% from 2025 to 2030. Accelerated Integration of advanced telematics in global logistics will drive the smart container market.

Major Market Trends & Insights

  • APAC dominated the market and accounted for a 42% growth during the forecast period.
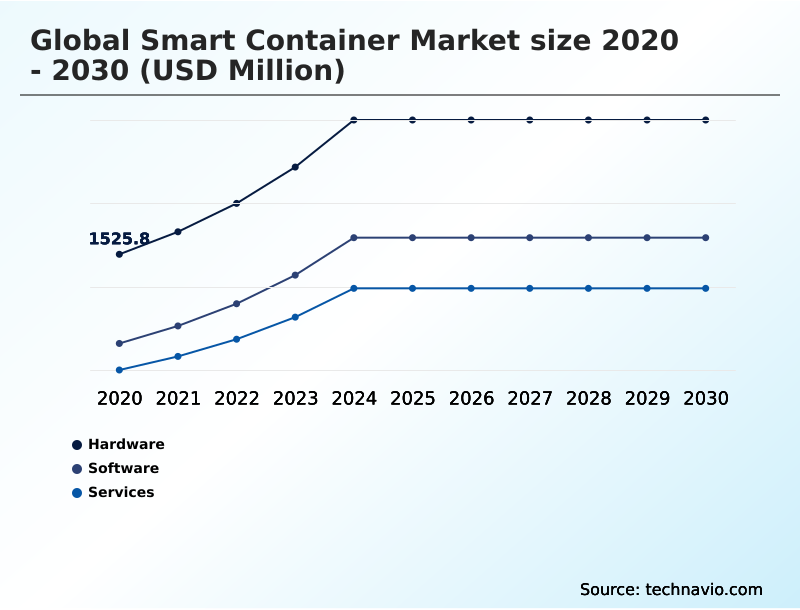
  • By Component - Hardware segment was valued at USD 2.36 billion in 2024
  • By End-user - Food and beverage segment accounted for the largest market revenue share in 2024

Market Size & Forecast

  • Market Opportunities: USD 11.60 billion
  • Market Future Opportunities: USD 8.67 billion
  • CAGR from 2025 to 2030 : 19.1%

Market Summary

  • The smart container market is fundamentally reshaping logistics through the integration of advanced technologies that enable unprecedented supply chain visibility. By embedding units with IoT telematics solutions and environmental sensor data collectors, stakeholders gain real-time asset tracking and cargo condition monitoring.
  • This capability is critical for industries handling high-value or sensitive goods, such as pharmaceuticals and perishables, where cold chain integrity is paramount. For example, a shipper of biologics can leverage remote temperature control and receive immediate alerts for any deviation, preventing costly spoilage and ensuring regulatory compliance.
  • The market's momentum is driven by the need for operational efficiency, with AI-driven analytics platforms transforming raw data from multi-sensor data fusion into actionable insights for predictive maintenance alerts and asset utilization optimization. However, challenges surrounding telematics hardware integration, data standardization, and cybersecurity persist.
  • As the industry moves toward greater supply chain automation tech, the focus is on creating interoperable, secure systems that reduce detention and demurrage, optimize empty container repositioning, and provide a verifiable, tamper-proof data log for every shipment, often leveraging blockchain for supply chain enhancements. This digital transformation is paving the way for more resilient, predictable, and sustainable global trade.

What will be the Size of the Smart Container Market during the forecast period?

Get Key Insights on Market Forecast (PDF) Request Free Sample

How is the Smart Container Market Segmented?

The smart container industry research report provides comprehensive data (region-wise segment analysis), with forecasts and estimates in "USD million" for the period 2026-2030, as well as historical data from 2020-2024 for the following segments.

  • Component
    • Hardware
    • Software
    • Services
  • End-user
    • Food and beverage
    • Pharmaceuticals
    • Chemicals
    • Oil and gas
    • Others
  • Type
    • Smart dry containers
    • Smart refrigerated container
    • Smart tank containers
    • Open-top and flat rack
  • Geography
    • APAC
      • China
      • India
      • Japan
    • Europe
      • Germany
      • The Netherlands
      • UK
    • North America
      • US
      • Canada
      • Mexico
    • South America
      • Brazil
      • Argentina
      • Colombia
    • Middle East and Africa
      • UAE
      • Saudi Arabia
      • South Africa
    • Rest of World (ROW)

By Component Insights

The hardware segment is estimated to witness significant growth during the forecast period.

The hardware segment is foundational, enabling real-time asset tracking through advanced telematics systems and telematics hardware integration.

It comprises a range of smart container IoT devices, including sensors for shock and vibration detection and modules for satellite connectivity and low-power wide-area networks (LPWAN).

The evolution of multi-sensor data fusion and edge computing in logistics allows for on-device processing, enhancing real-time container visibility.

These IoT telematics solutions are crucial for maritime logistics technology and port automation technology, with some integrated systems improving data accuracy by over 15%, directly supporting the market’s shift towards more connected and intelligent operations.

Request Free Sample

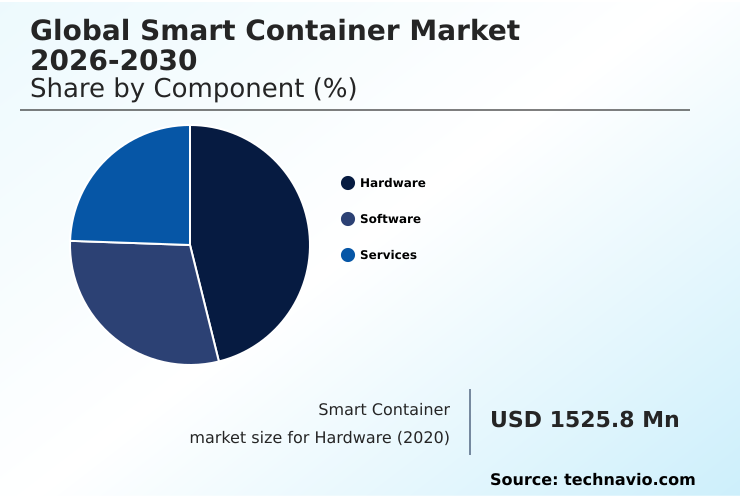
The Hardware segment was valued at USD 2.36 billion in 2024 and showed a gradual increase during the forecast period.

Request Free Sample

Regional Analysis

APAC is estimated to contribute 42% to the growth of the global market during the forecast period.Technavio’s analysts have elaborately explained the regional trends and drivers that shape the market during the forecast period.

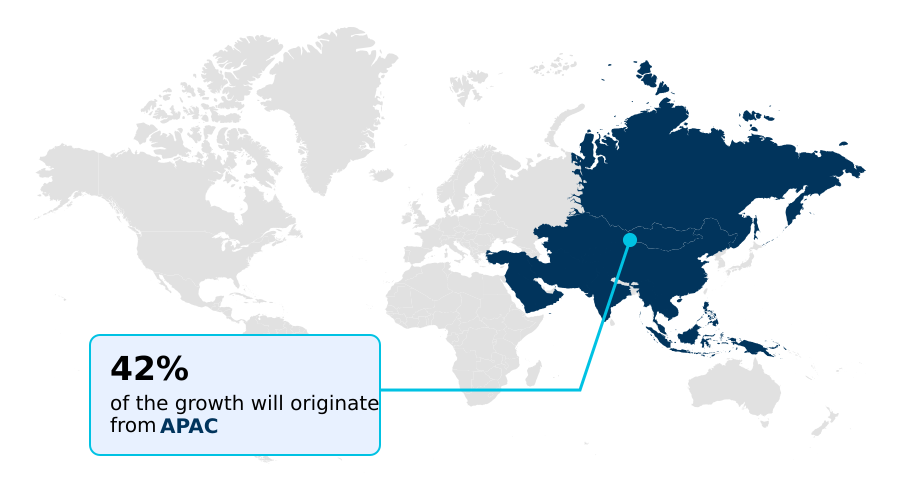
See How Smart Container Market Demand is Rising in APAC Request Free Sample

The market's geographic dynamics are shaped by regional priorities. In APAC, the focus is on supply chain automation tech and digital freight tracking for high-volume intermodal container tracking to support its manufacturing hubs.

North America and Europe prioritize sustainable logistics technology and supply chain visibility, using cloud-based logistics platforms for advanced cargo condition monitoring. South America leverages reefer container telematics to protect agricultural exports, monitoring environmental sensor data closely.

Across all regions, the push for automated customs clearance and better IoT in intermodal transport drives the adoption of global asset tracking solutions to manage complex, international supply chains effectively, with APAC poised to contribute over 42% of market growth.

Market Dynamics

Our researchers analyzed the data with 2025 as the base year, along with the key drivers, trends, and challenges. A holistic analysis of drivers will help companies refine their marketing strategies to gain a competitive advantage.

  • Strategic decision-making in the smart container market increasingly hinges on specific applications and ROI calculations. For instance, using AI for empty container repositioning is a primary focus for carriers looking to reduce operational waste. In specialized verticals, real-time temperature monitoring for pharmaceuticals is non-negotiable for ensuring efficacy and compliance.
  • The impact of 5G on smart container connectivity is a critical consideration, promising lower latency and higher data throughput, which directly benefits blockchain applications in container shipping by enabling faster, more secure ledger updates. The benefits of IoT in cold chain logistics are well-documented, leading to a direct reduction in spoilage and insurance claims.
  • Shippers are now analyzing how to reduce demurrage with smart containers, as automated gate-in/gate-out processes cut down port dwell times. This ties into the broader goal of improving asset utilization in shipping, a key performance metric for fleet owners.
  • However, executives must also address the significant cybersecurity risks in smart container technology, which demand robust encryption and access controls, particularly for smart container solutions for hazardous materials. Calculating the ROI of implementing smart container fleets remains a crucial step, often involving a detailed analysis before integrating smart containers with TMS software.
  • For reefers, best practices for smart reefer management involve using telematics data for predictive maintenance, moving from reactive repairs to proactive servicing. When selecting hardware, LPWAN vs satellite for container tracking presents a trade-off between cost and coverage, influencing strategies for enhancing supply chain security with sensors.
  • This is especially relevant for smart container technology for perishable exports, where continuous connectivity is vital. Finally, the challenges of smart container interoperability and the role of smart containers in sustainable logistics are top-of-mind, as the industry moves toward automating customs processes with container data and seeks standardized platforms.
  • In comparing solutions, many stakeholders evaluate by comparing smart container hardware providers to find the best fit for their operational needs.

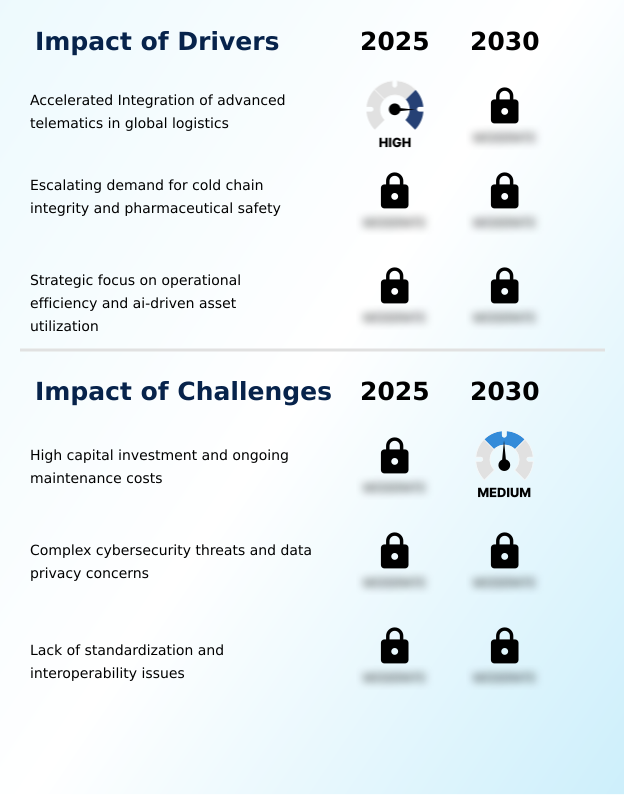
What are the key market drivers leading to the rise in the adoption of Smart Container Industry?

  • The accelerated integration of advanced telematics and IoT technologies across the global logistics sector is a key driver for market growth, meeting the demand for real-time visibility.

  • The demand for absolute cold chain integrity is a major driver, particularly in food and beverage logistics, where perishable goods transport requires constant monitoring. Cold chain logistics solutions prevent significant product loss.
  • A second driver is the pursuit of operational efficiency through asset utilization optimization. Logistics efficiency tools leverage data for predictive maintenance alerts and to streamline empty container repositioning, cutting operational costs by over 12%.
  • The use of geofencing and route deviation alerts, along with real-time freight monitoring from a supply chain control tower, contributes to detention and demurrage reduction and supports automated port operations through digital twin simulation.

What are the market trends shaping the Smart Container Industry?

  • The convergence of artificial intelligence and blockchain technology is an emerging trend, poised to enhance supply chain transparency. This integration establishes immutable trust and predictive capabilities across logistical networks.

  • A key trend is the convergence of AI-driven analytics platforms with blockchain for supply chain integrity, enabling tamper-proof data logging and predictive supply chain analytics. This supply chain digitalization is advancing intelligent asset management and the broader container lifecycle management. The proliferation of smart reefer technology and zero-maintenance IoT sensors, especially for IoT for chemical transport, is transforming specialized logistics.
  • As part of this shift, smart logistics platforms and connected shipping containers are delivering enhanced control, with some fleets achieving a 15% reduction in their carbon footprint calculation.

What challenges does the Smart Container Industry face during its growth?

  • The high capital investment required for implementation, coupled with ongoing maintenance and data subscription costs, presents a key challenge to the widespread adoption of smart containers.

  • Significant challenges include the need for robust supply chain risk mitigation strategies against cybersecurity threats inherent in digital container shipping. Effective container security systems are vital for secure cargo transport, especially for pharmaceutical supply chain security and the movement of hazardous materials transport.
  • Breaches in systems with GPS tracking capabilities could expose data or lead to theft, while false door opening sensor alerts can create operational friction. Furthermore, a lack of standardization complicates the integration of fleet management software and remote asset monitoring, creating data silos that challenge pharmaceutical tracking compliance and comprehensive smart container data analytics for refrigerated container monitoring.
  • These issues can impede ROI for carriers.

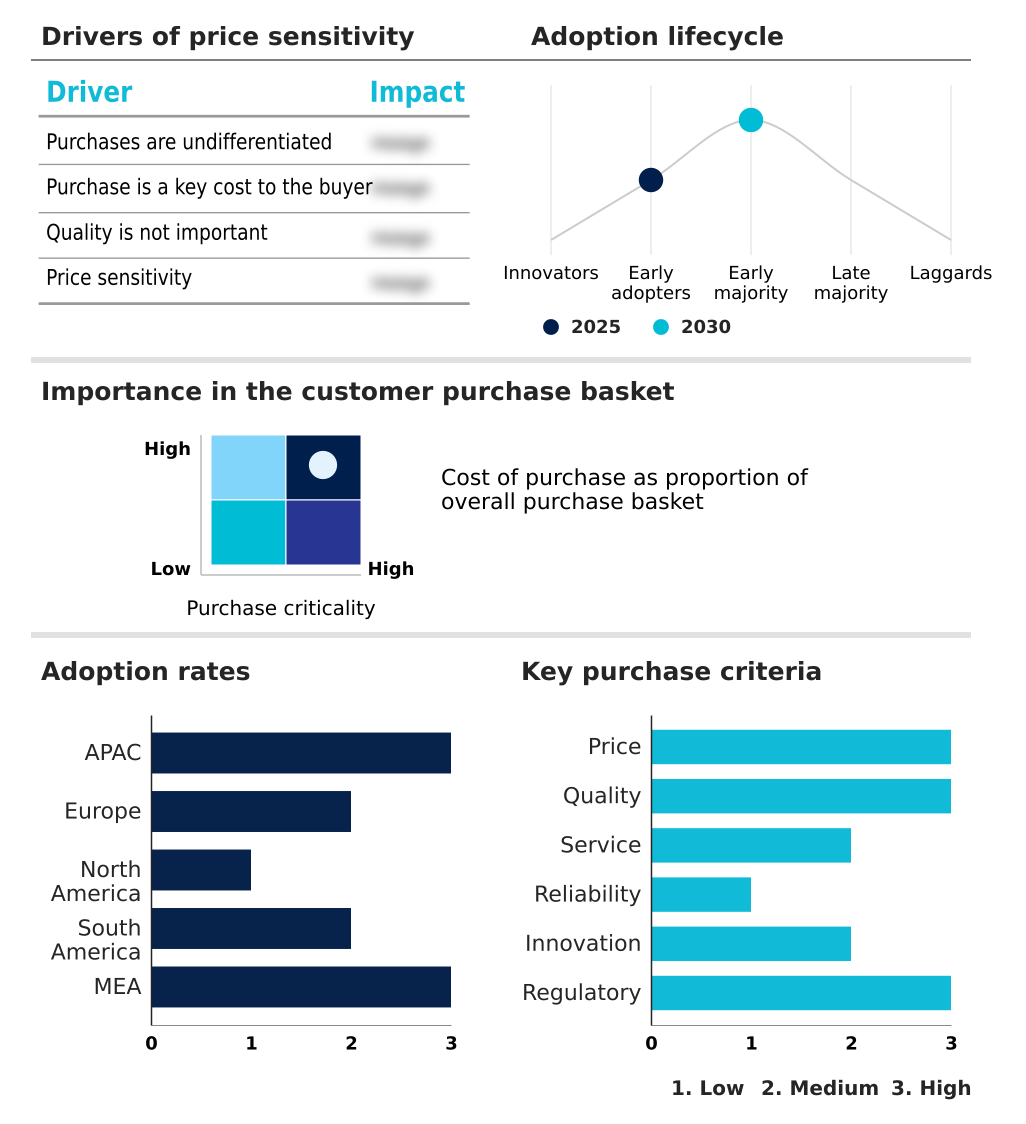
Exclusive Technavio Analysis on Customer Landscape

The smart container market forecasting report includes the adoption lifecycle of the market, covering from the innovator’s stage to the laggard’s stage. It focuses on adoption rates in different regions based on penetration. Furthermore, the smart container market report also includes key purchase criteria and drivers of price sensitivity to help companies evaluate and develop their market growth analysis strategies.

Customer Landscape of Smart Container Industry

Competitive Landscape

Companies are implementing various strategies, such as strategic alliances, smart container market forecast, partnerships, mergers and acquisitions, geographical expansion, and product/service launches, to enhance their presence in the industry.

Aeler Technologies - Next-generation composite containers integrating embedded sensors and AI are engineered to safeguard high-value, sensitive cargo, enhancing supply chain integrity and asset protection.

The industry research and growth report includes detailed analyses of the competitive landscape of the market and information about key companies, including:

  • Aeler Technologies
  • BlackBerry Ltd.
  • CalAmp Corp.
  • Carrier Global Corp.
  • Daikin Industries Ltd.
  • Dwyer Instruments LLC
  • Emerson Electric Co.
  • Envirotainer AB
  • Geotab Inc.
  • Globe Tracker, ApS.
  • Logiwa Inc.
  • Nexxiot
  • ORBCOMM Inc.
  • Phillips Connect
  • Ramco Systems Ltd.
  • Thermo King
  • TRAXENS
  • Triton International Ltd
  • Unilode Aviation Solutions
  • ZillionSource Technologies

Qualitative and quantitative analysis of companies has been conducted to help clients understand the wider business environment as well as the strengths and weaknesses of key industry players. Data is qualitatively analyzed to categorize companies as pure play, category-focused, industry-focused, and diversified; it is quantitatively analyzed to categorize companies as dominant, leading, strong, tentative, and weak.

Recent Development and News in Smart container market

  • In May 2025, a cybersecurity advisory report was issued, identifying a significant vulnerability in a legacy data transmission protocol commonly used by smart containers, prompting calls for immediate firmware updates across European and North American logistics networks.
  • In April 2025, a leading global chemical logistics association established a new industry standard that mandates real-time pressure monitoring for all Class 3 flammable liquids transported in smart tank containers to mitigate fire risks.
  • In March 2025, Maersk announced a strategic collaboration with IBM to deploy a new generation of AI-driven smart containers designed to optimize fuel usage and reduce carbon emissions on its Pacific routes.
  • In February 2025, Hapag-Lloyd confirmed the completion of its fleet-wide initiative to equip its entire standard container fleet with smart tracking devices, establishing full real-time visibility for its assets.

Dive into Technavio’s robust research methodology, blending expert interviews, extensive data synthesis, and validated models for unparalleled Smart Container Market insights. See full methodology.

Market Scope
Page number 303
Base year 2025
Historic period 2020-2024
Forecast period 2026-2030
Growth momentum & CAGR Accelerate at a CAGR of 19.1%
Market growth 2026-2030 USD 8671.7 million
Market structure Fragmented
YoY growth 2025-2026(%) 18.0%
Key countries China, India, Japan, South Korea, Australia, Indonesia, Germany, The Netherlands, UK, France, Italy, Spain, US, Canada, Mexico, Brazil, Argentina, Colombia, UAE, Saudi Arabia, South Africa, Turkey and Israel
Competitive landscape Leading Companies, Market Positioning of Companies, Competitive Strategies, and Industry Risks

Request Free Sample

Research Analyst Overview

  • The smart container market is undergoing a significant transformation, driven by the need for granular supply chain visibility and intelligent asset management. The core of this evolution lies in advanced telematics hardware integration, enabling real-time asset tracking and comprehensive cargo condition monitoring through multi-sensor data fusion.
  • For instance, IoT telematics solutions provide critical environmental sensor data, essential for maintaining cold chain integrity for perishable goods transport and ensuring pharmaceutical supply chain security. Stakeholders leverage this data for predictive maintenance alerts and asset utilization optimization, which is crucial for detention and demurrage reduction.
  • The technology, which includes everything from shock and vibration detection to door opening sensor alerts, is supported by both low-power wide-area networks (LPWAN) and satellite connectivity modules. Advanced systems utilize geofencing and route deviation notifications for supply chain risk mitigation. The data is often secured via tamper-proof data logging, with some firms exploring blockchain for supply chain integrity.
  • On the software side, an AI-driven analytics platform and cloud-based logistics platform are used for fleet management software and digital twin simulation. This allows for sophisticated carbon footprint calculation, with some operators achieving a 15% reduction in emissions. The push for efficiency is also seen in smart reefer technology, unit load device (ULD) tracking, and solutions for hazardous materials transport.
  • Ultimately, the goal is container lifecycle management through zero-maintenance IoT sensors, paving the way for automated customs clearance.

What are the Key Data Covered in this Smart Container Market Research and Growth Report?

  • What is the expected growth of the Smart Container Market between 2026 and 2030?

    • USD 8.67 billion, at a CAGR of 19.1%

  • What segmentation does the market report cover?

    • The report is segmented by Component (Hardware, Software, and Services), End-user (Food and beverage, Pharmaceuticals, Chemicals, Oil and gas, and Others), Type (Smart dry containers, Smart refrigerated container, Smart tank containers, and Open-top and flat rack) and Geography (APAC, Europe, North America, South America, Middle East and Africa)

  • Which regions are analyzed in the report?

    • APAC, Europe, North America, South America and Middle East and Africa

  • What are the key growth drivers and market challenges?

    • Accelerated Integration of advanced telematics in global logistics, High capital investment and ongoing maintenance costs

  • Who are the major players in the Smart Container Market?

    • Aeler Technologies, BlackBerry Ltd., CalAmp Corp., Carrier Global Corp., Daikin Industries Ltd., Dwyer Instruments LLC, Emerson Electric Co., Envirotainer AB, Geotab Inc., Globe Tracker, ApS., Logiwa Inc., Nexxiot, ORBCOMM Inc., Phillips Connect, Ramco Systems Ltd., Thermo King, TRAXENS, Triton International Ltd, Unilode Aviation Solutions and ZillionSource Technologies

Market Research Insights

  • The market is defined by a strategic shift toward intelligent asset management, where connected shipping containers are no longer passive assets but active data-generating nodes in the digital supply chain.
  • Real-time container visibility, enabled by smart container IoT devices, allows companies to achieve significant operational gains; for instance, integrated digital freight tracking systems have been shown to reduce port drayage wait times by up to 20%. The adoption of advanced telematics systems is critical in specialized segments like cold chain logistics solutions, where maintaining cargo integrity is non-negotiable.
  • As supply chain automation tech matures, firms are leveraging smart container data analytics to optimize routes and asset utilization, with some achieving a 15% reduction in carbon emissions through dynamic adjustments. This focus on verifiable ROI underscores the move from basic tracking to predictive supply chain analytics for proactive risk management.

We can help! Our analysts can customize this smart container market research report to meet your requirements.

Get in touch

1. Executive Summary

1.1 Market overview

Executive Summary - Chart on Market Overview
Executive Summary - Data Table on Market Overview
Executive Summary - Chart on Global Market Characteristics
Executive Summary - Chart on Market by Geography
Executive Summary - Chart on Market Segmentation by Component
Executive Summary - Chart on Market Segmentation by End-user
Executive Summary - Chart on Market Segmentation by Type
Executive Summary - Chart on Incremental Growth
Executive Summary - Data Table on Incremental Growth
Executive Summary - Chart on Company Market Positioning

2. Technavio Analysis

2.1 Analysis of price sensitivity, lifecycle, customer purchase basket, adoption rates, and purchase criteria

2.2 Criticality of inputs and Factors of differentiation

Chart on Overview on criticality of inputs and factors of differentiation

2.3 Factors of disruption

Chart on Overview on factors of disruption

2.4 Impact of drivers and challenges

Chart on Impact of drivers and challenges in 2025 and 2030

3. Market Landscape

3.1 Market ecosystem

Chart on Parent Market
Data Table on - Parent Market

3.2 Market characteristics

Chart on Market characteristics analysis

3.3 Value chain analysis

Chart on Value chain analysis

4. Market Sizing

4.1 Market definition

Data Table on Offerings of companies included in the market definition

4.2 Market segment analysis

Market segments

4.3 Market size 2025

4.4 Market outlook: Forecast for 2025-2030

Chart on Global - Market size and forecast 2025-2030 ($ million)
Data Table on Global - Market size and forecast 2025-2030 ($ million)
Chart on Global Market: Year-over-year growth 2025-2030 (%)
Data Table on Global Market: Year-over-year growth 2025-2030 (%)

5. Historic Market Size

5.1 Global Smart Container Market 2020 - 2024

Historic Market Size - Data Table on Global Smart Container Market 2020 - 2024 ($ million)

5.2 Component segment analysis 2020 - 2024

Historic Market Size - Component Segment 2020 - 2024 ($ million)

5.3 End-user segment analysis 2020 - 2024

Historic Market Size - End-user Segment 2020 - 2024 ($ million)

5.4 Type segment analysis 2020 - 2024

Historic Market Size - Type Segment 2020 - 2024 ($ million)

5.5 Geography segment analysis 2020 - 2024

Historic Market Size - Geography Segment 2020 - 2024 ($ million)

5.6 Country segment analysis 2020 - 2024

Historic Market Size - Country Segment 2020 - 2024 ($ million)

6. Qualitative Analysis

6.1 Impact of AI on Global Smart Container Market

7. Five Forces Analysis

7.1 Five forces summary

Five forces analysis - Comparison between 2025 and 2030

7.2 Bargaining power of buyers

Bargaining power of buyers - Impact of key factors 2025 and 2030

7.3 Bargaining power of suppliers

Bargaining power of suppliers - Impact of key factors in 2025 and 2030

7.4 Threat of new entrants

Threat of new entrants - Impact of key factors in 2025 and 2030

7.5 Threat of substitutes

Threat of substitutes - Impact of key factors in 2025 and 2030

7.6 Threat of rivalry

Threat of rivalry - Impact of key factors in 2025 and 2030

7.7 Market condition

Chart on Market condition - Five forces 2025 and 2030

8. Market Segmentation by Component

8.1 Market segments

Chart on Component - Market share 2025-2030 (%)
Data Table on Component - Market share 2025-2030 (%)

8.2 Comparison by Component

Chart on Comparison by Component
Data Table on Comparison by Component

8.3 Hardware - Market size and forecast 2025-2030

Chart on Hardware - Market size and forecast 2025-2030 ($ million)
Data Table on Hardware - Market size and forecast 2025-2030 ($ million)
Chart on Hardware - Year-over-year growth 2025-2030 (%)
Data Table on Hardware - Year-over-year growth 2025-2030 (%)

8.4 Software - Market size and forecast 2025-2030

Chart on Software - Market size and forecast 2025-2030 ($ million)
Data Table on Software - Market size and forecast 2025-2030 ($ million)
Chart on Software - Year-over-year growth 2025-2030 (%)
Data Table on Software - Year-over-year growth 2025-2030 (%)

8.5 Services - Market size and forecast 2025-2030

Chart on Services - Market size and forecast 2025-2030 ($ million)
Data Table on Services - Market size and forecast 2025-2030 ($ million)
Chart on Services - Year-over-year growth 2025-2030 (%)
Data Table on Services - Year-over-year growth 2025-2030 (%)

8.6 Market opportunity by Component

Market opportunity by Component ($ million)
Data Table on Market opportunity by Component ($ million)

9. Market Segmentation by End-user

9.1 Market segments

Chart on End-user - Market share 2025-2030 (%)
Data Table on End-user - Market share 2025-2030 (%)

9.2 Comparison by End-user

Chart on Comparison by End-user
Data Table on Comparison by End-user

9.3 Food and beverage - Market size and forecast 2025-2030

Chart on Food and beverage - Market size and forecast 2025-2030 ($ million)
Data Table on Food and beverage - Market size and forecast 2025-2030 ($ million)
Chart on Food and beverage - Year-over-year growth 2025-2030 (%)
Data Table on Food and beverage - Year-over-year growth 2025-2030 (%)

9.4 Pharmaceuticals - Market size and forecast 2025-2030

Chart on Pharmaceuticals - Market size and forecast 2025-2030 ($ million)
Data Table on Pharmaceuticals - Market size and forecast 2025-2030 ($ million)
Chart on Pharmaceuticals - Year-over-year growth 2025-2030 (%)
Data Table on Pharmaceuticals - Year-over-year growth 2025-2030 (%)

9.5 Chemicals - Market size and forecast 2025-2030

Chart on Chemicals - Market size and forecast 2025-2030 ($ million)
Data Table on Chemicals - Market size and forecast 2025-2030 ($ million)
Chart on Chemicals - Year-over-year growth 2025-2030 (%)
Data Table on Chemicals - Year-over-year growth 2025-2030 (%)

9.6 Oil and gas - Market size and forecast 2025-2030

Chart on Oil and gas - Market size and forecast 2025-2030 ($ million)
Data Table on Oil and gas - Market size and forecast 2025-2030 ($ million)
Chart on Oil and gas - Year-over-year growth 2025-2030 (%)
Data Table on Oil and gas - Year-over-year growth 2025-2030 (%)

9.7 Others - Market size and forecast 2025-2030

Chart on Others - Market size and forecast 2025-2030 ($ million)
Data Table on Others - Market size and forecast 2025-2030 ($ million)
Chart on Others - Year-over-year growth 2025-2030 (%)
Data Table on Others - Year-over-year growth 2025-2030 (%)

9.8 Market opportunity by End-user

Market opportunity by End-user ($ million)
Data Table on Market opportunity by End-user ($ million)

10. Market Segmentation by Type

10.1 Market segments

Chart on Type - Market share 2025-2030 (%)
Data Table on Type - Market share 2025-2030 (%)

10.2 Comparison by Type

Chart on Comparison by Type
Data Table on Comparison by Type

10.3 Smart dry containers - Market size and forecast 2025-2030

Chart on Smart dry containers - Market size and forecast 2025-2030 ($ million)
Data Table on Smart dry containers - Market size and forecast 2025-2030 ($ million)
Chart on Smart dry containers - Year-over-year growth 2025-2030 (%)
Data Table on Smart dry containers - Year-over-year growth 2025-2030 (%)

10.4 Smart refrigerated container - Market size and forecast 2025-2030

Chart on Smart refrigerated container - Market size and forecast 2025-2030 ($ million)
Data Table on Smart refrigerated container - Market size and forecast 2025-2030 ($ million)
Chart on Smart refrigerated container - Year-over-year growth 2025-2030 (%)
Data Table on Smart refrigerated container - Year-over-year growth 2025-2030 (%)

10.5 Smart tank containers - Market size and forecast 2025-2030

Chart on Smart tank containers - Market size and forecast 2025-2030 ($ million)
Data Table on Smart tank containers - Market size and forecast 2025-2030 ($ million)
Chart on Smart tank containers - Year-over-year growth 2025-2030 (%)
Data Table on Smart tank containers - Year-over-year growth 2025-2030 (%)

10.6 Open-top and flat rack - Market size and forecast 2025-2030

Chart on Open-top and flat rack - Market size and forecast 2025-2030 ($ million)
Data Table on Open-top and flat rack - Market size and forecast 2025-2030 ($ million)
Chart on Open-top and flat rack - Year-over-year growth 2025-2030 (%)
Data Table on Open-top and flat rack - Year-over-year growth 2025-2030 (%)

10.7 Market opportunity by Type

Market opportunity by Type ($ million)
Data Table on Market opportunity by Type ($ million)

11. Customer Landscape

11.1 Customer landscape overview

Analysis of price sensitivity, lifecycle, customer purchase basket, adoption rates, and purchase criteria

12. Geographic Landscape

12.1 Geographic segmentation

Chart on Market share by geography 2025-2030 (%)
Data Table on Market share by geography 2025-2030 (%)

12.2 Geographic comparison

Chart on Geographic comparison
Data Table on Geographic comparison

12.3 APAC - Market size and forecast 2025-2030

Chart on APAC - Market size and forecast 2025-2030 ($ million)
Data Table on APAC - Market size and forecast 2025-2030 ($ million)
Chart on APAC - Year-over-year growth 2025-2030 (%)
Data Table on APAC - Year-over-year growth 2025-2030 (%)
Chart on Regional Comparison - APAC
Data Table on Regional Comparison - APAC

12.3.1 China - Market size and forecast 2025-2030

Chart on China - Market size and forecast 2025-2030 ($ million)
Data Table on China - Market size and forecast 2025-2030 ($ million)
Chart on China - Year-over-year growth 2025-2030 (%)
Data Table on China - Year-over-year growth 2025-2030 (%)

12.3.2 India - Market size and forecast 2025-2030

Chart on India - Market size and forecast 2025-2030 ($ million)
Data Table on India - Market size and forecast 2025-2030 ($ million)
Chart on India - Year-over-year growth 2025-2030 (%)
Data Table on India - Year-over-year growth 2025-2030 (%)

12.3.3 Japan - Market size and forecast 2025-2030

Chart on Japan - Market size and forecast 2025-2030 ($ million)
Data Table on Japan - Market size and forecast 2025-2030 ($ million)
Chart on Japan - Year-over-year growth 2025-2030 (%)
Data Table on Japan - Year-over-year growth 2025-2030 (%)

12.3.4 South Korea - Market size and forecast 2025-2030

Chart on South Korea - Market size and forecast 2025-2030 ($ million)
Data Table on South Korea - Market size and forecast 2025-2030 ($ million)
Chart on South Korea - Year-over-year growth 2025-2030 (%)
Data Table on South Korea - Year-over-year growth 2025-2030 (%)

12.3.5 Australia - Market size and forecast 2025-2030

Chart on Australia - Market size and forecast 2025-2030 ($ million)
Data Table on Australia - Market size and forecast 2025-2030 ($ million)
Chart on Australia - Year-over-year growth 2025-2030 (%)
Data Table on Australia - Year-over-year growth 2025-2030 (%)

12.3.6 Indonesia - Market size and forecast 2025-2030

Chart on Indonesia - Market size and forecast 2025-2030 ($ million)
Data Table on Indonesia - Market size and forecast 2025-2030 ($ million)
Chart on Indonesia - Year-over-year growth 2025-2030 (%)
Data Table on Indonesia - Year-over-year growth 2025-2030 (%)

12.4 Europe - Market size and forecast 2025-2030

Chart on Europe - Market size and forecast 2025-2030 ($ million)
Data Table on Europe - Market size and forecast 2025-2030 ($ million)
Chart on Europe - Year-over-year growth 2025-2030 (%)
Data Table on Europe - Year-over-year growth 2025-2030 (%)
Chart on Regional Comparison - Europe
Data Table on Regional Comparison - Europe

12.4.1 Germany - Market size and forecast 2025-2030

Chart on Germany - Market size and forecast 2025-2030 ($ million)
Data Table on Germany - Market size and forecast 2025-2030 ($ million)
Chart on Germany - Year-over-year growth 2025-2030 (%)
Data Table on Germany - Year-over-year growth 2025-2030 (%)

12.4.2 The Netherlands - Market size and forecast 2025-2030

Chart on The Netherlands - Market size and forecast 2025-2030 ($ million)
Data Table on The Netherlands - Market size and forecast 2025-2030 ($ million)
Chart on The Netherlands - Year-over-year growth 2025-2030 (%)
Data Table on The Netherlands - Year-over-year growth 2025-2030 (%)

12.4.3 UK - Market size and forecast 2025-2030

Chart on UK - Market size and forecast 2025-2030 ($ million)
Data Table on UK - Market size and forecast 2025-2030 ($ million)
Chart on UK - Year-over-year growth 2025-2030 (%)
Data Table on UK - Year-over-year growth 2025-2030 (%)

12.4.4 France - Market size and forecast 2025-2030

Chart on France - Market size and forecast 2025-2030 ($ million)
Data Table on France - Market size and forecast 2025-2030 ($ million)
Chart on France - Year-over-year growth 2025-2030 (%)
Data Table on France - Year-over-year growth 2025-2030 (%)

12.4.5 Italy - Market size and forecast 2025-2030

Chart on Italy - Market size and forecast 2025-2030 ($ million)
Data Table on Italy - Market size and forecast 2025-2030 ($ million)
Chart on Italy - Year-over-year growth 2025-2030 (%)
Data Table on Italy - Year-over-year growth 2025-2030 (%)

12.4.6 Spain - Market size and forecast 2025-2030

Chart on Spain - Market size and forecast 2025-2030 ($ million)
Data Table on Spain - Market size and forecast 2025-2030 ($ million)
Chart on Spain - Year-over-year growth 2025-2030 (%)
Data Table on Spain - Year-over-year growth 2025-2030 (%)

12.5 North America - Market size and forecast 2025-2030

Chart on North America - Market size and forecast 2025-2030 ($ million)
Data Table on North America - Market size and forecast 2025-2030 ($ million)
Chart on North America - Year-over-year growth 2025-2030 (%)
Data Table on North America - Year-over-year growth 2025-2030 (%)
Chart on Regional Comparison - North America
Data Table on Regional Comparison - North America

12.5.1 US - Market size and forecast 2025-2030

Chart on US - Market size and forecast 2025-2030 ($ million)
Data Table on US - Market size and forecast 2025-2030 ($ million)
Chart on US - Year-over-year growth 2025-2030 (%)
Data Table on US - Year-over-year growth 2025-2030 (%)

12.5.2 Canada - Market size and forecast 2025-2030

Chart on Canada - Market size and forecast 2025-2030 ($ million)
Data Table on Canada - Market size and forecast 2025-2030 ($ million)
Chart on Canada - Year-over-year growth 2025-2030 (%)
Data Table on Canada - Year-over-year growth 2025-2030 (%)

12.5.3 Mexico - Market size and forecast 2025-2030

Chart on Mexico - Market size and forecast 2025-2030 ($ million)
Data Table on Mexico - Market size and forecast 2025-2030 ($ million)
Chart on Mexico - Year-over-year growth 2025-2030 (%)
Data Table on Mexico - Year-over-year growth 2025-2030 (%)

12.6 South America - Market size and forecast 2025-2030

Chart on South America - Market size and forecast 2025-2030 ($ million)
Data Table on South America - Market size and forecast 2025-2030 ($ million)
Chart on South America - Year-over-year growth 2025-2030 (%)
Data Table on South America - Year-over-year growth 2025-2030 (%)
Chart on Regional Comparison - South America
Data Table on Regional Comparison - South America

12.6.1 Brazil - Market size and forecast 2025-2030

Chart on Brazil - Market size and forecast 2025-2030 ($ million)
Data Table on Brazil - Market size and forecast 2025-2030 ($ million)
Chart on Brazil - Year-over-year growth 2025-2030 (%)
Data Table on Brazil - Year-over-year growth 2025-2030 (%)

12.6.2 Argentina - Market size and forecast 2025-2030

Chart on Argentina - Market size and forecast 2025-2030 ($ million)
Data Table on Argentina - Market size and forecast 2025-2030 ($ million)
Chart on Argentina - Year-over-year growth 2025-2030 (%)
Data Table on Argentina - Year-over-year growth 2025-2030 (%)

12.6.3 Colombia - Market size and forecast 2025-2030

Chart on Colombia - Market size and forecast 2025-2030 ($ million)
Data Table on Colombia - Market size and forecast 2025-2030 ($ million)
Chart on Colombia - Year-over-year growth 2025-2030 (%)
Data Table on Colombia - Year-over-year growth 2025-2030 (%)

12.7 Middle East and Africa - Market size and forecast 2025-2030

Chart on Middle East and Africa - Market size and forecast 2025-2030 ($ million)
Data Table on Middle East and Africa - Market size and forecast 2025-2030 ($ million)
Chart on Middle East and Africa - Year-over-year growth 2025-2030 (%)
Data Table on Middle East and Africa - Year-over-year growth 2025-2030 (%)
Chart on Regional Comparison - Middle East and Africa
Data Table on Regional Comparison - Middle East and Africa

12.7.1 UAE - Market size and forecast 2025-2030

Chart on UAE - Market size and forecast 2025-2030 ($ million)
Data Table on UAE - Market size and forecast 2025-2030 ($ million)
Chart on UAE - Year-over-year growth 2025-2030 (%)
Data Table on UAE - Year-over-year growth 2025-2030 (%)

12.7.2 Saudi Arabia - Market size and forecast 2025-2030

Chart on Saudi Arabia - Market size and forecast 2025-2030 ($ million)
Data Table on Saudi Arabia - Market size and forecast 2025-2030 ($ million)
Chart on Saudi Arabia - Year-over-year growth 2025-2030 (%)
Data Table on Saudi Arabia - Year-over-year growth 2025-2030 (%)

12.7.3 South Africa - Market size and forecast 2025-2030

Chart on South Africa - Market size and forecast 2025-2030 ($ million)
Data Table on South Africa - Market size and forecast 2025-2030 ($ million)
Chart on South Africa - Year-over-year growth 2025-2030 (%)
Data Table on South Africa - Year-over-year growth 2025-2030 (%)

12.7.4 Turkey - Market size and forecast 2025-2030

Chart on Turkey - Market size and forecast 2025-2030 ($ million)
Data Table on Turkey - Market size and forecast 2025-2030 ($ million)
Chart on Turkey - Year-over-year growth 2025-2030 (%)
Data Table on Turkey - Year-over-year growth 2025-2030 (%)

12.7.5 Israel - Market size and forecast 2025-2030

Chart on Israel - Market size and forecast 2025-2030 ($ million)
Data Table on Israel - Market size and forecast 2025-2030 ($ million)
Chart on Israel - Year-over-year growth 2025-2030 (%)
Data Table on Israel - Year-over-year growth 2025-2030 (%)

12.8 Market opportunity by geography

Market opportunity by geography ($ million)
Data Tables on Market opportunity by geography ($ million)

13. Drivers, Challenges, and Opportunity

13.1 Market drivers

Accelerated Integration of advanced telematics in global logistics
Escalating demand for cold chain integrity and pharmaceutical safety
Strategic focus on operational efficiency and ai-driven asset utilization

13.2 Market challenges

High capital investment and ongoing maintenance costs
Complex cybersecurity threats and data privacy concerns
Lack of standardization and interoperability issues

13.3 Impact of drivers and challenges

Impact of drivers and challenges in 2025 and 2030

13.4 Market opportunities

Convergence of AI and blockchain for enhanced supply chain transparency
Acceleration of IoT-enabled cold chain logistics and smart reefers
Strategic focus on sustainability and circular economy integration

14. Competitive Landscape

14.1 Overview

14.2

Overview on criticality of inputs and factors of differentiation

14.3 Landscape disruption

Overview on factors of disruption

14.4 Industry risks

Impact of key risks on business

15. Competitive Analysis

15.1 Companies profiled

Companies covered

15.2 Company ranking index

15.3 Market positioning of companies

Matrix on companies position and classification

15.4 Aeler Technologies

Aeler Technologies - Overview
Aeler Technologies - Product / Service
Aeler Technologies - Key offerings
SWOT

15.5 BlackBerry Ltd.

BlackBerry Ltd. - Overview
BlackBerry Ltd. - Business segments
BlackBerry Ltd. - Key offerings
BlackBerry Ltd. - Segment focus
SWOT

15.6 CalAmp Corp.

CalAmp Corp. - Overview
CalAmp Corp. - Business segments
CalAmp Corp. - Key offerings
CalAmp Corp. - Segment focus
SWOT

15.7 Carrier Global Corp.

Carrier Global Corp. - Overview
Carrier Global Corp. - Business segments
Carrier Global Corp. - Key news
Carrier Global Corp. - Key offerings
Carrier Global Corp. - Segment focus
SWOT

15.8 Daikin Industries Ltd.

Daikin Industries Ltd. - Overview
Daikin Industries Ltd. - Business segments
Daikin Industries Ltd. - Key news
Daikin Industries Ltd. - Key offerings
Daikin Industries Ltd. - Segment focus
SWOT

15.9 Emerson Electric Co.

Emerson Electric Co. - Overview
Emerson Electric Co. - Business segments
Emerson Electric Co. - Key news
Emerson Electric Co. - Key offerings
Emerson Electric Co. - Segment focus
SWOT

15.10 Envirotainer AB

Envirotainer AB - Overview
Envirotainer AB - Product / Service
Envirotainer AB - Key offerings
SWOT

15.11 Globe Tracker, ApS.

Globe Tracker, ApS. - Overview
Globe Tracker, ApS. - Product / Service
Globe Tracker, ApS. - Key offerings
SWOT

15.12 Nexxiot

Nexxiot - Overview
Nexxiot - Product / Service
Nexxiot - Key offerings
SWOT

15.13 ORBCOMM Inc.

ORBCOMM Inc. - Overview
ORBCOMM Inc. - Product / Service
ORBCOMM Inc. - Key offerings
SWOT

15.14 Thermo King

Thermo King - Overview
Thermo King - Product / Service
Thermo King - Key offerings
SWOT

15.15 TRAXENS

TRAXENS - Overview
TRAXENS - Product / Service
TRAXENS - Key offerings
SWOT

15.16 Triton International Ltd

Triton International Ltd - Overview
Triton International Ltd - Product / Service
Triton International Ltd - Key offerings
SWOT

15.17 Unilode Aviation Solutions

Unilode Aviation Solutions - Overview
Unilode Aviation Solutions - Product / Service
Unilode Aviation Solutions - Key offerings
SWOT

15.18 ZillionSource Technologies

ZillionSource Technologies - Overview
ZillionSource Technologies - Product / Service
ZillionSource Technologies - Key offerings
SWOT

16. Appendix

16.1 Scope of the report

Market definition
Objectives
Notes and caveats

16.2 Inclusions and exclusions checklist

Inclusions checklist
Exclusions checklist

16.3 Currency conversion rates for US$

16.4 Research methodology

16.5 Data procurement

Information sources

16.6 Data validation

16.7 Validation techniques employed for market sizing

16.8 Data synthesis

16.9 360 degree market analysis

16.10 List of abbreviations

Research Methodology

Technavio presents a detailed picture of the market by way of study, synthesis, and summation of data from multiple sources. The analysts have presented the various facets of the market with a particular focus on identifying the key industry influencers. The data thus presented is comprehensive, reliable, and the result of extensive research, both primary and secondary.

INFORMATION SOURCES

Primary sources

  • Manufacturers and suppliers
  • Channel partners
  • Industry experts
  • Strategic decision makers

Secondary sources

  • Industry journals and periodicals
  • Government data
  • Financial reports of key industry players
  • Historical data
  • Press releases

DATA ANALYSIS

Data Synthesis

  • Collation of data
  • Estimation of key figures
  • Analysis of derived insights

Data Validation

  • Triangulation with data models
  • Reference against proprietary databases
  • Corroboration with industry experts

REPORT WRITING

Qualitative

  • Market drivers
  • Market challenges
  • Market trends
  • Five forces analysis

Quantitative

  • Market size and forecast
  • Market segmentation
  • Geographical insights
  • Competitive landscape

Interested in this report?

Get your sample now to see our research methodology and insights!

Download Now

Frequently Asked Questions

Smart Container market growth will increase by USD 8671.7 million during 2026-2030.

The Smart Container market is expected to grow at a CAGR of 19.1% during 2026-2030.

Smart Container market is segmented by Component (Hardware, Software, Services) End-user (Food and beverage, Pharmaceuticals, Chemicals, Oil and gas, Others) Type (Smart dry containers, Smart refrigerated container, Smart tank containers, Open-top and flat rack)

Aeler Technologies, BlackBerry Ltd., CalAmp Corp., Carrier Global Corp., Daikin Industries Ltd., Dwyer Instruments LLC, Emerson Electric Co., Envirotainer AB, Geotab Inc., Globe Tracker, ApS., Logiwa Inc., Nexxiot, ORBCOMM Inc., Phillips Connect, Ramco Systems Ltd., Thermo King, TRAXENS, Triton International Ltd, Unilode Aviation Solutions, ZillionSource Technologies are a few of the key vendors in the Smart Container market.

APAC will register the highest growth rate of 42% among the other regions. Therefore, the Smart Container market in APAC is expected to garner significant business opportunities for the vendors during the forecast period.

China, India, Japan, South Korea, Australia, Indonesia, Germany, The Netherlands, UK, France, Italy, Spain, US, Canada, Mexico, Brazil, Argentina, Colombia, UAE, Saudi Arabia, South Africa, Turkey, Israel

  • Accelerated Integration of advanced telematics in global logistics is the driving factor this market.

The Smart Container market vendors should focus on grabbing business opportunities from the Component segment as it accounted for the largest market share in the base year.
RIA - Research AI Assistant
Ask RIA