Smartphone RF Power Amplifier Market Analysis APAC, North America, Europe, South America, Middle East and Africa - US, China, India, Japan, South Korea - Size and Forecast 2024-2028

Smartphone RF Power Amplifier Market Analysis APAC, North America, Europe, South America, Middle East and Africa - US, China, India, Japan, South Korea - Size and Forecast 2024-2028

Published: Dec 2023 167 Pages SKU: IRTNTR72966

Market Overview at a Glance

$2.4 B
Market Opportunity
13.75%
CAGR
13.25
YoY growth 2023-2024(%)

Smartphone RF Power Amplifier Market Size 2024-2028

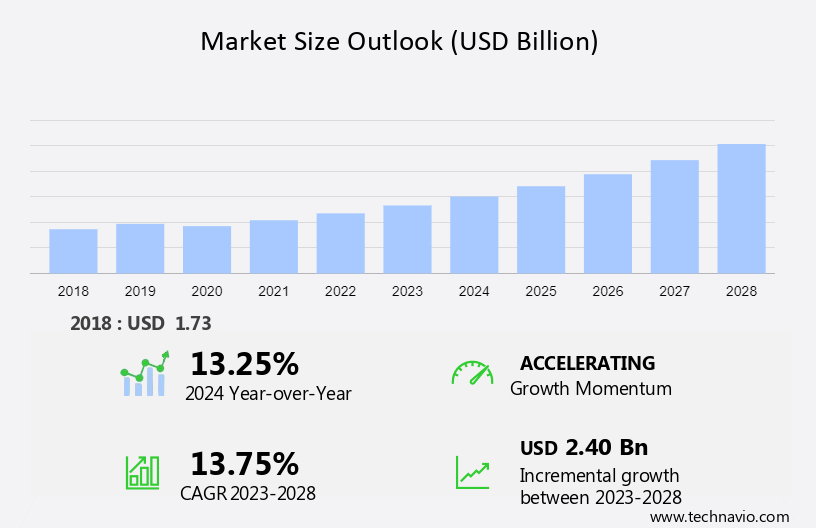
The smartphone rf power amplifier market size is forecast to increase by USD 2.40 bn at a CAGR of 13.75% between 2023 and 2028.

  • The market is experiencing significant growth due to the rising adoption of smartphones and the emergence of high-powered electronic devices. The complexity of RF power amplifier designs is increasing in response to the demand for improved signal quality and power efficiency. This trend is driving innovation In the market, with manufacturers focusing on developing advanced technologies such as gallium nitride (GaN) and silicon carbide (SiC) power amplifiers to meet the demands of the industry. 
  • Additionally, the integration of features like adaptive power control and dynamic power management is becoming increasingly important to optimize power consumption and enhance user experience. Overall, the market is expected to continue its growth trajectory In the coming years, driven by these key trends and the ongoing development of advanced technologies.

What will be the Size of the Smartphone RF Power Amplifier Market During the Forecast Period?

Smartphone RF Power Amplifier Market Size

 Request Free Sample

  • The RF power amplifier market for smartphones is experiencing significant growth due to the increasing demand for advanced wireless communication technologies. Dynamic power ranges are essential to accommodate various RF applications, including satellite communications, radar systems, and cellular networks. The market is witnessing a shift towards higher frequencies, requiring amplifiers with lower noise parameters to maintain signal integrity. Gallium nitride (GaN) and gallium arsenide (GaAs) are popular materials for RF power amplifiers due to their high power handling capabilities and efficiency. The proliferation of RF technologies in consumer electronics, such as Android and iOS system smartphones, is driving the market's expansion.
  • The market's size is expected to grow substantially, fueled by the increasing adoption of 5G applications and the need for linearity, power consumption efficiency, and energy dissipation management in wireless transmitters. Modulation oscillator circuits, buffer stages, and intermediate amplification stages are critical components of RF power amplifiers, while antennas and receivers ensure optimal signal-to-noise ratios. Silicon germanium (SiGe) is another emerging material for RF power amplifiers, offering improved power efficiency and linearity. Overall, the RF power amplifier market is poised for continued growth, driven by the ubiquity of wireless communication technologies and the increasing demand for high-performance, energy-efficient solutions.

How is this Smartphone RF Power Amplifier Industry segmented and which is the largest segment?

The smartphone rf power amplifier industry research report provides comprehensive data (region-wise segment analysis), with forecasts and estimates in "USD billion" for the period 2024-2028, as well as historical data from 2018-2022 for the following segments.

  • Application
    • Android system smartphone
    • iOS system smartphone
  • Technology
    • GaAs
    • GaN
    • Others
  • Geography
    • APAC
      • China
      • India
      • Japan
      • South Korea
    • North America
      • US
    • Europe
    • South America
    • Middle East and Africa

By Application Insights

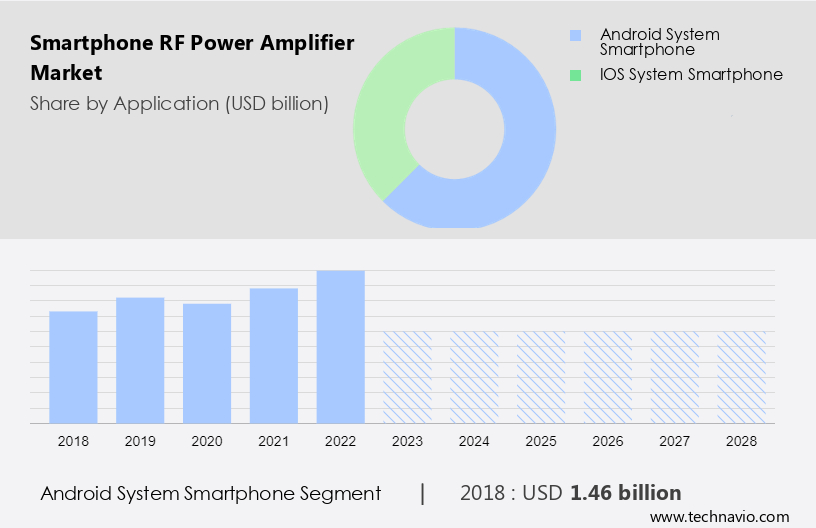
  • The android system smartphone segment is estimated to witness significant growth during the forecast period.

The global RF power amplifier market encompasses various industries, including consumer electronics, aerospace and defense, automotive, medical, semiconductor, satellite communications, radar systems, cellular networks, and more. RF power amplifiers are essential components in wireless transmitters, modulation oscillator circuits, buffer stages, intermediate amplification stages, antennas, receivers, and signal-to-noise ratio enhancement. Technologies such as gallium nitride (GaN), gallium arsenide (GaAs), CMOS, silicon germanium, and next-generation electronic components are driving the market's growth. The market caters to diverse applications, including 5G networks, mobile devices, Internet of Things, connected cars, variable gain amplifiers, signal reception, signal transmission, audio systems, music streaming services, home theater systems, and digital audio formats.

Millimeter-wave applications, defense, aerospace, telecommunications industries, wireless communication systems, and energy and utilities are also significant end-users. Key factors influencing the market include linearity, power consumption, energy dissipation, battery life, portability, and millimeter-wave applications. High linearity amplifiers are essential for maintaining signal quality in wireless communication systems, while power consumption and energy dissipation are crucial for extending battery life and ensuring portability. The RF power amplifier market is expected to grow significantly due to the increasing demand for wireless communication systems, 5G applications, and the proliferation of smart homes, voice assistants, and wireless audio systems. The market is expected to witness substantial growth In the defense, aerospace, and satellite communication sectors due to the need for high-power amplifiers for defense avionics, broadcast transmitters, and defense avionics.

Smartphone RF Power Amplifier Market Size

Get a glance at the market report of various segments Request Free Sample

The Android system smartphone segment was valued at USD 1.46 bn in 2018 and showed a gradual increase during the forecast period.

Regional Analysis

  • APAC is estimated to contribute 74% to the growth of the global market during the forecast period.

Technavio's analysts have elaborately explained the regional trends and drivers that shape the market during the forecast period.

Smartphone RF Power Amplifier Market Share by Geography

For more insights on the market size of various regions, Request Free Sample

The market is a significant segment of the Electronic Amplifier Market, driven by the increasing demand for advanced wireless communication systems in consumer electronics, aerospace and defense, automotive, medical, and semiconductor industries. The market is characterized by the adoption of next-generation RF technologies, including Gallium nitride (GaN), Gallium arsenide (GaAs), CMOS, silicon germanium, and dynamic power ranges. These technologies enable higher frequencies, lower noise parameters, and improved linearity, power consumption, and signal-to-noise ratio. Key applications include satellite communications, radar systems, cellular networks, and 5G networks. The market caters to various sectors, including defense, aerospace, telecommunications, mobile devices, Internet of Things, connected cars, and consumer electronics.

Millimeter-wave applications are gaining traction due to the growing demand for high-speed wireless communication (sensor) systems. The APAC region is the largest market for RF power amplifiers, driven by the presence of major smartphone OEMs, low production costs, and business-friendly government policies. Key players include Texas Instruments, Analog Devices, and other semiconductor IC manufacturers. The market is expected to grow due to the increasing adoption of RF power amplifiers in wireless transmitters, modulation oscillator circuits, buffer stages, intermediate amplification stages, antennas, receivers, and other wireless communication systems. Energy dissipation and battery life remain critical challenges, necessitating the development of high linearity amplifiers and efficient power management systems.

Market Dynamics

Our  researchers analyzed the data with 2023 as the base year, along with the key drivers, trends, and challenges. A holistic analysis of drivers will help companies refine their marketing strategies to gain a competitive advantage.

What are the key market drivers leading to the rise In the adoption of Smartphone RF Power Amplifier Industry?

Rising adoption of smartphones is the key driver of the market.

  • The RF power amplifier market is experiencing significant growth due to the increasing demand for advanced RF technologies in various industries, including consumer electronics, aerospace and defense, automotive, medical, and semiconductor industries. RF power amplifiers are essential components in wireless communication systems, such as satellite communications, radar systems, cellular networks, and 5G applications. These amplifiers enable efficient signal transmission and reception, with dynamic power ranges and lower noise parameters becoming increasingly important for next-generation electronic components. GaAs and gallium nitride (GaN) are popular materials for RF power amplifiers due to their high power handling capabilities and frequency compatibility with various wireless communication systems.
  • In the consumer electronics sector, the proliferation of Android system smartphones and the increasing adoption of 5G technologies are driving the demand for RF power amplifiers with higher linearity, lower power consumption, and improved energy efficiency. Moreover, the growth of wireless transmitters, modulation oscillator circuits, buffer stages, and intermediate amplification stages in wireless communication systems necessitates the use of advanced RF power amplifiers. These components are crucial in antenna design, receiver sensitivity, and signal-to-noise ratio, all of which are essential for high-performance wireless communication systems. The telecommunications industries, including defense, aerospace, and energy and utilities, also rely heavily on RF power amplifiers for their wireless communication systems.
  • Millimeter-wave applications, such as defense avionics and broadcast transmitters, require high linearity amplifiers for efficient signal transmission and reception. In summary, the RF power amplifier market is poised for substantial growth due to the increasing demand for advanced wireless communication systems in various industries. The use of next-generation electronic components, such as GaAs and GaN, and the adoption of 5G technologies are key drivers of this growth. The market dynamics are shaped by factors such as linearity, power consumption, energy dissipation, battery life, portability, and millimeter-wave applications.

What are the market trends shaping the Smartphone RF Power Amplifier Industry?

Emergence of high-powered electronic devices is the upcoming market trend.

  • RF power amplifiers play a crucial role in enabling advanced functionalities in consumer electronic devices, including satellite communications, radar systems, cellular networks, and 5G applications. These amplifiers require next-generation electronic components, such as gallium nitride (GaN) and gallium arsenide (GaAs), to meet the demands for higher frequencies, lower noise parameters, and higher linearity. GaAs and GaN semiconductor devices offer energy efficiency and compactness, making them suitable for use in mobile devices, wireless transmitters, modulation oscillator circuits, buffer stages, and intermediate amplification stages. The semiconductor industries are investing heavily In the development of these components to cater to the needs of various industries, including aerospace and defense, automotive, medical, and telecommunications.
  • The RF power amplifier market is driven by the increasing demand for wireless communication systems, 5G networks, and the Internet of Things, which require high-performance, energy-efficient components for signal reception and transmission. The market is also influenced by the growing popularity of audio systems, music streaming services, home theater systems, and digital audio formats, which require high linearity amplifiers for superior sound quality. Energy dissipation and battery life are critical concerns in portable devices, making the development of power-efficient RF power amplifiers essential. Millimeter-wave applications, defense, aerospace, and broadcast transmitters also require high-power RF amplifiers for efficient signal transmission. Overall, the RF power amplifier market is expected to grow significantly due to the increasing demand for wireless communication systems, energy-efficient components, and advanced functionalities in various industries.

What challenges does the Smartphone RF Power Amplifier Industry face during its growth?

Increase in design complexity of RF power amplifiers is a key challenge affecting the industry growth.

  • The RF power amplifier market is experiencing significant growth due to the increasing complexity of consumer electronics, particularly in smartphones. As devices become more advanced, with larger screens, metallic cases, and higher camera resolutions, the demand for stronger RF signals to maintain connectivity is increasing. This requires RF power amplifiers to deliver more power, leading to a greater focus on next-generation electronic components such as gallium nitride, gallium arsenide, CMOS, silicon germanium, and variable gain amplifiers. The integration of various functionalities and applications on a single IC has increased the complexity of RF power amplifier design. In response, manufacturers are constantly innovating and adapting to new technologies, including 5G applications, satellite communications, radar systems, cellular networks, and millimeter-wave applications.
  • The semiconductor industries, aerospace and defense, automotive, medical, telecommunications, and defense avionics sectors are major contributors to the RF power amplifier market. Key applications include wireless transmitters, modulation oscillator circuits, buffer stages, intermediate amplification stages, and antennas in receivers and signal transmission systems. The importance of RF power amplifiers extends beyond consumer electronics to include industries such as energy and utilities, broadcast transmitters, and Internet of Things applications. With the growing importance of wireless communication systems, including 5G networks, mobile devices, and connected cars, the demand for high linearity amplifiers and efficient power consumption is increasing. Signal-to-noise ratio and energy dissipation are critical factors In the design and development of RF power amplifiers.
  • Ensuring low noise parameters and minimizing energy dissipation are essential for maintaining battery life and portability in mobile devices. In summary, the RF power amplifier market is driven by the increasing complexity of electronic devices and the growing importance of wireless communication systems. Manufacturers must continually innovate and adapt to new technologies to meet the demands of various industries, including consumer electronics, aerospace and defense, automotive, medical, and telecommunications.

Exclusive Customer Landscape

The smartphone rf power amplifier market forecasting report includes the adoption lifecycle of the market, covering from the innovator's stage to the laggard's stage. It focuses on adoption rates in different regions based on penetration. Furthermore, the smartphone rf power amplifier market report also includes key purchase criteria and drivers of price sensitivity to help companies evaluate and develop their market growth analysis strategies.

Smartphone RF Power Amplifier Market Share by Geography

 Customer Landscape

Key Companies & Market Insights

Companies are implementing various strategies, such as strategic alliances, smartphone rf power amplifier market forecast, partnerships, mergers and acquisitions, geographical expansion, and product/service launches, to enhance their presence In the industry.

Analog Devices Inc. - The company specializes in manufacturing RF power amplifier modules for smartphones, delivering superior performance with high linearity, minimal noise figures, and reduced phase noise.

The industry research and growth report includes detailed analyses of the competitive landscape of the market and information about key companies, including:

  • Analog Devices Inc.
  • Broadcom Inc.
  • CML Microcircuits UK Ltd.
  • Eliterfllc
  • Empower RF Systems Inc.
  • Frontgrade Technologies
  • Infineon Technologies AG
  • KeyLink Microwave
  • MACOM Technology Solutions Inc.
  • Mercury Systems Inc.
  • Microchip Technology Inc.
  • Murata Manufacturing Co. Ltd.
  • NXP Semiconductors NV
  • Qorvo Inc.
  • QSC LLC
  • Qualcomm Inc.
  • SHF Communication Technologies AG
  • Skyworks Solutions Inc.
  • Spectrum Control Microelectronics Ltd.
  • Texas Instruments Inc.

Qualitative and quantitative analysis of companies has been conducted to help clients understand the wider business environment as well as the strengths and weaknesses of key industry players. Data is qualitatively analyzed to categorize companies as pure play, category-focused, industry-focused, and diversified; it is quantitatively analyzed to categorize companies as dominant, leading, strong, tentative, and weak.

Research Analyst Overview

The RF power amplifier market encompasses a diverse range of technologies and applications, driven by the increasing demand for advanced wireless communication systems. These amplifiers play a crucial role in enhancing the power and efficiency of radio frequency signals, enabling seamless connectivity in various industries. RF power amplifiers are integral components in numerous applications, including satellite communications, radar systems, and cellular networks. In satellite communications, these amplifiers amplify the power of transmitted signals to ensure reliable and robust communication over long distances. In radar systems, they amplify the power of transmitted radio waves to detect and locate objects. In cellular networks, they amplify the power of signals to extend coverage and improve network performance.

The RF power amplifier market is witnessing significant growth due to the increasing adoption of next-generation electronic components, such as gallium nitride (GaN), gallium arsenide (GaAs), CMOS, silicon germanium, and other advanced materials. These components offer higher frequencies, lower noise parameters, and improved linearity, making them ideal for use in RF power amplifiers. The demand for RF power amplifiers is also driven by the proliferation of wireless communication systems in various industries. In the telecommunications industry, the rollout of 5G networks is expected to fuel the growth of the RF power amplifier market, as these networks require more powerful and efficient amplifiers to support higher frequencies and lower latency.

In the consumer electronics industry, the increasing popularity of mobile devices, smart homes, and voice assistants is driving the demand for RF power amplifiers in wireless transmitters and receivers. The RF power amplifier market is also witnessing significant growth In the aerospace and defense industry, where these amplifiers are used in defense avionics, satellite communication, and radar systems. In the automotive industry, RF power amplifiers are used in wireless communication systems for connected cars. In the medical industry, they are used in wireless transmitters and receivers for medical telemetry and imaging systems. The RF power amplifier market is characterized by dynamic power ranges, energy dissipation, signal-to-noise ratio, and power consumption.

These factors are critical in determining the performance and efficiency of RF power amplifiers. Higher linearity amplifiers are preferred in applications where low distortion is essential, such as in audio systems, music streaming services, and home theater systems. Variable gain amplifiers are used in applications where the gain needs to be adjusted dynamically, such as in mobile devices and wireless audio systems. The RF power amplifier market is also witnessing significant growth in millimeter-wave applications, where the demand for high-power and efficient amplifiers is increasing due to the proliferation of 5G networks and other wireless communication systems. The market is expected to continue growing In the coming years, driven by the increasing demand for wireless communication systems in various industries and the ongoing development of next-generation electronic components.

In conclusion, the RF power amplifier market is a dynamic and growing market, driven by the increasing demand for advanced wireless communication systems in various industries. The market is characterized by the adoption of next-generation electronic components, the proliferation of wireless communication systems, and the ongoing development of advanced materials and technologies. The market is expected to continue growing In the coming years, driven by the increasing demand for wireless communication systems in various industries and the ongoing development of next-generation electronic components.

Market Scope

Report Coverage

Details

Page number

167

Base year

2023

Historic period

2018-2022

Forecast period

2024-2028

Growth momentum & CAGR

Accelerate at a CAGR of 13.75%

Market growth 2024-2028

USD 2.40 billion

Market structure

Fragmented

YoY growth 2023-2024(%)

13.25

Key countries

US, China, India, Japan, and South Korea

Competitive landscape

Leading Companies, Market Positioning of Companies, Competitive Strategies, and Industry Risks

Request Free Sample

What are the Key Data Covered in this Smartphone RF Power Amplifier Market Research and Growth Report?

  • CAGR of the Smartphone RF Power Amplifier industry during the forecast period
  • Detailed information on factors that will drive the growth and forecasting between 2024 and 2028
  • Precise estimation of the size of the market and its contribution of the industry in focus to the parent market
  • Accurate predictions about upcoming growth and trends and changes in consumer behaviour
  • Growth of the market across APAC, North America, Europe, South America, and Middle East and Africa
  • Thorough analysis of the market's competitive landscape and detailed information about companies
  • Comprehensive analysis of factors that will challenge the smartphone rf power amplifier market growth of industry companies

We can help! Our analysts can customize this smartphone rf power amplifier market research report to meet your requirements.

Get in touch

1 Executive Summary

  • 1.1 Market overview
    • Exhibit 01: Executive Summary – Chart on Market Overview
    • Exhibit 02: Executive Summary – Data Table on Market Overview
    • Exhibit 03: Executive Summary – Chart on Global Market Characteristics
    • Exhibit 04: Executive Summary – Chart on Market by Geography
    • Exhibit 05: Executive Summary – Chart on Market Segmentation by Application
    • Exhibit 06: Executive Summary – Chart on Market Segmentation by Technology
    • Exhibit 07: Executive Summary – Chart on Incremental Growth
    • Exhibit 08: Executive Summary – Data Table on Incremental Growth
    • Exhibit 09: Executive Summary – Chart on Vendor Market Positioning

2 Market Landscape

  • 2.1 Market ecosystem
    • Exhibit 10: Parent market
    • Exhibit 11: Market Characteristics

3 Market Sizing

  • 3.1 Market definition
    • Exhibit 12: Offerings of vendors included in the market definition
  • 3.2 Market segment analysis
    • Exhibit 13: Market segments
  • 3.3 Market size 2023
    • 3.4 Market outlook: Forecast for 2023-2028
      • Exhibit 14: Chart on Global - Market size and forecast 2023-2028 ($ billion)
      • Exhibit 15: Data Table on Global - Market size and forecast 2023-2028 ($ billion)
      • Exhibit 16: Chart on Global Market: Year-over-year growth 2023-2028 (%)
      • Exhibit 17: Data Table on Global Market: Year-over-year growth 2023-2028 (%)

    4 Historic Market Size

    • 4.1 Global smartphone RF power amplifier market 2018 - 2022
      • Exhibit 18: Historic Market Size – Data Table on global smartphone rf power amplifier market 2018 - 2022 ($ billion)
    • 4.2 Application Segment Analysis 2018 - 2022
      • Exhibit 19: Historic Market Size – Application Segment 2018 - 2022 ($ billion)
    • 4.3 Technology Segment Analysis 2018 - 2022
      • Exhibit 20: Historic Market Size – Technology Segment 2018 - 2022 ($ billion)
    • 4.4 Geography Segment Analysis 2018 - 2022
      • Exhibit 21: Historic Market Size – Geography Segment 2018 - 2022 ($ billion)
    • 4.5 Country Segment Analysis 2018 - 2022
      • Exhibit 22: Historic Market Size – Country Segment 2018 - 2022 ($ billion)

    5 Five Forces Analysis

    • 5.1 Five forces summary
      • Exhibit 23: Five forces analysis - Comparison between 2023 and 2028
    • 5.2 Bargaining power of buyers
      • Exhibit 24: Chart on Bargaining power of buyers – Impact of key factors 2023 and 2028
    • 5.3 Bargaining power of suppliers
      • Exhibit 25: Bargaining power of suppliers – Impact of key factors in 2023 and 2028
    • 5.4 Threat of new entrants
      • Exhibit 26: Threat of new entrants – Impact of key factors in 2023 and 2028
    • 5.5 Threat of substitutes
      • Exhibit 27: Threat of substitutes – Impact of key factors in 2023 and 2028
    • 5.6 Threat of rivalry
      • Exhibit 28: Threat of rivalry – Impact of key factors in 2023 and 2028
    • 5.7 Market condition
      • Exhibit 29: Chart on Market condition - Five forces 2023 and 2028

    6 Market Segmentation by Application

    • 6.1 Market segments
      • Exhibit 30: Chart on Application - Market share 2023-2028 (%)
      • Exhibit 31: Data Table on Application - Market share 2023-2028 (%)
    • 6.2 Comparison by Application
      • Exhibit 32: Chart on Comparison by Application
      • Exhibit 33: Data Table on Comparison by Application
    • 6.3 Android system smartphone - Market size and forecast 2023-2028
      • Exhibit 34: Chart on Android system smartphone - Market size and forecast 2023-2028 ($ billion)
      • Exhibit 35: Data Table on Android system smartphone - Market size and forecast 2023-2028 ($ billion)
      • Exhibit 36: Chart on Android system smartphone - Year-over-year growth 2023-2028 (%)
      • Exhibit 37: Data Table on Android system smartphone - Year-over-year growth 2023-2028 (%)
    • 6.4 iOS system smartphone - Market size and forecast 2023-2028
      • Exhibit 38: Chart on iOS system smartphone - Market size and forecast 2023-2028 ($ billion)
      • Exhibit 39: Data Table on iOS system smartphone - Market size and forecast 2023-2028 ($ billion)
      • Exhibit 40: Chart on iOS system smartphone - Year-over-year growth 2023-2028 (%)
      • Exhibit 41: Data Table on iOS system smartphone - Year-over-year growth 2023-2028 (%)
    • 6.5 Market opportunity by Application
      • Exhibit 42: Market opportunity by Application ($ billion)
      • Exhibit 43: Data Table on Market opportunity by Application ($ billion)

    7 Market Segmentation by Technology

    • 7.1 Market segments
      • Exhibit 44: Chart on Technology - Market share 2023-2028 (%)
      • Exhibit 45: Data Table on Technology - Market share 2023-2028 (%)
    • 7.2 Comparison by Technology
      • Exhibit 46: Chart on Comparison by Technology
      • Exhibit 47: Data Table on Comparison by Technology
    • 7.3 GaAs - Market size and forecast 2023-2028
      • Exhibit 48: Chart on GaAs - Market size and forecast 2023-2028 ($ billion)
      • Exhibit 49: Data Table on GaAs - Market size and forecast 2023-2028 ($ billion)
      • Exhibit 50: Chart on GaAs - Year-over-year growth 2023-2028 (%)
      • Exhibit 51: Data Table on GaAs - Year-over-year growth 2023-2028 (%)
    • 7.4 GaN - Market size and forecast 2023-2028
      • Exhibit 52: Chart on GaN - Market size and forecast 2023-2028 ($ billion)
      • Exhibit 53: Data Table on GaN - Market size and forecast 2023-2028 ($ billion)
      • Exhibit 54: Chart on GaN - Year-over-year growth 2023-2028 (%)
      • Exhibit 55: Data Table on GaN - Year-over-year growth 2023-2028 (%)
    • 7.5 Others - Market size and forecast 2023-2028
      • Exhibit 56: Chart on Others - Market size and forecast 2023-2028 ($ billion)
      • Exhibit 57: Data Table on Others - Market size and forecast 2023-2028 ($ billion)
      • Exhibit 58: Chart on Others - Year-over-year growth 2023-2028 (%)
      • Exhibit 59: Data Table on Others - Year-over-year growth 2023-2028 (%)
    • 7.6 Market opportunity by Technology
      • Exhibit 60: Market opportunity by Technology ($ billion)
      • Exhibit 61: Data Table on Market opportunity by Technology ($ billion)

    8 Customer Landscape

    • 8.1 Customer landscape overview
      • Exhibit 62: Analysis of price sensitivity, lifecycle, customer purchase basket, adoption rates, and purchase criteria

    9 Geographic Landscape

    • 9.1 Geographic segmentation
      • Exhibit 63: Chart on Market share by geography 2023-2028 (%)
      • Exhibit 64: Data Table on Market share by geography 2023-2028 (%)
    • 9.2 Geographic comparison
      • Exhibit 65: Chart on Geographic comparison
      • Exhibit 66: Data Table on Geographic comparison
    • 9.3 APAC - Market size and forecast 2023-2028
      • Exhibit 67: Chart on APAC - Market size and forecast 2023-2028 ($ billion)
      • Exhibit 68: Data Table on APAC - Market size and forecast 2023-2028 ($ billion)
      • Exhibit 69: Chart on APAC - Year-over-year growth 2023-2028 (%)
      • Exhibit 70: Data Table on APAC - Year-over-year growth 2023-2028 (%)
    • 9.4 North America - Market size and forecast 2023-2028
      • Exhibit 71: Chart on North America - Market size and forecast 2023-2028 ($ billion)
      • Exhibit 72: Data Table on North America - Market size and forecast 2023-2028 ($ billion)
      • Exhibit 73: Chart on North America - Year-over-year growth 2023-2028 (%)
      • Exhibit 74: Data Table on North America - Year-over-year growth 2023-2028 (%)
    • 9.5 Europe - Market size and forecast 2023-2028
      • Exhibit 75: Chart on Europe - Market size and forecast 2023-2028 ($ billion)
      • Exhibit 76: Data Table on Europe - Market size and forecast 2023-2028 ($ billion)
      • Exhibit 77: Chart on Europe - Year-over-year growth 2023-2028 (%)
      • Exhibit 78: Data Table on Europe - Year-over-year growth 2023-2028 (%)
    • 9.6 South America - Market size and forecast 2023-2028
      • Exhibit 79: Chart on South America - Market size and forecast 2023-2028 ($ billion)
      • Exhibit 80: Data Table on South America - Market size and forecast 2023-2028 ($ billion)
      • Exhibit 81: Chart on South America - Year-over-year growth 2023-2028 (%)
      • Exhibit 82: Data Table on South America - Year-over-year growth 2023-2028 (%)
    • 9.7 Middle East and Africa - Market size and forecast 2023-2028
      • Exhibit 83: Chart on Middle East and Africa - Market size and forecast 2023-2028 ($ billion)
      • Exhibit 84: Data Table on Middle East and Africa - Market size and forecast 2023-2028 ($ billion)
      • Exhibit 85: Chart on Middle East and Africa - Year-over-year growth 2023-2028 (%)
      • Exhibit 86: Data Table on Middle East and Africa - Year-over-year growth 2023-2028 (%)
    • 9.8 China - Market size and forecast 2023-2028
      • Exhibit 87: Chart on China - Market size and forecast 2023-2028 ($ billion)
      • Exhibit 88: Data Table on China - Market size and forecast 2023-2028 ($ billion)
      • Exhibit 89: Chart on China - Year-over-year growth 2023-2028 (%)
      • Exhibit 90: Data Table on China - Year-over-year growth 2023-2028 (%)
    • 9.9 India - Market size and forecast 2023-2028
      • Exhibit 91: Chart on India - Market size and forecast 2023-2028 ($ billion)
      • Exhibit 92: Data Table on India - Market size and forecast 2023-2028 ($ billion)
      • Exhibit 93: Chart on India - Year-over-year growth 2023-2028 (%)
      • Exhibit 94: Data Table on India - Year-over-year growth 2023-2028 (%)
    • 9.10 US - Market size and forecast 2023-2028
      • Exhibit 95: Chart on US - Market size and forecast 2023-2028 ($ billion)
      • Exhibit 96: Data Table on US - Market size and forecast 2023-2028 ($ billion)
      • Exhibit 97: Chart on US - Year-over-year growth 2023-2028 (%)
      • Exhibit 98: Data Table on US - Year-over-year growth 2023-2028 (%)
    • 9.11 Japan - Market size and forecast 2023-2028
      • Exhibit 99: Chart on Japan - Market size and forecast 2023-2028 ($ billion)
      • Exhibit 100: Data Table on Japan - Market size and forecast 2023-2028 ($ billion)
      • Exhibit 101: Chart on Japan - Year-over-year growth 2023-2028 (%)
      • Exhibit 102: Data Table on Japan - Year-over-year growth 2023-2028 (%)
    • 9.12 South Korea - Market size and forecast 2023-2028
      • Exhibit 103: Chart on South Korea - Market size and forecast 2023-2028 ($ billion)
      • Exhibit 104: Data Table on South Korea - Market size and forecast 2023-2028 ($ billion)
      • Exhibit 105: Chart on South Korea - Year-over-year growth 2023-2028 (%)
      • Exhibit 106: Data Table on South Korea - Year-over-year growth 2023-2028 (%)
    • 9.13 Market opportunity by geography
      • Exhibit 107: Market opportunity by geography ($ billion)
      • Exhibit 108: Data Tables on Market opportunity by geography ($ billion)

    10 Drivers, Challenges, and Trends

    • 10.1 Market drivers
      • 10.2 Market challenges
        • 10.3 Impact of drivers and challenges
          • Exhibit 109: Impact of drivers and challenges in 2023 and 2028
        • 10.4 Market trends

          11 Vendor Landscape

          • 11.1 Overview
            • 11.2 Vendor landscape
              • Exhibit 110: Overview on Criticality of inputs and Factors of differentiation
            • 11.3 Landscape disruption
              • Exhibit 111: Overview on factors of disruption
            • 11.4 Industry risks
              • Exhibit 112: Impact of key risks on business

            12 Vendor Analysis

            • 12.1 Vendors covered
              • Exhibit 113: Vendors covered
            • 12.2 Market positioning of vendors
              • Exhibit 114: Matrix on vendor position and classification
            • 12.3 Analog Devices Inc.
              • Exhibit 115: Analog Devices Inc. - Overview
              • Exhibit 116: Analog Devices Inc. - Business segments
              • Exhibit 117: Analog Devices Inc. - Key news
              • Exhibit 118: Analog Devices Inc. - Key offerings
              • Exhibit 119: Analog Devices Inc. - Segment focus
            • 12.4 Broadcom Inc.
              • Exhibit 120: Broadcom Inc. - Overview
              • Exhibit 121: Broadcom Inc. - Business segments
              • Exhibit 122: Broadcom Inc. - Key news
              • Exhibit 123: Broadcom Inc. - Key offerings
              • Exhibit 124: Broadcom Inc. - Segment focus
            • 12.5 CML Microcircuits UK Ltd.
              • Exhibit 125: CML Microcircuits UK Ltd. - Overview
              • Exhibit 126: CML Microcircuits UK Ltd. - Product / Service
              • Exhibit 127: CML Microcircuits UK Ltd. - Key offerings
            • 12.6 Eliterfllc
              • Exhibit 128: Eliterfllc - Overview
              • Exhibit 129: Eliterfllc - Product / Service
              • Exhibit 130: Eliterfllc - Key offerings
            • 12.7 Empower RF Systems Inc.
              • Exhibit 131: Empower RF Systems Inc. - Overview
              • Exhibit 132: Empower RF Systems Inc. - Product / Service
              • Exhibit 133: Empower RF Systems Inc. - Key offerings
            • 12.8 Frontgrade Technologies
              • Exhibit 134: Frontgrade Technologies - Overview
              • Exhibit 135: Frontgrade Technologies - Product / Service
              • Exhibit 136: Frontgrade Technologies - Key offerings
            • 12.9 Infineon Technologies AG
              • Exhibit 137: Infineon Technologies AG - Overview
              • Exhibit 138: Infineon Technologies AG - Business segments
              • Exhibit 139: Infineon Technologies AG - Key news
              • Exhibit 140: Infineon Technologies AG - Key offerings
              • Exhibit 141: Infineon Technologies AG - Segment focus
            • 12.10 MACOM Technology Solutions Inc.
              • Exhibit 142: MACOM Technology Solutions Inc. - Overview
              • Exhibit 143: MACOM Technology Solutions Inc. - Product / Service
              • Exhibit 144: MACOM Technology Solutions Inc. - Key news
              • Exhibit 145: MACOM Technology Solutions Inc. - Key offerings
            • 12.11 Murata Manufacturing Co. Ltd.
              • Exhibit 146: Murata Manufacturing Co. Ltd. - Overview
              • Exhibit 147: Murata Manufacturing Co. Ltd. - Business segments
              • Exhibit 148: Murata Manufacturing Co. Ltd. - Key news
              • Exhibit 149: Murata Manufacturing Co. Ltd. - Key offerings
              • Exhibit 150: Murata Manufacturing Co. Ltd. - Segment focus
            • 12.12 NXP Semiconductors NV
              • Exhibit 151: NXP Semiconductors NV - Overview
              • Exhibit 152: NXP Semiconductors NV - Product / Service
              • Exhibit 153: NXP Semiconductors NV - Key news
              • Exhibit 154: NXP Semiconductors NV - Key offerings
            • 12.13 Qorvo Inc.
              • Exhibit 155: Qorvo Inc. - Overview
              • Exhibit 156: Qorvo Inc. - Business segments
              • Exhibit 157: Qorvo Inc. - Key news
              • Exhibit 158: Qorvo Inc. - Key offerings
              • Exhibit 159: Qorvo Inc. - Segment focus
            • 12.14 QSC LLC
              • Exhibit 160: QSC LLC - Overview
              • Exhibit 161: QSC LLC - Product / Service
              • Exhibit 162: QSC LLC - Key offerings
            • 12.15 Qualcomm Inc.
              • Exhibit 163: Qualcomm Inc. - Overview
              • Exhibit 164: Qualcomm Inc. - Business segments
              • Exhibit 165: Qualcomm Inc. - Key news
              • Exhibit 166: Qualcomm Inc. - Key offerings
              • Exhibit 167: Qualcomm Inc. - Segment focus
            • 12.16 Skyworks Solutions Inc.
              • Exhibit 168: Skyworks Solutions Inc. - Overview
              • Exhibit 169: Skyworks Solutions Inc. - Product / Service
              • Exhibit 170: Skyworks Solutions Inc. - Key offerings
            • 12.17 Texas Instruments Inc.
              • Exhibit 171: Texas Instruments Inc. - Overview
              • Exhibit 172: Texas Instruments Inc. - Business segments
              • Exhibit 173: Texas Instruments Inc. - Key news
              • Exhibit 174: Texas Instruments Inc. - Key offerings
              • Exhibit 175: Texas Instruments Inc. - Segment focus

            13 Appendix

            • 13.1 Scope of the report
              • 13.2 Inclusions and exclusions checklist
                • Exhibit 176: Inclusions checklist
                • Exhibit 177: Exclusions checklist
              • 13.3 Currency conversion rates for US$
                • Exhibit 178: Currency conversion rates for US$
              • 13.4 Research methodology
                • Exhibit 179: Research methodology
                • Exhibit 180: Validation techniques employed for market sizing
                • Exhibit 181: Information sources
              • 13.5 List of abbreviations
                • Exhibit 182: List of abbreviations

              Research Methodology

              Technavio presents a detailed picture of the market by way of study, synthesis, and summation of data from multiple sources. The analysts have presented the various facets of the market with a particular focus on identifying the key industry influencers. The data thus presented is comprehensive, reliable, and the result of extensive research, both primary and secondary.

              INFORMATION SOURCES

              Primary sources

              • Manufacturers and suppliers
              • Channel partners
              • Industry experts
              • Strategic decision makers

              Secondary sources

              • Industry journals and periodicals
              • Government data
              • Financial reports of key industry players
              • Historical data
              • Press releases

              DATA ANALYSIS

              Data Synthesis

              • Collation of data
              • Estimation of key figures
              • Analysis of derived insights

              Data Validation

              • Triangulation with data models
              • Reference against proprietary databases
              • Corroboration with industry experts

              REPORT WRITING

              Qualitative

              • Market drivers
              • Market challenges
              • Market trends
              • Five forces analysis

              Quantitative

              • Market size and forecast
              • Market segmentation
              • Geographical insights
              • Competitive landscape

              Interested in this report?

              Get your sample now to see our research methodology and insights!

              Download Now

              Frequently Asked Questions

              Smartphone RF Power Amplifier market growth will increase by $ 2.40 bn during 2024-2028.

              The Smartphone RF Power Amplifier market is expected to grow at a CAGR of 13.75% during 2024-2028.

              Smartphone RF Power Amplifier market is segmented by Application( Android system smartphone, iOS system smartphone) Technology( GaAs, GaN, Others, South America, Middle East and Africa)

              Analog Devices Inc., Broadcom Inc., CML Microcircuits UK Ltd., Eliterfllc, Empower RF Systems Inc., Frontgrade Technologies, Infineon Technologies AG, KeyLink Microwave, MACOM Technology Solutions Inc., Mercury Systems Inc., Microchip Technology Inc., Murata Manufacturing Co. Ltd., NXP Semiconductors NV, Qorvo Inc., QSC LLC, Qualcomm Inc., SHF Communication Technologies AG, Skyworks Solutions Inc., Spectrum Control Microelectronics Ltd., Texas Instruments Inc. are a few of the key vendors in the Smartphone RF Power Amplifier market.

              APAC will register the highest growth rate of 74% among the other regions. Therefore, the Smartphone RF Power Amplifier market in APAC is expected to garner significant business opportunities for the vendors during the forecast period.

              US, China, India, Japan, South Korea

              • Rising adoption of smartphonesShipments of smartphones reached more than 1.37 billion units in 2021 due to the availability of low-cost smartphones in emerging markets such as China and India and increasing Internet penetration worldwide. This was a significant increase from around 1.4 billion units in 2016. The growth in the shipments of smartphones will drive the demand for RF power amplifiers used in mobile handsets is the driving factor this market.
              • particularly GaAs power amplifiers. Smartphones currently require more gallium arsenide (GaAs) content is the driving factor this market.
              • as they need many frequency bands to accommodate third-generation (3G) and fourth-generation (4G) networks. As both suppliers and distributors focus on 5G products that have a substantially higher average selling price (ASP) than earlier 4G devices is the driving factor this market.
              • 5G shipments continued to be the main growth driver in 2021. In 2021 is the driving factor this market.
              • the average selling price of a 5G smartphone was $634 is the driving factor this market.
              • up from $632 in 2020. Consequently is the driving factor this market.
              • the overall volume of 5G shipments reached approximately 570 million units in 2021 is the driving factor this market.
              • rising 123.4 % from the previous year. China maintained its lead in the industry is the driving factor this market.
              • with 47.1 % of the global 5G market share is the driving factor this market.
              • followed by the US (16%) is the driving factor this market.
              • India (6.1%) is the driving factor this market.
              • and Japan (4.1%). With a 54.1 % share of all smartphone shipments by the end of 2022 is the driving factor this market.
              • 5G units were expected to account for more than half of all smartphone shipments. Some of the vendors manufacturing smartphones is the driving factor this market.
              • such as Xiaomi is the driving factor this market.
              • are focusing on manufacturing solar-powered smartphones. Thus is the driving factor this market.
              • the production of smartphones powered by GaAs-based solar cells will positively influence market growth. Furthermore is the driving factor this market.
              • GaAs components are increasingly used in manufacturing RF modules for smartphones is the driving factor this market.
              • owing to their properties and high-power performance with low power consumption. This is expected to drive growth in the global smartphone RF power amplifier market during the forecast period. is the driving factor this market.

              The Smartphone RF Power Amplifier market vendors should focus on grabbing business opportunities from the Android system smartphone segment as it accounted for the largest market share in the base year.
              RIA - Research AI Assistant
              Ask RIA