Wireless Sensor Network (WSN) Market Analysis, Size, and Forecast 2024-2028: North America (US), APAC (China, Japan), Europe (Germany, UK), South America , and Middle East and Africa

Wireless Sensor Network (WSN) Market Analysis, Size, and Forecast 2024-2028:
North America (US), APAC (China, Japan), Europe (Germany, UK), South America , and Middle East and Africa

Published: Jul 2024 178 Pages SKU: IRTNTR75921

Market Overview at a Glance

$110.73 B
Market Opportunity
17.71%
CAGR
16.79
YoY growth 2023-2024(%)

Wireless Sensor Network Market Size 2024-2028

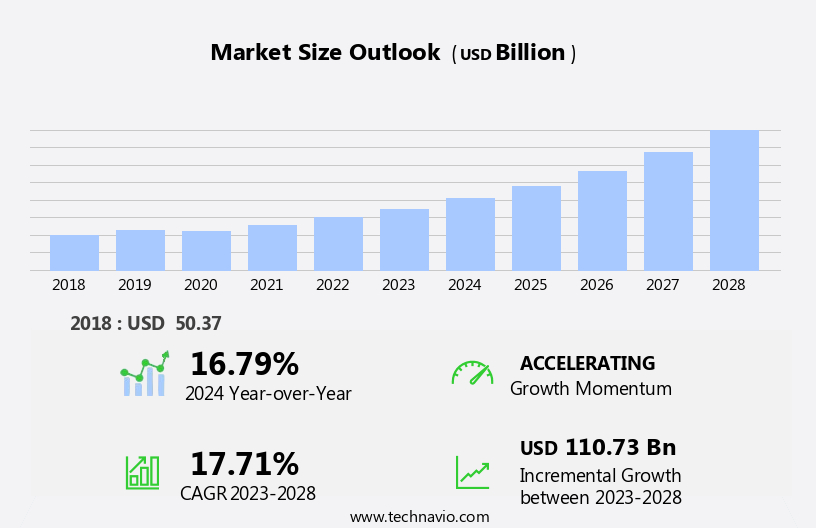
The wireless sensor network (WSN) market size is forecast to increase by USD 110.73 billion at a CAGR of 17.71% between 2023 and 2028.

  • The market is experiencing significant growth, driven by the increasing adoption of Industry 4.0 and the emergence of wearable technologies. Industry 4.0, also known as the Fourth Industrial Revolution, is characterized by the integration of advanced technologies such as the Internet of Things (IoT) and automation into manufacturing processes. WSNs play a crucial role in this revolution by providing real-time data on various industrial parameters, enabling predictive maintenance and optimizing production processes. Furthermore, the growing trend of wearable technologies is expanding the scope of WSNs beyond industrial applications to healthcare, fitness, and environmental monitoring. However, delivering high-quality WSNs at low cost remains a significant challenge for market players.
  • This is due to the complex nature of wireless communication and the need for energy efficiency, which requires advanced technologies and sophisticated design. Companies seeking to capitalize on market opportunities and navigate these challenges effectively should focus on innovation, cost optimization, and strategic partnerships. By staying abreast of the latest technological developments and market trends, they can differentiate themselves and gain a competitive edge.

What will be the Size of the Wireless Sensor Network (WSN) Market during the forecast period?

Wireless Sensor Network (WSN) Market Size

 Request Free Sample

  • The market encompasses a range of technologies and applications, including robotics, Internet-of-Things (IoT), smart cities, and autonomous vehicles. This dynamic market is driven by the increasing demand for remote monitoring and real-time data collection from heterogeneous devices. Sensor manufacturers continue to innovate, producing various types such as ambient light, temperature, heart rate, pressure, image, and more. WSNs employ various communication protocols, with Zigbee-based systems gaining popularity. Hardware, software, and services form the market's three primary segments. Applications span from building automation and security systems to access control, video surveillance, and wearable sensors in Body Area Networks.
  • Artificial Intelligence (AI) integration enhances WSN capabilities, enabling advanced analytics and predictive maintenance. The market's growth is fueled by the increasing adoption of WSNs in various industries, leading to a significant expansion in size and direction.

How is the Wireless Sensor Network (WSN) Industry segmented?

The industry research report provides comprehensive data (region-wise segment analysis), with forecasts and estimates in "USD billion" for the period 2024-2028, as well as historical data from 2018-2022 for the following segments.

  • Component
    • Hardware
    • Software
    • Services
  • End-user
    • Building automation
    • Wearable devices
    • Healthcare
    • Automotive and transportation
    • Others
  • Geography
    • North America
      • US
    • APAC
      • China
      • Japan
    • Europe
      • Germany
      • UK
    • South America
    • Middle East and Africa

By Component Insights

The hardware segment is estimated to witness significant growth during the forecast period. Wireless Sensor Networks (WSNs) are complex systems comprised of microcontrollers or microprocessors, sensor nodes, and various types of sensors, all working in unison to facilitate sensing, data processing, and wireless communication. Sensor nodes, the smallest components, incorporate sensing elements, processing units, and wireless communication modules. Microcontrollers or microprocessors, which house sensor nodes, manage data processing and control functions. WSNs utilize diverse sensor types, such as temperature, humidity, and gas sensors, depending on specific application demands. Power sources include batteries and energy harvesting techniques, like solar panels and kinetic energy harvesting. In the realm of WSN applications, sectors like robotics, IoT, smart cities, autonomous vehicles, and industrial manufacturing significantly benefit from this technology.

Key components include hardware, software, services, and a range of sensor types, including ambient light sensors, temperature sensors, heart rate sensors, and pressure sensors, among others. WSNs employ connectivity technologies like Bluetooth, Wi-Fi, and cellular networks, and platforms support remote monitoring, heterogeneous devices, and M2M connections. Applications span industries like healthcare, automotive and transportation, oil and gas, agriculture, aerospace and defense, energy conservation, and more.

Wireless Sensor Network (WSN) Market Size

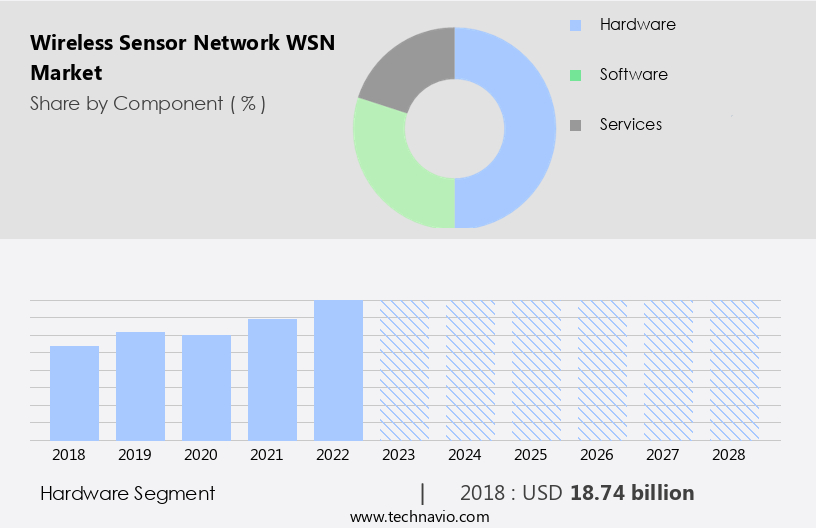
Get a glance at the market report of share of various segments Request Free Sample

The Hardware segment was valued at USD 18.74 billion in 2018 and showed a gradual increase during the forecast period.

Regional Analysis

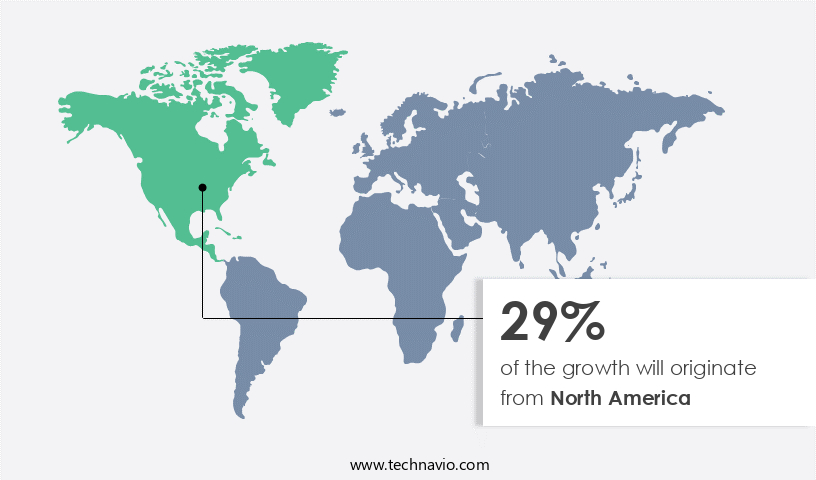
North America is estimated to contribute 29% to the growth of the global market during the forecast period. Technavio's analysts have elaborately explained the regional trends and drivers that shape the market during the forecast period.

Wireless Sensor Network (WSN) Market Share by Geography

For more insights on the market size of various regions, Request Free Sample

The market is a significant segment of the Internet-of-Things (IoT) industry, driven by the integration of WSNs in various applications such as robotics, smart cities, autonomous vehicles, and industrial automation. Key players include sensor manufacturers, technology providers, and system integrators. In North America, the US dominates the market due to its strong industrial sector, with applications in industries like power generation, oil and gas, automotive, food and beverage, and pharmaceutical. The region's market growth is attributed to the reshoring trend, increased demand for smart factories, and the proximity to end-users for customization. WSNs incorporate various sensor types, including ambient light sensors, temperature sensors, heart rate sensors, pressure sensors, accelerometers, and image sensors, among others.

Connectivity technologies like Bluetooth, Wi-Fi, and cellular networks enable seamless data transfer and integration with other systems. Applications span across sectors such as healthcare, automotive and transportation, industrial, oil and gas, agriculture, aerospace and defense, energy conservation, and building automation. AI and machine learning algorithms enhance the functionality of WSNs, enabling predictive maintenance, diagnostics, and remote monitoring.

Market Dynamics

Our researchers analyzed the data with 2023 as the base year, along with the key drivers, trends, and challenges. A holistic analysis of drivers will help companies refine their marketing strategies to gain a competitive advantage.

What are the key market drivers leading to the rise in the adoption of Wireless Sensor Network (WSN) Industry?

  • Increasing adoption of Industry 4.0 is the key driver of the market. The global wireless sensor network market is experiencing significant growth due to the increasing adoption of Industry 4.0. This new industrial revolution integrates advanced technologies like IoT, cloud computing, and data analytics to create smart factories. Wireless sensor networks play a vital role in Industry 4.0, enabling real-time monitoring and management of industrial processes. Their benefits, including improved efficiency, reduced downtime, and cost-effectiveness, are essential for the digitalization and automation of various industries. As a result, the wireless sensor network market is poised for continued expansion.
  • The integration of artificial intelligence (AI) and machine learning algorithms enhances the capabilities of wireless sensor networks, enabling remote monitoring, predictive maintenance, and real-time decision-making. The market for wireless sensor networks is expected to continue growing due to the increasing demand for real-time data and the need for efficient and cost-effective solutions for various applications.

What are the market trends shaping the Wireless Sensor Network (WSN) Industry?

  • The emergence of wearable technologies is the upcoming market trend. Wearable technology, which encompasses devices such as smartwatches, smart glasses, heart rate monitors, and fitness tracking gadgets, is witnessing significant growth due to increasing consumer interest in enhancing daily life activities. Infineon Technologies, a leading magnetic sensor manufacturer, is among those investing in MEMS sensors to support this emerging technology. The adoption of wearable devices is not limited to the consumer market; industries are also exploring their potential.
  • The market dynamics are favorable, with several companies experimenting with wearable technologies to offer innovative solutions. The integration of advanced sensors and connectivity options is expected to fuel the growth of this sector. Wearable technology is poised to revolutionize various industries, from healthcare to manufacturing, and its potential is immense.

What challenges does the Wireless Sensor Network (WSN) Industry face during its growth?

  • Growing challenges in delivering high-quality wireless sensor networks at low cost is a key challenge affecting the industry growth. The wireless sensor market is witnessing significant growth due to the increasing demand for industrial automation. companies of wireless sensors are focusing on providing easily customizable and cost-effective solutions to cater to this demand. However, customization remains a key factor contributing to the expense of wireless sensors. End-users' businesses facilitate accurate customization and reliable delivery, ensuring the sensors meet specific industrial process control requirements.
  • The cost of sensors has decreased over the years, primarily due to the availability of off-the-shelf varieties. However, sensors customized for specific applications will remain more technologically advanced and, consequently, more expensive during the forecast period. Engineers and system developers continue to explore enhanced wireless sensor products to expand their offerings.

Exclusive Customer Landscape

The market forecasting report includes the adoption lifecycle of the market, covering the innovator's stage to the laggard's stage. It focuses on adoption rates in different regions based on penetration. Furthermore, the market report also includes key purchase criteria and drivers of price sensitivity to help companies evaluate and develop their market growth analysis strategies.

Wireless Sensor Network (WSN) Market Share by Geography

 Customer Landscape

Key Companies & Market Insights

Companies are implementing various strategies, such as strategic alliances, market forecast, partnerships, mergers and acquisitions, geographical expansion, and product/service launches, to enhance their presence in the industry.

The industry research and growth report includes detailed analyses of the competitive landscape of the market and information about key companies, including:

  • ABB Ltd.
  • Advantech Co. Ltd.
  • Analog Devices Inc.
  • Banner Engineering Corp.
  • Cisco Systems Inc.
  • Dell Technologies Inc.
  • Emerson Electric Co.
  • Endress Hauser Group Services AG
  • Honeywell International Inc.
  • Intel Corp.
  • International Business Machines Corp.
  • Lantronix Inc.
  • Microsoft Corp.
  • NXP Semiconductors NV
  • Schneider Electric SE
  • Siemens AG
  • STMicroelectronics International N.V.
  • TE Connectivity Ltd.
  • Texas Instruments Inc.
  • Yokogawa Electric Corp.

Qualitative and quantitative analysis of companies has been conducted to help clients understand the wider business environment as well as the strengths and weaknesses of key industry players. Data is qualitatively analyzed to categorize companies as pure play, category-focused, industry-focused, and diversified; it is quantitatively analyzed to categorize companies as dominant, leading, strong, tentative, and weak.

Research Analyst Overview

Wireless Sensor Networks (WSNs) have emerged as a crucial technology in various industries, driving digital transformation and optimizing operational efficiency. These networks enable the collection, transmission, and analysis of data from various sensors in real-time, fostering the growth of the Internet-of-Things (IoT) ecosystem. The WSN market encompasses a wide range of applications, including robotics, smart cities, autonomous vehicles, and industrial automation. In robotics, WSNs facilitate the integration of sensors and actuators, enhancing the capabilities of robotic systems. In smart cities, WSNs contribute to the development of intelligent urban infrastructure, enabling efficient energy management, traffic control, and public safety. WSNs play a significant role in the automotive and transportation sector, enabling real-time vehicle monitoring, predictive maintenance, and traffic management.

Moreover, in the industrial sector, WSNs are utilized in smart factories and intelligent manufacturing processes, ensuring optimal production efficiency and reducing downtime. The freight railroad industry also benefits from WSNs, with applications ranging from track monitoring and predictive maintenance to real-time cargo monitoring and logistics optimization. Wearable sensors and Body Area Networks (BANs) are another key application area for WSNs, with applications in healthcare, fitness, and wellness. The WSN market comprises various components, including hardware, software, and services. Hardware components include sensors, actuators, and communication modules. Sensors come in various types, such as ambient light sensors, temperature sensors, heart rate sensors, pressure sensors, accelerometers, and blood glucose sensors, among others.

Furthermore, software components include middleware, data processing, and analytics tools. Services include installation, integration, and maintenance. WSNs utilize various connectivity technologies, including Bluetooth, Bluetooth Smart, Wi-Fi, Near-Field Communication (NFC), cellular networks, and Bluetooth/Wi-Fi. These networks facilitate seamless data transmission and enable remote monitoring and control of devices. WSNs are also used in building automation, security systems, access control systems, video surveillance, energy efficiency, and M2M connections. In healthcare, WSNs are utilized for remote patient monitoring, diagnostics, and medical research. In agriculture, WSNs enable precision farming and livestock monitoring. In aerospace and defense, WSNs are used for real-time monitoring of aircraft systems and military applications.

Market Scope

Report Coverage

Details

Page number

178

Base year

2023

Historic period

2018-2022

Forecast period

2024-2028

Growth momentum & CAGR

Accelerate at a CAGR of 17.71%

Market growth 2024-2028

USD 110.73 billion

Market structure

Fragmented

YoY growth 2023-2024(%)

16.79

Key countries

US, China, Germany, UK, and Japan

Competitive landscape

Leading Companies, Market Positioning of Companies, Competitive Strategies, and Industry Risks

Request Free Sample

What are the Key Data Covered in this Wireless Sensor Network (WSN) Market Research and Growth Report?

  • CAGR of the Wireless Sensor Network (WSN) industry during the forecast period
  • Detailed information on factors that will drive the market growth and forecasting between 2024 and 2028
  • Precise estimation of the size of the market and its contribution of the industry in focus to the parent market
  • Accurate predictions about upcoming growth and trends and changes in consumer behaviour
  • Growth of the market across North America, APAC, Europe, South America, and Middle East and Africa
  • Thorough analysis of the market's competitive landscape and detailed information about companies
  • Comprehensive analysis of factors that will challenge the market growth of industry companies

We can help! Our analysts can customize this market research report to meet your requirements.

Get in touch

1 Executive Summary

  • 1.1 Market overview
    • Executive Summary - Chart on Market Overview
    • Executive Summary - Data Table on Market Overview
    • Executive Summary - Chart on Global Market Characteristics
    • Executive Summary - Chart on Market by Geography
    • Executive Summary - Chart on Market Segmentation by Component
    • Executive Summary - Chart on Market Segmentation by End-user
    • Executive Summary - Chart on Incremental Growth
    • Executive Summary - Data Table on Incremental Growth
    • Executive Summary - Chart on Company Market Positioning

2 Market Landscape

  • 2.1 Market ecosystem
    • Parent Market
    • Data Table on - Parent Market
  • 2.2 Market characteristics
    • Market characteristics analysis
  • 2.3 Value chain analysis
    • Value Chain Analysis

3 Market Sizing

  • 3.1 Market definition
    • Offerings of companies included in the market definition
  • 3.2 Market segment analysis
    • Market segments
  • 3.3 Market size 2023
    • 3.4 Market outlook: Forecast for 2023-2028
      • Chart on Global - Market size and forecast 2023-2028 ($ million)
      • Data Table on Global - Market size and forecast 2023-2028 ($ million)
      • Chart on Global Market: Year-over-year growth 2023-2028 (%)
      • Data Table on Global Market: Year-over-year growth 2023-2028 (%)

    4 Historic Market Size

    • 4.1 Global Wireless Sensor Network (WSN) Market 2018 - 2022
      • Historic Market Size - Data Table on Global Wireless Sensor Network (WSN) Market 2018 - 2022 ($ million)
    • 4.2 Component segment analysis 2018 - 2022
      • Historic Market Size - Component Segment 2018 - 2022 ($ million)
    • 4.3 End-user segment analysis 2018 - 2022
      • Historic Market Size - End-user Segment 2018 - 2022 ($ million)
    • 4.4 Geography segment analysis 2018 - 2022
      • Historic Market Size - Geography Segment 2018 - 2022 ($ million)
    • 4.5 Country segment analysis 2018 - 2022
      • Historic Market Size - Country Segment 2018 - 2022 ($ million)

    5 Five Forces Analysis

    • 5.1 Five forces summary
      • Five forces analysis - Comparison between 2023 and 2028
    • 5.2 Bargaining power of buyers
      • Bargaining power of buyers - Impact of key factors 2023 and 2028
    • 5.3 Bargaining power of suppliers
      • Bargaining power of suppliers - Impact of key factors in 2023 and 2028
    • 5.4 Threat of new entrants
      • Threat of new entrants - Impact of key factors in 2023 and 2028
    • 5.5 Threat of substitutes
      • Threat of substitutes - Impact of key factors in 2023 and 2028
    • 5.6 Threat of rivalry
      • Threat of rivalry - Impact of key factors in 2023 and 2028
    • 5.7 Market condition
      • Chart on Market condition - Five forces 2023 and 2028

    6 Market Segmentation by Component

    • 6.1 Market segments
      • Chart on Component - Market share 2023-2028 (%)
      • Data Table on Component - Market share 2023-2028 (%)
    • 6.2 Comparison by Component
      • Chart on Comparison by Component
      • Data Table on Comparison by Component
    • 6.3 Hardware - Market size and forecast 2023-2028
      • Chart on Hardware - Market size and forecast 2023-2028 ($ million)
      • Data Table on Hardware - Market size and forecast 2023-2028 ($ million)
      • Chart on Hardware - Year-over-year growth 2023-2028 (%)
      • Data Table on Hardware - Year-over-year growth 2023-2028 (%)
    • 6.4 Software - Market size and forecast 2023-2028
      • Chart on Software - Market size and forecast 2023-2028 ($ million)
      • Data Table on Software - Market size and forecast 2023-2028 ($ million)
      • Chart on Software - Year-over-year growth 2023-2028 (%)
      • Data Table on Software - Year-over-year growth 2023-2028 (%)
    • 6.5 Services - Market size and forecast 2023-2028
      • Chart on Services - Market size and forecast 2023-2028 ($ million)
      • Data Table on Services - Market size and forecast 2023-2028 ($ million)
      • Chart on Services - Year-over-year growth 2023-2028 (%)
      • Data Table on Services - Year-over-year growth 2023-2028 (%)
    • 6.6 Market opportunity by Component
      • Market opportunity by Component ($ million)
      • Data Table on Market opportunity by Component ($ million)

    7 Market Segmentation by End-user

    • 7.1 Market segments
      • Chart on End-user - Market share 2023-2028 (%)
      • Data Table on End-user - Market share 2023-2028 (%)
    • 7.2 Comparison by End-user
      • Chart on Comparison by End-user
      • Data Table on Comparison by End-user
    • 7.3 Building automation - Market size and forecast 2023-2028
      • Chart on Building automation - Market size and forecast 2023-2028 ($ million)
      • Data Table on Building automation - Market size and forecast 2023-2028 ($ million)
      • Chart on Building automation - Year-over-year growth 2023-2028 (%)
      • Data Table on Building automation - Year-over-year growth 2023-2028 (%)
    • 7.4 Wearable devices - Market size and forecast 2023-2028
      • Chart on Wearable devices - Market size and forecast 2023-2028 ($ million)
      • Data Table on Wearable devices - Market size and forecast 2023-2028 ($ million)
      • Chart on Wearable devices - Year-over-year growth 2023-2028 (%)
      • Data Table on Wearable devices - Year-over-year growth 2023-2028 (%)
    • 7.5 Healthcare - Market size and forecast 2023-2028
      • Chart on Healthcare - Market size and forecast 2023-2028 ($ million)
      • Data Table on Healthcare - Market size and forecast 2023-2028 ($ million)
      • Chart on Healthcare - Year-over-year growth 2023-2028 (%)
      • Data Table on Healthcare - Year-over-year growth 2023-2028 (%)
    • 7.6 Automotive and transportation - Market size and forecast 2023-2028
      • Chart on Automotive and transportation - Market size and forecast 2023-2028 ($ million)
      • Data Table on Automotive and transportation - Market size and forecast 2023-2028 ($ million)
      • Chart on Automotive and transportation - Year-over-year growth 2023-2028 (%)
      • Data Table on Automotive and transportation - Year-over-year growth 2023-2028 (%)
    • 7.7 Others - Market size and forecast 2023-2028
      • Chart on Others - Market size and forecast 2023-2028 ($ million)
      • Data Table on Others - Market size and forecast 2023-2028 ($ million)
      • Chart on Others - Year-over-year growth 2023-2028 (%)
      • Data Table on Others - Year-over-year growth 2023-2028 (%)
    • 7.8 Market opportunity by End-user
      • Market opportunity by End-user ($ million)
      • Data Table on Market opportunity by End-user ($ million)

    8 Customer Landscape

    • 8.1 Customer landscape overview
      • Analysis of price sensitivity, lifecycle, customer purchase basket, adoption rates, and purchase criteria

    9 Geographic Landscape

    • 9.1 Geographic segmentation
      • Chart on Market share by geography 2023-2028 (%)
      • Data Table on Market share by geography 2023-2028 (%)
    • 9.2 Geographic comparison
      • Chart on Geographic comparison
      • Data Table on Geographic comparison
    • 9.3 North America - Market size and forecast 2023-2028
      • Chart on North America - Market size and forecast 2023-2028 ($ million)
      • Data Table on North America - Market size and forecast 2023-2028 ($ million)
      • Chart on North America - Year-over-year growth 2023-2028 (%)
      • Data Table on North America - Year-over-year growth 2023-2028 (%)
    • 9.4 APAC - Market size and forecast 2023-2028
      • Chart on APAC - Market size and forecast 2023-2028 ($ million)
      • Data Table on APAC - Market size and forecast 2023-2028 ($ million)
      • Chart on APAC - Year-over-year growth 2023-2028 (%)
      • Data Table on APAC - Year-over-year growth 2023-2028 (%)
    • 9.5 Europe - Market size and forecast 2023-2028
      • Chart on Europe - Market size and forecast 2023-2028 ($ million)
      • Data Table on Europe - Market size and forecast 2023-2028 ($ million)
      • Chart on Europe - Year-over-year growth 2023-2028 (%)
      • Data Table on Europe - Year-over-year growth 2023-2028 (%)
    • 9.6 South America - Market size and forecast 2023-2028
      • Chart on South America - Market size and forecast 2023-2028 ($ million)
      • Data Table on South America - Market size and forecast 2023-2028 ($ million)
      • Chart on South America - Year-over-year growth 2023-2028 (%)
      • Data Table on South America - Year-over-year growth 2023-2028 (%)
    • 9.7 Middle East and Africa - Market size and forecast 2023-2028
      • Chart on Middle East and Africa - Market size and forecast 2023-2028 ($ million)
      • Data Table on Middle East and Africa - Market size and forecast 2023-2028 ($ million)
      • Chart on Middle East and Africa - Year-over-year growth 2023-2028 (%)
      • Data Table on Middle East and Africa - Year-over-year growth 2023-2028 (%)
    • 9.8 US - Market size and forecast 2023-2028
      • Chart on US - Market size and forecast 2023-2028 ($ million)
      • Data Table on US - Market size and forecast 2023-2028 ($ million)
      • Chart on US - Year-over-year growth 2023-2028 (%)
      • Data Table on US - Year-over-year growth 2023-2028 (%)
    • 9.9 China - Market size and forecast 2023-2028
      • Chart on China - Market size and forecast 2023-2028 ($ million)
      • Data Table on China - Market size and forecast 2023-2028 ($ million)
      • Chart on China - Year-over-year growth 2023-2028 (%)
      • Data Table on China - Year-over-year growth 2023-2028 (%)
    • 9.10 Germany - Market size and forecast 2023-2028
      • Chart on Germany - Market size and forecast 2023-2028 ($ million)
      • Data Table on Germany - Market size and forecast 2023-2028 ($ million)
      • Chart on Germany - Year-over-year growth 2023-2028 (%)
      • Data Table on Germany - Year-over-year growth 2023-2028 (%)
    • 9.11 UK - Market size and forecast 2023-2028
      • Chart on UK - Market size and forecast 2023-2028 ($ million)
      • Data Table on UK - Market size and forecast 2023-2028 ($ million)
      • Chart on UK - Year-over-year growth 2023-2028 (%)
      • Data Table on UK - Year-over-year growth 2023-2028 (%)
    • 9.12 Japan - Market size and forecast 2023-2028
      • Chart on Japan - Market size and forecast 2023-2028 ($ million)
      • Data Table on Japan - Market size and forecast 2023-2028 ($ million)
      • Chart on Japan - Year-over-year growth 2023-2028 (%)
      • Data Table on Japan - Year-over-year growth 2023-2028 (%)
    • 9.13 Market opportunity by geography
      • Market opportunity by geography ($ million)
      • Data Tables on Market opportunity by geography ($ million)

    10 Drivers, Challenges, and Opportunity/Restraints

    • 10.1 Market drivers
      • 10.2 Market challenges
        • 10.3 Impact of drivers and challenges
          • Impact of drivers and challenges in 2023 and 2028
        • 10.4 Market opportunities/restraints

          11 Competitive Landscape

          • 11.1 Overview
            • 11.2 Competitive Landscape
              • Overview on criticality of inputs and factors of differentiation
            • 11.3 Landscape disruption
              • Overview on factors of disruption
            • 11.4 Industry risks
              • Impact of key risks on business

            12 Competitive Analysis

            • 12.1 Companies profiled
              • Companies covered
            • 12.2 Market positioning of companies
              • Matrix on companies position and classification
            • 12.3 ABB Ltd.
              • ABB Ltd. - Overview
              • ABB Ltd. - Business segments
              • ABB Ltd. - Key news
              • ABB Ltd. - Key offerings
              • ABB Ltd. - Segment focus
            • 12.4 Analog Devices Inc.
              • Analog Devices Inc. - Overview
              • Analog Devices Inc. - Business segments
              • Analog Devices Inc. - Key news
              • Analog Devices Inc. - Key offerings
              • Analog Devices Inc. - Segment focus
            • 12.5 Banner Engineering Corp.
              • Banner Engineering Corp. - Overview
              • Banner Engineering Corp. - Product / Service
              • Banner Engineering Corp. - Key offerings
            • 12.6 Cisco Systems Inc.
              • Cisco Systems Inc. - Overview
              • Cisco Systems Inc. - Business segments
              • Cisco Systems Inc. - Key news
              • Cisco Systems Inc. - Key offerings
              • Cisco Systems Inc. - Segment focus
            • 12.7 Dell Technologies Inc.
              • Dell Technologies Inc. - Overview
              • Dell Technologies Inc. - Business segments
              • Dell Technologies Inc. - Key news
              • Dell Technologies Inc. - Key offerings
              • Dell Technologies Inc. - Segment focus
            • 12.8 Emerson Electric Co.
              • Emerson Electric Co. - Overview
              • Emerson Electric Co. - Business segments
              • Emerson Electric Co. - Key news
              • Emerson Electric Co. - Key offerings
              • Emerson Electric Co. - Segment focus
            • 12.9 Endress Hauser Group Services AG
              • Endress Hauser Group Services AG - Overview
              • Endress Hauser Group Services AG - Product / Service
              • Endress Hauser Group Services AG - Key news
              • Endress Hauser Group Services AG - Key offerings
            • 12.10 Honeywell International Inc.
              • Honeywell International Inc. - Overview
              • Honeywell International Inc. - Business segments
              • Honeywell International Inc. - Key news
              • Honeywell International Inc. - Key offerings
              • Honeywell International Inc. - Segment focus
            • 12.11 International Business Machines Corp.
              • International Business Machines Corp. - Overview
              • International Business Machines Corp. - Business segments
              • International Business Machines Corp. - Key news
              • International Business Machines Corp. - Key offerings
              • International Business Machines Corp. - Segment focus
            • 12.12 NXP Semiconductors NV
              • NXP Semiconductors NV - Overview
              • NXP Semiconductors NV - Product / Service
              • NXP Semiconductors NV - Key news
              • NXP Semiconductors NV - Key offerings
            • 12.13 Schneider Electric SE
              • Schneider Electric SE - Overview
              • Schneider Electric SE - Business segments
              • Schneider Electric SE - Key news
              • Schneider Electric SE - Key offerings
              • Schneider Electric SE - Segment focus
            • 12.14 Siemens AG
              • Siemens AG - Overview
              • Siemens AG - Business segments
              • Siemens AG - Key news
              • Siemens AG - Key offerings
              • Siemens AG - Segment focus
            • 12.15 STMicroelectronics NV
              • STMicroelectronics NV - Overview
              • STMicroelectronics NV - Business segments
              • STMicroelectronics NV - Key news
              • STMicroelectronics NV - Key offerings
              • STMicroelectronics NV - Segment focus
            • 12.16 Texas Instruments Inc.
              • Texas Instruments Inc. - Overview
              • Texas Instruments Inc. - Business segments
              • Texas Instruments Inc. - Key news
              • Texas Instruments Inc. - Key offerings
              • Texas Instruments Inc. - Segment focus
            • 12.17 Yokogawa Electric Corp.
              • Yokogawa Electric Corp. - Overview
              • Yokogawa Electric Corp. - Business segments
              • Yokogawa Electric Corp. - Key news
              • Yokogawa Electric Corp. - Key offerings
              • Yokogawa Electric Corp. - Segment focus

            13 Appendix

            • 13.1 Scope of the report
              • 13.2 Inclusions and exclusions checklist
                • Inclusions checklist
                • Exclusions checklist
              • 13.3 Currency conversion rates for US$
                • Currency conversion rates for US$
              • 13.4 Research methodology
                • Research methodology
              • 13.5 Data procurement
                • Information sources
              • 13.6 Data validation
                • Data validation
              • 13.7 Validation techniques employed for market sizing
                • Validation techniques employed for market sizing
              • 13.8 Data synthesis
                • Data synthesis
              • 13.9 360 degree market analysis
                • 360 degree market analysis
              • 13.10 List of abbreviations
                • List of abbreviations

              Research Methodology

              Technavio presents a detailed picture of the market by way of study, synthesis, and summation of data from multiple sources. The analysts have presented the various facets of the market with a particular focus on identifying the key industry influencers. The data thus presented is comprehensive, reliable, and the result of extensive research, both primary and secondary.

              INFORMATION SOURCES

              Primary sources

              • Manufacturers and suppliers
              • Channel partners
              • Industry experts
              • Strategic decision makers

              Secondary sources

              • Industry journals and periodicals
              • Government data
              • Financial reports of key industry players
              • Historical data
              • Press releases

              DATA ANALYSIS

              Data Synthesis

              • Collation of data
              • Estimation of key figures
              • Analysis of derived insights

              Data Validation

              • Triangulation with data models
              • Reference against proprietary databases
              • Corroboration with industry experts

              REPORT WRITING

              Qualitative

              • Market drivers
              • Market challenges
              • Market trends
              • Five forces analysis

              Quantitative

              • Market size and forecast
              • Market segmentation
              • Geographical insights
              • Competitive landscape

              Interested in this report?

              Get your sample now to see our research methodology and insights!

              Download Now

              Frequently Asked Questions

              Wireless Sensor Network (Wsn) market growth will increase by $ 110.73 bn during 2024-2028 .

              The Wireless Sensor Network (Wsn) market is expected to grow at a CAGR of 17.71% during 2024-2028 .

              Wireless Sensor Network (Wsn) market is segmented by Component( Hardware, Software, Services, Automotive and transportation, Others) End-user( Building automation, Wearable devices, Healthcare, Automotive and transportation, Others)

              ABB Ltd., Advantech Co. Ltd., Analog Devices Inc., Banner Engineering Corp., Cisco Systems Inc., Dell Technologies Inc., Emerson Electric Co., Endress Hauser Group Services AG, Honeywell International Inc., Intel Corp., International Business Machines Corp., Lantronix Inc., Microsoft Corp., NXP Semiconductors NV, Schneider Electric SE, Siemens AG, STMicroelectronics International N.V., TE Connectivity Ltd., Texas Instruments Inc., Yokogawa Electric Corp. are a few of the key vendors in the Wireless Sensor Network (Wsn) market.

              North America will register the highest growth rate of 29% among the other regions. Therefore, the Wireless Sensor Network (Wsn) market in North America is expected to garner significant business opportunities for the vendors during the forecast period.

              US, China, Germany, UK, Japan

              • Increasing adoption of industry 4.0The global demand for wireless sensor networks is driven by the growing adoption of Industry 4.0. The new industrial revolution is the driving factor this market.
              • known as Industry 4.0 is the driving factor this market.
              • involves the integration of cutting-edge technologies such as IoT is the driving factor this market.
              • cloud computing is the driving factor this market.
              • and data analytics to build smart factories. Wireless sensor networks are a crucial part of Industry 4.0 as these make it possible for end-users to monitor and manage industrial processes in real time. Wireless sensor networks provide advantages such as improved efficiency is the driving factor this market.
              • reduced downtime is the driving factor this market.
              • and cost-effectiveness is the driving factor this market.
              • which are increasingly needed for the digitalization and automation of manufacturing and other industrial processes. Thus is the driving factor this market.
              • the increasing relevance of Industry 4.0 in many end-user industries like manufacturing industry is anticipated to fuel the growth of the global wireless sensor networks market during the forecast period. is the driving factor this market.

              The Wireless Sensor Network (Wsn) market vendors should focus on grabbing business opportunities from the Hardware segment as it accounted for the largest market share in the base year.