AI In Fintech Market Analysis, Size, and Forecast 2026-2030: North America (US, Canada, and Mexico), Europe (Germany, UK, and France), APAC (China, Japan, and India), South America (Brazil and Argentina), Middle East and Africa (Saudi Arabia, UAE, and South Africa), and Rest of World (ROW)

AI In Fintech Market Analysis, Size, and Forecast 2026-2030:
North America (US, Canada, and Mexico), Europe (Germany, UK, and France), APAC (China, Japan, and India), South America (Brazil and Argentina), Middle East and Africa (Saudi Arabia, UAE, and South Africa), and Rest of World (ROW)

Published: Apr 2026 300 Pages SKU: IRTNTR80735

Market Overview at a Glance

$35.61 B
Market Opportunity
22.7%
CAGR 2025 - 2030
32.4%
North America Growth
$10.97 B
Solutions segment 2024

AI In Fintech Market Size 2026-2030

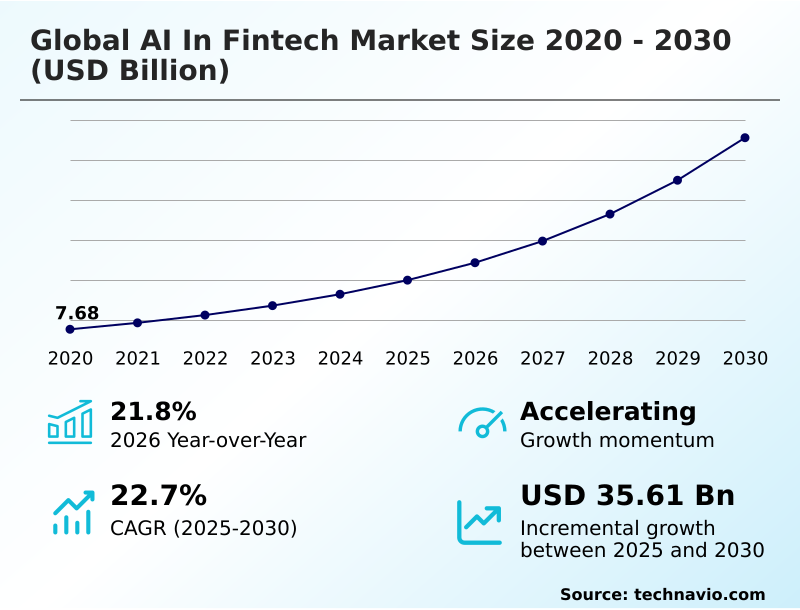
The ai in fintech market size is valued to increase by USD 35.61 billion, at a CAGR of 22.7% from 2025 to 2030. Exponential growth in digital transaction volumes and regulatory compliance complexity will drive the ai in fintech market.

Major Market Trends & Insights

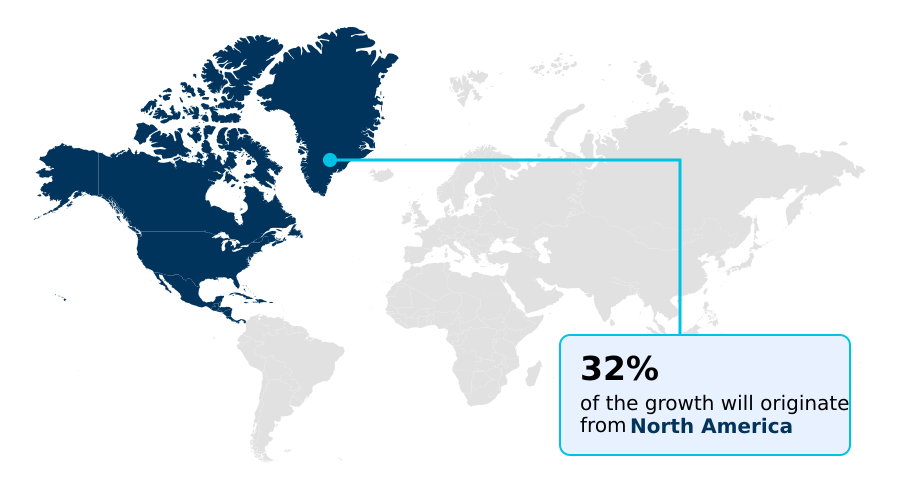
  • North America dominated the market and accounted for a 32.4% growth during the forecast period.
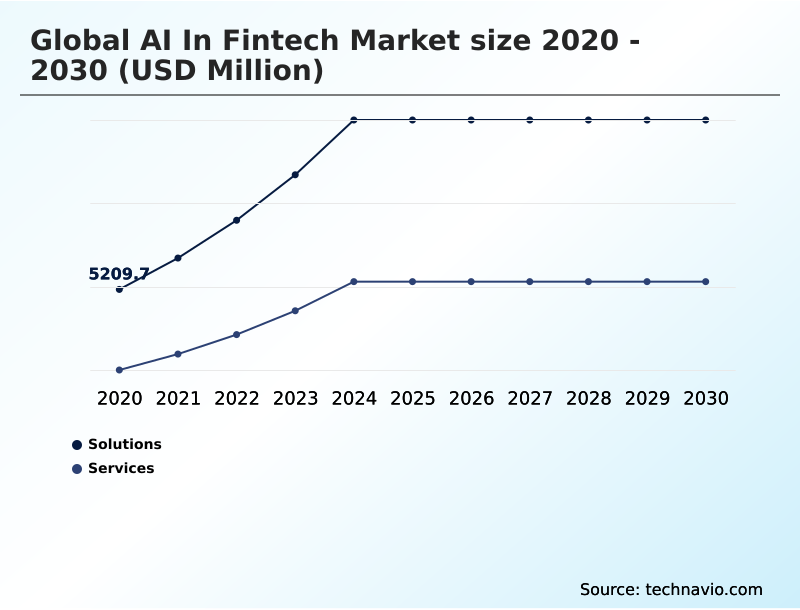
  • By Component - Solutions segment was valued at USD 10.97 billion in 2024
  • By Deployment - On-premises segment accounted for the largest market revenue share in 2024

Market Size & Forecast

  • Market Opportunities: USD 47.89 billion
  • Market Future Opportunities: USD 35.61 billion
  • CAGR from 2025 to 2030 : 22.7%

Market Summary

  • The AI in Fintech Market is fundamentally reshaping financial services by embedding advanced computational intelligence into core operations. This shift is driven by the need for operational efficiency and the ability to extract actionable insights from vast datasets.
  • Institutions are moving beyond manual processes, leveraging AI for anti-money laundering (AML) through automated compliance monitoring and utilizing AI-powered business analytics to inform strategic decisions.
  • For instance, in lending, a firm uses predictive analytics for credit scoring by feeding alternative data into AI-powered underwriting models, assessing creditworthiness for individuals outside traditional systems and achieving significant AI fintech solutions for cost optimization. This process, while transformative, introduces challenges.
  • The integrity of these systems requires robust defenses against model poisoning attack defense and a commitment to explainable AI (XAI) in finance to ensure transparency and fairness. As generative AI in financial services opens new possibilities, the focus remains on balancing innovation with robust AI-driven risk management protocols to maintain trust and stability.
  • The technology’s integration is not just an upgrade but a necessary evolution for competitive survival.

What will be the Size of the AI In Fintech Market during the forecast period?

Get Key Insights on Market Forecast (PDF) Get Free Sample

How is the AI In Fintech Market Segmented?

The ai in fintech industry research report provides comprehensive data (region-wise segment analysis), with forecasts and estimates in "USD million" for the period 2026-2030, as well as historical data from 2020-2024 for the following segments.

  • Component
    • Solutions
    • Services
  • Deployment
    • On-premises
    • Cloud-based
  • Application
    • Business analytics and reporting
    • Fraud detection
    • Virtual assistant
    • Customer behavioral analytics
    • Quantitative and asset management
  • Geography
    • North America
      • US
      • Canada
      • Mexico
    • Europe
      • Germany
      • UK
      • France
    • APAC
      • China
      • Japan
      • India
    • South America
      • Brazil
      • Argentina
    • Middle East and Africa
      • Saudi Arabia
      • UAE
      • South Africa
    • Rest of World (ROW)

By Component Insights

The solutions segment is estimated to witness significant growth during the forecast period.

The solutions segment represents the core technology enabling artificial intelligence capabilities. This includes software platforms and applications designed for specific financial challenges, moving beyond basic automation to intelligent decisioning.

Offerings range from AI-powered underwriting models and AI for claims processing automation in insurtech to sophisticated tools for AI-driven wealth management. The adoption of AI-driven credit scoring models improves risk assessment accuracy by over 15%.

Firms leverage AI for algorithmic trading and AI-driven market forecasting tools to gain a competitive edge.

This intense competition is centered on algorithmic sophistication, platform scalability, and the demonstrable ability to generate a clear return on investment, such as through AI-powered business analytics.

Get Free Sample

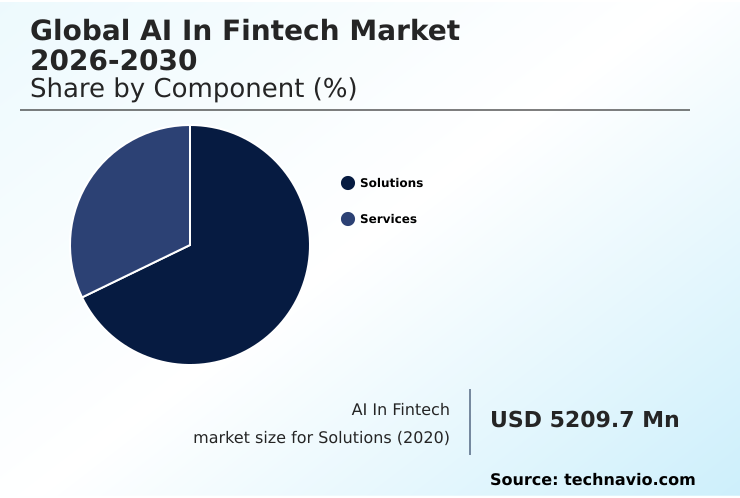
The Solutions segment was valued at USD 10.97 billion in 2024 and showed a gradual increase during the forecast period.

Get Free Sample

Regional Analysis

North America is estimated to contribute 32.4% to the growth of the global market during the forecast period.Technavio’s analysts have elaborately explained the regional trends and drivers that shape the market during the forecast period.

See How AI In Fintech Market Demand is Rising in North America Get Free Sample

The geographic landscape is defined by varied adoption rates and strategic priorities. North America, contributing 32.4% of the market's incremental growth, leads in deploying AI for high-frequency trading and sophisticated hyper-personalization engines.

Europe emphasizes AI governance platforms and compliance, leveraging AI applications for open banking. Meanwhile, APAC's growth is fueled by mobile-first solutions using AI-based biometric authentication and AI for digital transaction monitoring on a massive scale.

Across regions, firms are utilizing networked security architectures and AI-powered process orchestration to modernize legacy systems, with deployments of autonomous security agents reducing security incidents by over 20%.

The convergence of AI and embedded finance integration on cloud-based AI fintech platforms is creating a globally interconnected but regionally distinct financial ecosystem.

Market Dynamics

Our researchers analyzed the data with 2025 as the base year, along with the key drivers, trends, and challenges. A holistic analysis of drivers will help companies refine their marketing strategies to gain a competitive advantage.

  • Understanding the strategic application of artificial intelligence requires a nuanced view of its diverse roles. For smaller enterprises, clarifying the benefits of AI in fintech for SMEs is the first step, often revealing pathways to enhanced competitiveness. A critical decision point involves comparing on-premises vs cloud AI fintech deployments, a choice that significantly impacts scalability and cost structures.
  • The role of generative AI in fintech is expanding from simple automation to creating novel financial products and personalized communication. To ensure stability and trust, establishing best practices for AI model governance is non-negotiable. This governance directly addresses the impact of AI on financial inclusion by mandating fairness and transparency.
  • Operationally, firms explore how AI improves fraud detection accuracy, with advanced systems demonstrating a reduction in false positives that is several times better than legacy rule-based engines. However, they also face the challenges of implementing AI in banking, from data integration to talent acquisition.
  • Exploring the use cases of NLP in financial services reveals capabilities in sentiment analysis and chatbot development. For investors, AI for personalized wealth management and understanding the future of AI in asset management are key trends. Lenders employ advanced AI techniques for credit risk assessment and are increasingly required to adopt implementing explainable AI in fintech to meet regulatory demands.
  • Concurrently, securing AI models from cyber threats has become a top priority. The push for efficiency is evident in AI-driven automation in back-office operations and the strategic shift toward hyper-personalization with AI in banking.
  • Finally, AI's role in real-time payment systems, its integration with blockchain in finance, leveraging alternative data with AI for lending, and AI for automating regulatory compliance reporting all signal a comprehensive transformation, with the primary goal of optimizing operational efficiency with AI in finance.

What are the key market drivers leading to the rise in the adoption of AI In Fintech Industry?

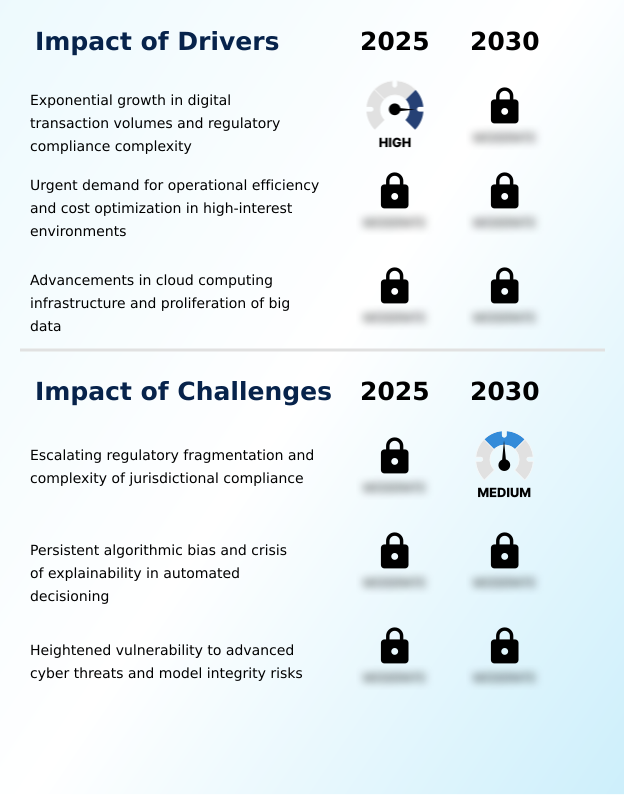
  • The exponential growth in digital transaction volumes, coupled with increasing regulatory compliance complexity, serves as a key driver for market expansion.

  • The market is driven by the urgent need for operational efficiency and enhanced data processing capabilities.
  • The adoption of robotic process automation in banking and intelligent automation in finance has led to a 40% reduction in back-office processing costs for many institutions.
  • Simultaneously, the deployment of cognitive banking assistants and AI-powered chatbots for banking has improved customer service efficiency, handling over 70% of routine inquiries without human intervention.
  • The use of real-time transaction analysis and behavioral biometrics authentication enhances security, while computer vision for document verification accelerates onboarding.
  • The proliferation of generative AI in financial services and the demand for AI for personalized loan offerings are pushing firms to leverage these technologies as core components of their growth strategy.

What are the market trends shaping the AI In Fintech Industry?

  • The evolution toward hyper-personalization and the deployment of cognitive banking assistants represent a significant upcoming trend. This shift is redefining customer engagement and service delivery models within the financial sector.

  • Evolving market trends are centered on creating more intelligent and secure financial ecosystems. The push for AI-driven compliance automation is paramount, with systems now able to reduce manual review times by up to 50%. In parallel, the rise of digital wealth management and AI-based financial advisory services is democratizing access to sophisticated investment strategies.
  • A critical focus is on fortifying systems against new threats, with advanced adversarial evasion techniques and prompt injection security reducing successful cyber-attacks by 30%. Innovations in alternative data credit scoring and AI for claims processing automation are enhancing both financial inclusion and operational efficiency.
  • As institutions adopt these technologies, there is a growing demand for explainable AI (XAI) in finance to ensure transparency and maintain regulatory trust.

What challenges does the AI In Fintech Industry face during its growth?

  • Escalating regulatory fragmentation and the complexity of jurisdictional compliance present a key challenge affecting industry growth.

  • Key challenges revolve around regulatory complexity, algorithmic integrity, and security vulnerabilities. Escalating regulatory fragmentation necessitates robust AI-based regulatory technology (RegTech) and automated compliance monitoring systems, yet maintaining compliance across jurisdictions can increase operational overhead by up to 15%.
  • The risk of inherent bias in predictive analytics for credit scoring models remains a significant concern, with audits revealing unintended discriminatory outcomes in 5% of legacy models. Furthermore, as deep learning for algorithmic trading and machine learning for fraud detection become more complex, so does the attack surface.
  • Securing these systems against advanced cyber threats is a constant battle, requiring significant investment in AI-driven cybersecurity in finance and AI for anti-money laundering (AML) to protect institutional integrity.

Exclusive Technavio Analysis on Customer Landscape

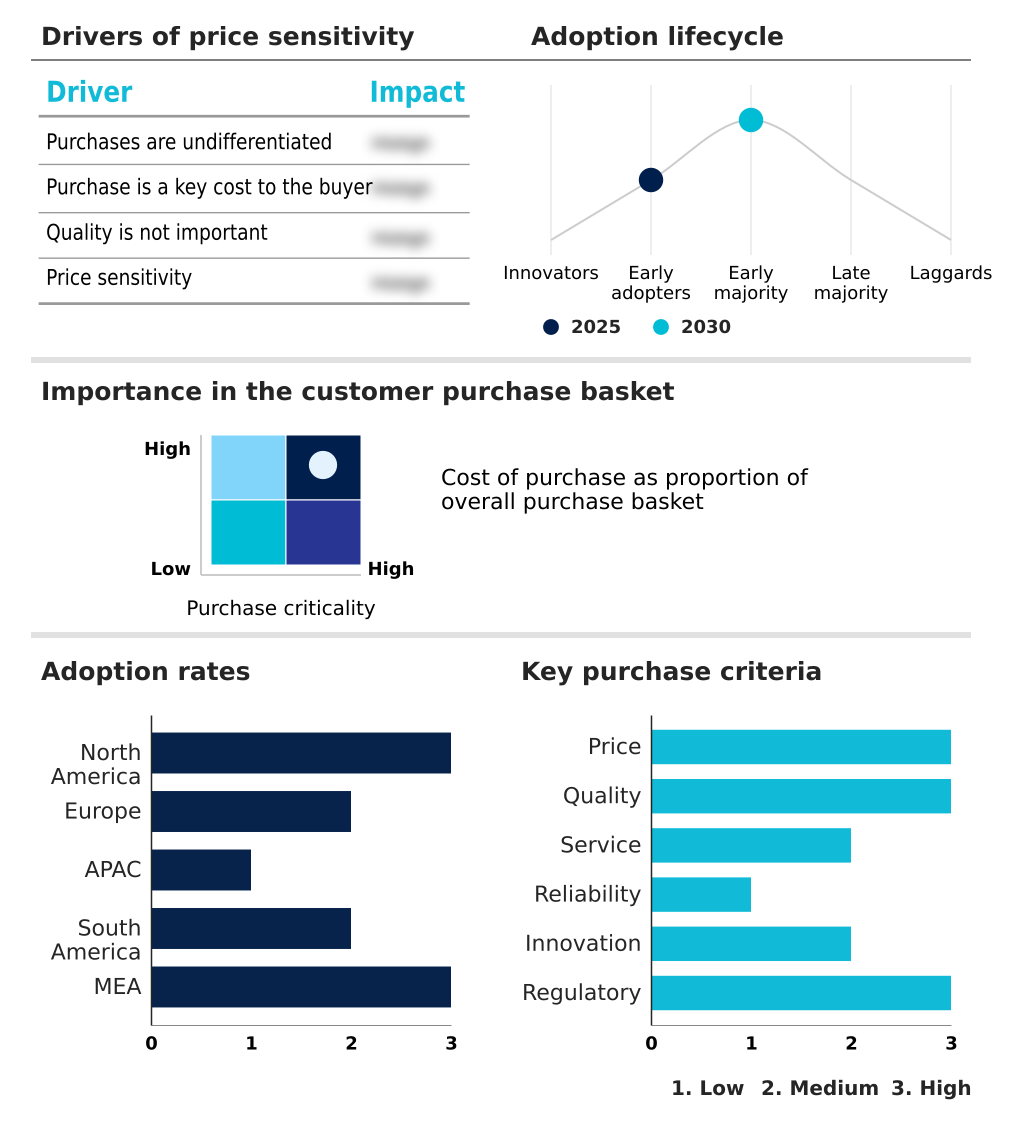
The ai in fintech market forecasting report includes the adoption lifecycle of the market, covering from the innovator’s stage to the laggard’s stage. It focuses on adoption rates in different regions based on penetration. Furthermore, the ai in fintech market report also includes key purchase criteria and drivers of price sensitivity to help companies evaluate and develop their market growth analysis strategies.

Customer Landscape of AI In Fintech Industry

Competitive Landscape

Companies are implementing various strategies, such as strategic alliances, ai in fintech market forecast, partnerships, mergers and acquisitions, geographical expansion, and product/service launches, to enhance their presence in the industry.

Amazon.com Inc. - Delivers enterprise-grade AI platforms and financial analytics, enabling advanced fraud detection and data-driven applications for the fintech industry.

The industry research and growth report includes detailed analyses of the competitive landscape of the market and information about key companies, including:

  • Amazon.com Inc.
  • Bloomberg LP
  • C3.ai Inc.
  • DataRobot Inc.
  • Fair Isaac Corp.
  • Feedzai
  • Fidelity National Information
  • Fiserv Inc.
  • Forter Ltd.
  • Google LLC
  • H2O.ai Inc.
  • IBM Corp.
  • Intel Corp.
  • Mastercard Inc.
  • Microsoft Corp.
  • NVIDIA Corp.
  • Palantir Technologies Inc.
  • S and P Global Inc.
  • SAS Institute Inc.
  • Symphony Innovation LLC

Qualitative and quantitative analysis of companies has been conducted to help clients understand the wider business environment as well as the strengths and weaknesses of key industry players. Data is qualitatively analyzed to categorize companies as pure play, category-focused, industry-focused, and diversified; it is quantitatively analyzed to categorize companies as dominant, leading, strong, tentative, and weak.

Recent Development and News in Ai in fintech market

  • In May 2025, Banco Security announced it is exploring the use of generative AI to enhance its digital service offerings by providing product recommendations based on user history.
  • In February 2025, Stripe finalized its acquisition of Bridge Network to accelerate the development and integration of stablecoin-based payment services.
  • In January 2025, Salesforce announced a major expansion in Saudi Arabia, including a partnership with IBM to establish an AI Innovation Center of Excellence to upskill the local workforce.
  • In January 2025, Accel launched a new $650 million fund dedicated to early-stage companies in India and Southeast Asia, with a strong focus on artificial intelligence and financial technology.

Dive into Technavio’s robust research methodology, blending expert interviews, extensive data synthesis, and validated models for unparalleled AI In Fintech Market insights. See full methodology.

Market Scope
Page number 300
Base year 2025
Historic period 2020-2024
Forecast period 2026-2030
Growth momentum & CAGR Accelerate at a CAGR of 22.7%
Market growth 2026-2030 USD 35609.3 million
Market structure Fragmented
YoY growth 2025-2026(%) 21.8%
Key countries US, Canada, Mexico, Germany, UK, France, Italy, Spain, The Netherlands, China, Japan, India, South Korea, Australia, Indonesia, Brazil, Argentina, Chile, Saudi Arabia, UAE, South Africa, Israel and Turkey
Competitive landscape Leading Companies, Market Positioning of Companies, Competitive Strategies, and Industry Risks

Request Free Sample

Research Analyst Overview

  • The market's evolution demands a strategic focus on integrating a wide array of intelligent systems. Boardroom decisions now center on leveraging AI-driven risk management, which encompasses everything from machine learning for fraud detection and real-time transaction analysis to sophisticated AI for algorithmic trading.
  • The adoption of predictive analytics for credit scoring, enhanced by alternative data credit scoring and AI-powered underwriting models, is critical for competitive lending. Operationally, robotic process automation in banking and AI-powered process orchestration deliver efficiency, while generative AI in financial services and natural language processing in finance are reshaping customer interaction through cognitive banking assistants.
  • For compliance, AI-based regulatory technology (RegTech) and automated compliance monitoring are non-negotiable. Firms are also deploying customer behavioral analytics and hyper-personalization engines, supported by computer vision for document verification and behavioral biometrics authentication for secure onboarding.
  • This technological push necessitates robust security, including networked security architectures, model poisoning attack defense, prompt injection security, and adversarial evasion techniques overseen by autonomous security agents. Central to this is a commitment to explainable AI (XAI) in finance and AI governance platforms, which ensure transparency in systems like AI for claims processing automation and AI-driven market forecasting tools.
  • This comprehensive approach, combining AI-powered business analytics, AI-powered liquidity management, AI-driven wealth management, and intelligent automation in finance, has shown the ability to reduce false positives in fraud alerts by over 30%, solidifying its strategic importance. The use of deep learning for algorithmic trading and AI-based biometric authentication further underscores the technological depth required.

What are the Key Data Covered in this AI In Fintech Market Research and Growth Report?

  • What is the expected growth of the AI In Fintech Market between 2026 and 2030?

    • USD 35.61 billion, at a CAGR of 22.7%

  • What segmentation does the market report cover?

    • The report is segmented by Component (Solutions, and Services), Deployment (On-premises, and Cloud-based), Application (Business analytics and reporting, Fraud detection, Virtual assistant, Customer behavioral analytics, and Quantitative and asset management) and Geography (North America, Europe, APAC, South America, Middle East and Africa)

  • Which regions are analyzed in the report?

    • North America, Europe, APAC, South America and Middle East and Africa

  • What are the key growth drivers and market challenges?

    • Exponential growth in digital transaction volumes and regulatory compliance complexity, Escalating regulatory fragmentation and complexity of jurisdictional compliance

  • Who are the major players in the AI In Fintech Market?

    • Amazon.com Inc., Bloomberg LP, C3.ai Inc., DataRobot Inc., Fair Isaac Corp., Feedzai, Fidelity National Information, Fiserv Inc., Forter Ltd., Google LLC, H2O.ai Inc., IBM Corp., Intel Corp., Mastercard Inc., Microsoft Corp., NVIDIA Corp., Palantir Technologies Inc., S and P Global Inc., SAS Institute Inc. and Symphony Innovation LLC

Market Research Insights

  • Market dynamics are increasingly shaped by the deployment of intelligent technologies to achieve measurable business outcomes. The integration of AI for real-time settlement and the adoption of cloud-based AI fintech platforms are enabling institutions to accelerate transaction processing by over 60%. Concurrently, AI-powered customer engagement strategies are leading to a 25% improvement in customer retention rates.
  • This focus on technology is not limited to efficiency gains; it is also a key enabler of AI for financial inclusion, as advanced analytics can assess creditworthiness for previously underserved populations. The strategic adoption of these technologies is proving essential for maintaining a competitive edge, driving both top-line growth and bottom-line efficiencies across the financial landscape.

We can help! Our analysts can customize this ai in fintech market research report to meet your requirements.

Get in touch

1. Executive Summary

1.1 Market overview

Executive Summary - Chart on Market Overview
Executive Summary - Data Table on Market Overview
Executive Summary - Chart on Global Market Characteristics
Executive Summary - Chart on Market by Geography
Executive Summary - Chart on Market Segmentation by Component
Executive Summary - Chart on Market Segmentation by Deployment
Executive Summary - Chart on Market Segmentation by Application
Executive Summary - Chart on Incremental Growth
Executive Summary - Data Table on Incremental Growth
Executive Summary - Chart on Company Market Positioning

2. Technavio Analysis

2.1 Analysis of price sensitivity, lifecycle, customer purchase basket, adoption rates, and purchase criteria

2.2 Criticality of inputs and Factors of differentiation

Chart on Overview on criticality of inputs and factors of differentiation

2.3 Factors of disruption

Chart on Overview on factors of disruption

2.4 Impact of drivers and challenges

Chart on Impact of drivers and challenges in 2025 and 2030

3. Market Landscape

3.1 Market ecosystem

Chart on Parent Market
Data Table on - Parent Market

3.2 Market characteristics

Chart on Market characteristics analysis

3.3 Value chain analysis

Chart on Value chain analysis

4. Market Sizing

4.1 Market definition

Data Table on Offerings of companies included in the market definition

4.2 Market segment analysis

Market segments

4.3 Market size 2025

4.4 Market outlook: Forecast for 2025-2030

Chart on Global - Market size and forecast 2025-2030 ($ million)
Data Table on Global - Market size and forecast 2025-2030 ($ million)
Chart on Global Market: Year-over-year growth 2025-2030 (%)
Data Table on Global Market: Year-over-year growth 2025-2030 (%)

5. Historic Market Size

5.1 Global AI In Fintech Market 2020 - 2024

Historic Market Size - Data Table on Global AI In Fintech Market 2020 - 2024 ($ million)

5.2 Component segment analysis 2020 - 2024

Historic Market Size - Component Segment 2020 - 2024 ($ million)

5.3 Deployment segment analysis 2020 - 2024

Historic Market Size - Deployment Segment 2020 - 2024 ($ million)

5.4 Application segment analysis 2020 - 2024

Historic Market Size - Application Segment 2020 - 2024 ($ million)

5.5 Geography segment analysis 2020 - 2024

Historic Market Size - Geography Segment 2020 - 2024 ($ million)

5.6 Country segment analysis 2020 - 2024

Historic Market Size - Country Segment 2020 - 2024 ($ million)

6. Qualitative Analysis

6.1 Impact of geopolitical conflicts on global AI in fintech market

7. Five Forces Analysis

7.1 Five forces summary

Five forces analysis - Comparison between 2025 and 2030

7.2 Bargaining power of buyers

Bargaining power of buyers - Impact of key factors 2025 and 2030

7.3 Bargaining power of suppliers

Bargaining power of suppliers - Impact of key factors in 2025 and 2030

7.4 Threat of new entrants

Threat of new entrants - Impact of key factors in 2025 and 2030

7.5 Threat of substitutes

Threat of substitutes - Impact of key factors in 2025 and 2030

7.6 Threat of rivalry

Threat of rivalry - Impact of key factors in 2025 and 2030

7.7 Market condition

Chart on Market condition - Five forces 2025 and 2030

8. Market Segmentation by Component

8.1 Market segments

Chart on Component - Market share 2025-2030 (%)
Data Table on Component - Market share 2025-2030 (%)

8.2 Comparison by Component

Chart on Comparison by Component
Data Table on Comparison by Component

8.3 Solutions - Market size and forecast 2025-2030

Chart on Solutions - Market size and forecast 2025-2030 ($ million)
Data Table on Solutions - Market size and forecast 2025-2030 ($ million)
Chart on Solutions - Year-over-year growth 2025-2030 (%)
Data Table on Solutions - Year-over-year growth 2025-2030 (%)

8.4 Services - Market size and forecast 2025-2030

Chart on Services - Market size and forecast 2025-2030 ($ million)
Data Table on Services - Market size and forecast 2025-2030 ($ million)
Chart on Services - Year-over-year growth 2025-2030 (%)
Data Table on Services - Year-over-year growth 2025-2030 (%)

8.5 Market opportunity by Component

Market opportunity by Component ($ million)
Data Table on Market opportunity by Component ($ million)

9. Market Segmentation by Deployment

9.1 Market segments

Chart on Deployment - Market share 2025-2030 (%)
Data Table on Deployment - Market share 2025-2030 (%)

9.2 Comparison by Deployment

Chart on Comparison by Deployment
Data Table on Comparison by Deployment

9.3 On-premises - Market size and forecast 2025-2030

Chart on On-premises - Market size and forecast 2025-2030 ($ million)
Data Table on On-premises - Market size and forecast 2025-2030 ($ million)
Chart on On-premises - Year-over-year growth 2025-2030 (%)
Data Table on On-premises - Year-over-year growth 2025-2030 (%)

9.4 Cloud-based - Market size and forecast 2025-2030

Chart on Cloud-based - Market size and forecast 2025-2030 ($ million)
Data Table on Cloud-based - Market size and forecast 2025-2030 ($ million)
Chart on Cloud-based - Year-over-year growth 2025-2030 (%)
Data Table on Cloud-based - Year-over-year growth 2025-2030 (%)

9.5 Market opportunity by Deployment

Market opportunity by Deployment ($ million)
Data Table on Market opportunity by Deployment ($ million)

10. Market Segmentation by Application

10.1 Market segments

Chart on Application - Market share 2025-2030 (%)
Data Table on Application - Market share 2025-2030 (%)

10.2 Comparison by Application

Chart on Comparison by Application
Data Table on Comparison by Application

10.3 Business analytics and reporting - Market size and forecast 2025-2030

Chart on Business analytics and reporting - Market size and forecast 2025-2030 ($ million)
Data Table on Business analytics and reporting - Market size and forecast 2025-2030 ($ million)
Chart on Business analytics and reporting - Year-over-year growth 2025-2030 (%)
Data Table on Business analytics and reporting - Year-over-year growth 2025-2030 (%)

10.4 Fraud detection - Market size and forecast 2025-2030

Chart on Fraud detection - Market size and forecast 2025-2030 ($ million)
Data Table on Fraud detection - Market size and forecast 2025-2030 ($ million)
Chart on Fraud detection - Year-over-year growth 2025-2030 (%)
Data Table on Fraud detection - Year-over-year growth 2025-2030 (%)

10.5 Virtual assistant - Market size and forecast 2025-2030

Chart on Virtual assistant - Market size and forecast 2025-2030 ($ million)
Data Table on Virtual assistant - Market size and forecast 2025-2030 ($ million)
Chart on Virtual assistant - Year-over-year growth 2025-2030 (%)
Data Table on Virtual assistant - Year-over-year growth 2025-2030 (%)

10.6 Customer behavioral analytics - Market size and forecast 2025-2030

Chart on Customer behavioral analytics - Market size and forecast 2025-2030 ($ million)
Data Table on Customer behavioral analytics - Market size and forecast 2025-2030 ($ million)
Chart on Customer behavioral analytics - Year-over-year growth 2025-2030 (%)
Data Table on Customer behavioral analytics - Year-over-year growth 2025-2030 (%)

10.7 Quantitative and asset management - Market size and forecast 2025-2030

Chart on Quantitative and asset management - Market size and forecast 2025-2030 ($ million)
Data Table on Quantitative and asset management - Market size and forecast 2025-2030 ($ million)
Chart on Quantitative and asset management - Year-over-year growth 2025-2030 (%)
Data Table on Quantitative and asset management - Year-over-year growth 2025-2030 (%)

10.8 Market opportunity by Application

Market opportunity by Application ($ million)
Data Table on Market opportunity by Application ($ million)

11. Customer Landscape

11.1 Customer landscape overview

Analysis of price sensitivity, lifecycle, customer purchase basket, adoption rates, and purchase criteria

12. Geographic Landscape

12.1 Geographic segmentation

Chart on Market share by geography 2025-2030 (%)
Data Table on Market share by geography 2025-2030 (%)

12.2 Geographic comparison

Chart on Geographic comparison
Data Table on Geographic comparison

12.3 North America - Market size and forecast 2025-2030

Chart on North America - Market size and forecast 2025-2030 ($ million)
Data Table on North America - Market size and forecast 2025-2030 ($ million)
Chart on North America - Year-over-year growth 2025-2030 (%)
Data Table on North America - Year-over-year growth 2025-2030 (%)
Chart on Regional Comparison - North America
Data Table on Regional Comparison - North America

12.3.1 US - Market size and forecast 2025-2030

Chart on US - Market size and forecast 2025-2030 ($ million)
Data Table on US - Market size and forecast 2025-2030 ($ million)
Chart on US - Year-over-year growth 2025-2030 (%)
Data Table on US - Year-over-year growth 2025-2030 (%)

12.3.2 Canada - Market size and forecast 2025-2030

Chart on Canada - Market size and forecast 2025-2030 ($ million)
Data Table on Canada - Market size and forecast 2025-2030 ($ million)
Chart on Canada - Year-over-year growth 2025-2030 (%)
Data Table on Canada - Year-over-year growth 2025-2030 (%)

12.3.3 Mexico - Market size and forecast 2025-2030

Chart on Mexico - Market size and forecast 2025-2030 ($ million)
Data Table on Mexico - Market size and forecast 2025-2030 ($ million)
Chart on Mexico - Year-over-year growth 2025-2030 (%)
Data Table on Mexico - Year-over-year growth 2025-2030 (%)

12.4 Europe - Market size and forecast 2025-2030

Chart on Europe - Market size and forecast 2025-2030 ($ million)
Data Table on Europe - Market size and forecast 2025-2030 ($ million)
Chart on Europe - Year-over-year growth 2025-2030 (%)
Data Table on Europe - Year-over-year growth 2025-2030 (%)
Chart on Regional Comparison - Europe
Data Table on Regional Comparison - Europe

12.4.1 Germany - Market size and forecast 2025-2030

Chart on Germany - Market size and forecast 2025-2030 ($ million)
Data Table on Germany - Market size and forecast 2025-2030 ($ million)
Chart on Germany - Year-over-year growth 2025-2030 (%)
Data Table on Germany - Year-over-year growth 2025-2030 (%)

12.4.2 UK - Market size and forecast 2025-2030

Chart on UK - Market size and forecast 2025-2030 ($ million)
Data Table on UK - Market size and forecast 2025-2030 ($ million)
Chart on UK - Year-over-year growth 2025-2030 (%)
Data Table on UK - Year-over-year growth 2025-2030 (%)

12.4.3 France - Market size and forecast 2025-2030

Chart on France - Market size and forecast 2025-2030 ($ million)
Data Table on France - Market size and forecast 2025-2030 ($ million)
Chart on France - Year-over-year growth 2025-2030 (%)
Data Table on France - Year-over-year growth 2025-2030 (%)

12.4.4 Italy - Market size and forecast 2025-2030

Chart on Italy - Market size and forecast 2025-2030 ($ million)
Data Table on Italy - Market size and forecast 2025-2030 ($ million)
Chart on Italy - Year-over-year growth 2025-2030 (%)
Data Table on Italy - Year-over-year growth 2025-2030 (%)

12.4.5 Spain - Market size and forecast 2025-2030

Chart on Spain - Market size and forecast 2025-2030 ($ million)
Data Table on Spain - Market size and forecast 2025-2030 ($ million)
Chart on Spain - Year-over-year growth 2025-2030 (%)
Data Table on Spain - Year-over-year growth 2025-2030 (%)

12.4.6 The Netherlands - Market size and forecast 2025-2030

Chart on The Netherlands - Market size and forecast 2025-2030 ($ million)
Data Table on The Netherlands - Market size and forecast 2025-2030 ($ million)
Chart on The Netherlands - Year-over-year growth 2025-2030 (%)
Data Table on The Netherlands - Year-over-year growth 2025-2030 (%)

12.5 APAC - Market size and forecast 2025-2030

Chart on APAC - Market size and forecast 2025-2030 ($ million)
Data Table on APAC - Market size and forecast 2025-2030 ($ million)
Chart on APAC - Year-over-year growth 2025-2030 (%)
Data Table on APAC - Year-over-year growth 2025-2030 (%)
Chart on Regional Comparison - APAC
Data Table on Regional Comparison - APAC

12.5.1 China - Market size and forecast 2025-2030

Chart on China - Market size and forecast 2025-2030 ($ million)
Data Table on China - Market size and forecast 2025-2030 ($ million)
Chart on China - Year-over-year growth 2025-2030 (%)
Data Table on China - Year-over-year growth 2025-2030 (%)

12.5.2 Japan - Market size and forecast 2025-2030

Chart on Japan - Market size and forecast 2025-2030 ($ million)
Data Table on Japan - Market size and forecast 2025-2030 ($ million)
Chart on Japan - Year-over-year growth 2025-2030 (%)
Data Table on Japan - Year-over-year growth 2025-2030 (%)

12.5.3 India - Market size and forecast 2025-2030

Chart on India - Market size and forecast 2025-2030 ($ million)
Data Table on India - Market size and forecast 2025-2030 ($ million)
Chart on India - Year-over-year growth 2025-2030 (%)
Data Table on India - Year-over-year growth 2025-2030 (%)

12.5.4 South Korea - Market size and forecast 2025-2030

Chart on South Korea - Market size and forecast 2025-2030 ($ million)
Data Table on South Korea - Market size and forecast 2025-2030 ($ million)
Chart on South Korea - Year-over-year growth 2025-2030 (%)
Data Table on South Korea - Year-over-year growth 2025-2030 (%)

12.5.5 Australia - Market size and forecast 2025-2030

Chart on Australia - Market size and forecast 2025-2030 ($ million)
Data Table on Australia - Market size and forecast 2025-2030 ($ million)
Chart on Australia - Year-over-year growth 2025-2030 (%)
Data Table on Australia - Year-over-year growth 2025-2030 (%)

12.5.6 Indonesia - Market size and forecast 2025-2030

Chart on Indonesia - Market size and forecast 2025-2030 ($ million)
Data Table on Indonesia - Market size and forecast 2025-2030 ($ million)
Chart on Indonesia - Year-over-year growth 2025-2030 (%)
Data Table on Indonesia - Year-over-year growth 2025-2030 (%)

12.6 South America - Market size and forecast 2025-2030

Chart on South America - Market size and forecast 2025-2030 ($ million)
Data Table on South America - Market size and forecast 2025-2030 ($ million)
Chart on South America - Year-over-year growth 2025-2030 (%)
Data Table on South America - Year-over-year growth 2025-2030 (%)
Chart on Regional Comparison - South America
Data Table on Regional Comparison - South America

12.6.1 Brazil - Market size and forecast 2025-2030

Chart on Brazil - Market size and forecast 2025-2030 ($ million)
Data Table on Brazil - Market size and forecast 2025-2030 ($ million)
Chart on Brazil - Year-over-year growth 2025-2030 (%)
Data Table on Brazil - Year-over-year growth 2025-2030 (%)

12.6.2 Argentina - Market size and forecast 2025-2030

Chart on Argentina - Market size and forecast 2025-2030 ($ million)
Data Table on Argentina - Market size and forecast 2025-2030 ($ million)
Chart on Argentina - Year-over-year growth 2025-2030 (%)
Data Table on Argentina - Year-over-year growth 2025-2030 (%)

12.6.3 Chile - Market size and forecast 2025-2030

Chart on Chile - Market size and forecast 2025-2030 ($ million)
Data Table on Chile - Market size and forecast 2025-2030 ($ million)
Chart on Chile - Year-over-year growth 2025-2030 (%)
Data Table on Chile - Year-over-year growth 2025-2030 (%)

12.7 Middle East and Africa - Market size and forecast 2025-2030

Chart on Middle East and Africa - Market size and forecast 2025-2030 ($ million)
Data Table on Middle East and Africa - Market size and forecast 2025-2030 ($ million)
Chart on Middle East and Africa - Year-over-year growth 2025-2030 (%)
Data Table on Middle East and Africa - Year-over-year growth 2025-2030 (%)
Chart on Regional Comparison - Middle East and Africa
Data Table on Regional Comparison - Middle East and Africa

12.7.1 Saudi Arabia - Market size and forecast 2025-2030

Chart on Saudi Arabia - Market size and forecast 2025-2030 ($ million)
Data Table on Saudi Arabia - Market size and forecast 2025-2030 ($ million)
Chart on Saudi Arabia - Year-over-year growth 2025-2030 (%)
Data Table on Saudi Arabia - Year-over-year growth 2025-2030 (%)

12.7.2 UAE - Market size and forecast 2025-2030

Chart on UAE - Market size and forecast 2025-2030 ($ million)
Data Table on UAE - Market size and forecast 2025-2030 ($ million)
Chart on UAE - Year-over-year growth 2025-2030 (%)
Data Table on UAE - Year-over-year growth 2025-2030 (%)

12.7.3 South Africa - Market size and forecast 2025-2030

Chart on South Africa - Market size and forecast 2025-2030 ($ million)
Data Table on South Africa - Market size and forecast 2025-2030 ($ million)
Chart on South Africa - Year-over-year growth 2025-2030 (%)
Data Table on South Africa - Year-over-year growth 2025-2030 (%)

12.7.4 Israel - Market size and forecast 2025-2030

Chart on Israel - Market size and forecast 2025-2030 ($ million)
Data Table on Israel - Market size and forecast 2025-2030 ($ million)
Chart on Israel - Year-over-year growth 2025-2030 (%)
Data Table on Israel - Year-over-year growth 2025-2030 (%)

12.7.5 Turkey - Market size and forecast 2025-2030

Chart on Turkey - Market size and forecast 2025-2030 ($ million)
Data Table on Turkey - Market size and forecast 2025-2030 ($ million)
Chart on Turkey - Year-over-year growth 2025-2030 (%)
Data Table on Turkey - Year-over-year growth 2025-2030 (%)

12.8 Market opportunity by geography

Market opportunity by geography ($ million)
Data Tables on Market opportunity by geography ($ million)

13. Drivers, Challenges, and Opportunity

13.1 Market drivers

Exponential growth in digital transaction volumes and regulatory compliance complexity
Urgent demand for operational efficiency and cost optimization in high-interest environments
Advancements in cloud computing infrastructure and proliferation of big data

13.2 Market challenges

Escalating regulatory fragmentation and complexity of jurisdictional compliance
Persistent algorithmic bias and crisis of explainability in automated decisioning
Heightened vulnerability to advanced cyber threats and model integrity risks

13.3 Impact of drivers and challenges

Impact of drivers and challenges in 2025 and 2030

13.4 Market opportunities

Evolution of hyper-personalization and cognitive banking assistants
Next-generation fraud prevention and networked security architectures
Integration of AI with embedded finance and real-time settlement

14. Competitive Landscape

14.1 Overview

14.2

Overview on criticality of inputs and factors of differentiation

14.3 Landscape disruption

Overview on factors of disruption

14.4 Industry risks

Impact of key risks on business

15. Competitive Analysis

15.1 Companies profiled

Companies covered

15.2 Company ranking index

15.3 Market positioning of companies

Matrix on companies position and classification

15.4 Amazon.com Inc.

Amazon.com Inc. - Overview
Amazon.com Inc. - Business segments
Amazon.com Inc. - Key news
Amazon.com Inc. - Key offerings
Amazon.com Inc. - Segment focus
SWOT

15.5 Bloomberg LP

Bloomberg LP - Overview
Bloomberg LP - Product / Service
Bloomberg LP - Key offerings
SWOT

15.6 C3.ai Inc.

C3.ai Inc. - Overview
C3.ai Inc. - Product / Service
C3.ai Inc. - Key news
C3.ai Inc. - Key offerings
SWOT

15.7 Fair Isaac Corp.

Fair Isaac Corp. - Overview
Fair Isaac Corp. - Business segments
Fair Isaac Corp. - Key news
Fair Isaac Corp. - Key offerings
Fair Isaac Corp. - Segment focus
SWOT

15.8 Fidelity National Information

Fidelity National Information - Overview
Fidelity National Information - Business segments
Fidelity National Information - Key offerings
Fidelity National Information - Segment focus
SWOT

15.9 Fiserv Inc.

Fiserv Inc. - Overview
Fiserv Inc. - Business segments
Fiserv Inc. - Key news
Fiserv Inc. - Key offerings
Fiserv Inc. - Segment focus
SWOT

15.10 Google LLC

Google LLC - Overview
Google LLC - Product / Service
Google LLC - Key offerings
SWOT

15.11 IBM Corp.

IBM Corp. - Overview
IBM Corp. - Business segments
IBM Corp. - Key news
IBM Corp. - Key offerings
IBM Corp. - Segment focus
SWOT

15.12 Intel Corp.

Intel Corp. - Overview
Intel Corp. - Business segments
Intel Corp. - Key news
Intel Corp. - Key offerings
Intel Corp. - Segment focus
SWOT

15.13 Mastercard Inc.

Mastercard Inc. - Overview
Mastercard Inc. - Product / Service
Mastercard Inc. - Key offerings
SWOT

15.14 Microsoft Corp.

Microsoft Corp. - Overview
Microsoft Corp. - Business segments
Microsoft Corp. - Key news
Microsoft Corp. - Key offerings
Microsoft Corp. - Segment focus
SWOT

15.15 NVIDIA Corp.

NVIDIA Corp. - Overview
NVIDIA Corp. - Business segments
NVIDIA Corp. - Key news
NVIDIA Corp. - Key offerings
NVIDIA Corp. - Segment focus
SWOT

15.16 S and P Global Inc.

S and P Global Inc. - Overview
S and P Global Inc. - Business segments
S and P Global Inc. - Key offerings
S and P Global Inc. - Segment focus
SWOT

15.17 SAS Institute Inc.

SAS Institute Inc. - Overview
SAS Institute Inc. - Product / Service
SAS Institute Inc. - Key offerings
SWOT

15.18 Symphony Innovation LLC

Symphony Innovation LLC - Overview
Symphony Innovation LLC - Product / Service
Symphony Innovation LLC - Key offerings
SWOT

16. Appendix

16.1 Scope of the report

Market definition
Objectives
Notes and caveats

16.2 Inclusions and exclusions checklist

Inclusions checklist
Exclusions checklist

16.3 Currency conversion rates for US$

16.4 Research methodology

16.5 Data procurement

Information sources

16.6 Data validation

16.7 Validation techniques employed for market sizing

16.8 Data synthesis

16.9 360 degree market analysis

16.10 List of abbreviations

Research Methodology

Technavio presents a detailed picture of the market by way of study, synthesis, and summation of data from multiple sources. The analysts have presented the various facets of the market with a particular focus on identifying the key industry influencers. The data thus presented is comprehensive, reliable, and the result of extensive research, both primary and secondary.

INFORMATION SOURCES

Primary sources

  • Manufacturers and suppliers
  • Channel partners
  • Industry experts
  • Strategic decision makers

Secondary sources

  • Industry journals and periodicals
  • Government data
  • Financial reports of key industry players
  • Historical data
  • Press releases

DATA ANALYSIS

Data Synthesis

  • Collation of data
  • Estimation of key figures
  • Analysis of derived insights

Data Validation

  • Triangulation with data models
  • Reference against proprietary databases
  • Corroboration with industry experts

REPORT WRITING

Qualitative

  • Market drivers
  • Market challenges
  • Market trends
  • Five forces analysis

Quantitative

  • Market size and forecast
  • Market segmentation
  • Geographical insights
  • Competitive landscape

Interested in this report?

Get your sample now to see our research methodology and insights!

Download Now

Frequently Asked Questions

AI In Fintech market growth will increase by USD 35609.3 million during 2026-2030.

The AI In Fintech market is expected to grow at a CAGR of 22.7% during 2026-2030.

AI In Fintech market is segmented by Component (Solutions, Services) Deployment (On-premises, Cloud-based) Application (Business analytics and reporting, Fraud detection, Virtual assistant, Customer behavioral analytics, Quantitative and asset management)

Amazon.com Inc., Bloomberg LP, C3.ai Inc., DataRobot Inc., Fair Isaac Corp., Feedzai, Fidelity National Information, Fiserv Inc., Forter Ltd., Google LLC, H2O.ai Inc., IBM Corp., Intel Corp., Mastercard Inc., Microsoft Corp., NVIDIA Corp., Palantir Technologies Inc., S and P Global Inc., SAS Institute Inc., Symphony Innovation LLC are a few of the key vendors in the AI In Fintech market.

North America will register the highest growth rate of 32.4% among the other regions. Therefore, the AI In Fintech market in North America is expected to garner significant business opportunities for the vendors during the forecast period.

US, Canada, Mexico, Germany, UK, France, Italy, Spain, The Netherlands, China, Japan, India, South Korea, Australia, Indonesia, Brazil, Argentina, Chile, Saudi Arabia, UAE, South Africa, Israel, Turkey

  • Exponential growth in digital transaction volumes and regulatory compliance complexity is the driving factor this market.

The AI In Fintech market vendors should focus on grabbing business opportunities from the Component segment as it accounted for the largest market share in the base year.
RIA - Research AI Assistant
Ask RIA