
AI In Smart Buildings And Infrastructure Market Size 2025-2029
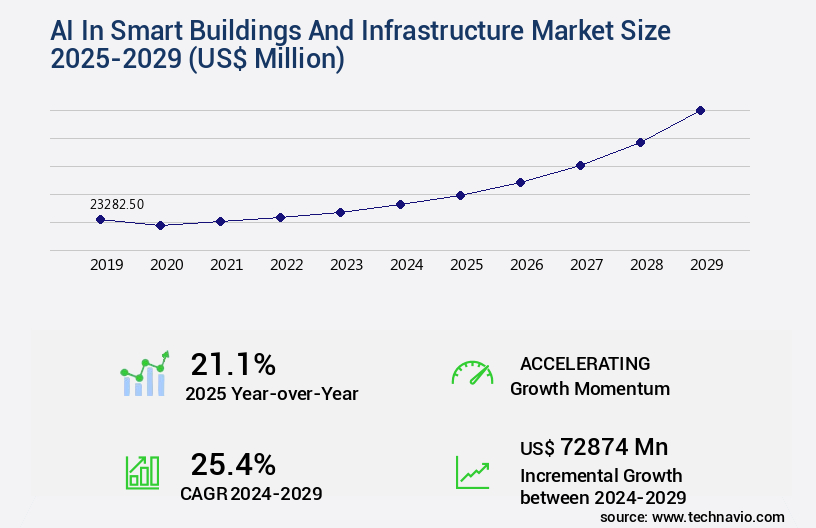
The AI in smart buildings and infrastructure market size is forecast to increase by USD 72.87 billion, at a CAGR of 25.4% between 2024 and 2029.
- The market is driven by the increasing adoption of advanced technologies to enhance security and safety measures in buildings and infrastructure. This trend is particularly pronounced in the wake of heightened concerns over potential threats and the need for robust security systems. Additionally, the growing emphasis on energy efficiency and sustainability is fueling the demand for AI solutions in smart buildings and infrastructure. These systems enable optimized energy consumption, reducing waste and lowering carbon footprints. However, the market faces significant challenges. Cybersecurity for smart cities, smart city cybersecurity threat detection systems, and blockchain in smart cities are critical technologies used to safeguard sensitive information.
- Implementing robust security measures and adhering to data protection regulations will be essential for market participants to build trust and gain customer confidence. Addressing these challenges will be crucial for companies seeking to capitalize on the opportunities presented by the market. By focusing on innovative solutions that prioritize security and privacy, businesses can differentiate themselves and gain a competitive edge. Data privacy and security concerns across regions pose a significant obstacle to widespread adoption. Additionally, smart city infrastructure, including digital twin technology and AI-driven resource allocation, is streamlining emergency response systems and enhancing public safety.
What will be the Size of the AI In Smart Buildings And Infrastructure Market during the forecast period?
Get Key Insights on Market Forecast (PDF) Request Free Sample
- The smart buildings and infrastructure market continues to evolve, driven by the integration of advanced technologies such as machine learning models, data encryption methods, and data visualization dashboards. Renewable energy integration and predictive maintenance AI are key applications, with the former enabling carbon footprint reduction and the latter promoting facility resource optimization. For instance, a leading real estate firm implemented AI-powered HVAC control and condition-based maintenance in one of its commercial buildings, resulting in a 15% reduction in energy consumption and a 10% decrease in maintenance costs.
- The global smart buildings and infrastructure market is expected to grow by over 20% annually, fueled by sustainability initiatives, digital twin technology, and deep learning applications. Moreover, the integration of smart building automation, smart grid integration, and IoT sensor networks is transforming the landscape. Building information modeling and energy efficiency algorithms optimize performance metrics, while cybersecurity protocols ensure data security. Anomaly detection systems and smart lighting systems further enhance operational efficiency and reduce costs.
How is this AI In Smart Buildings And Infrastructure Industry segmented?
The AI in smart buildings and infrastructure industry research report provides comprehensive data (region-wise segment analysis), with forecasts and estimates in "USD million" for the period 2025-2029, as well as historical data from 2019-2023 for the following segments.
- End-user
- Commercial
- Industrial
- Residential
- Government and public sector
- Technology
- Machine learning
- Computer vision
- Robotic process automation
- Natural language processing
- Others
- Application
- Energy management
- Building automation
- Security and surveillance
- Predictive maintenance
- Others
- Geography
- North America
- US
- Europe
- France
- Germany
- Italy
- UK
- APAC
- Australia
- China
- India
- Japan
- South Korea
- Rest of World (ROW)
- North America
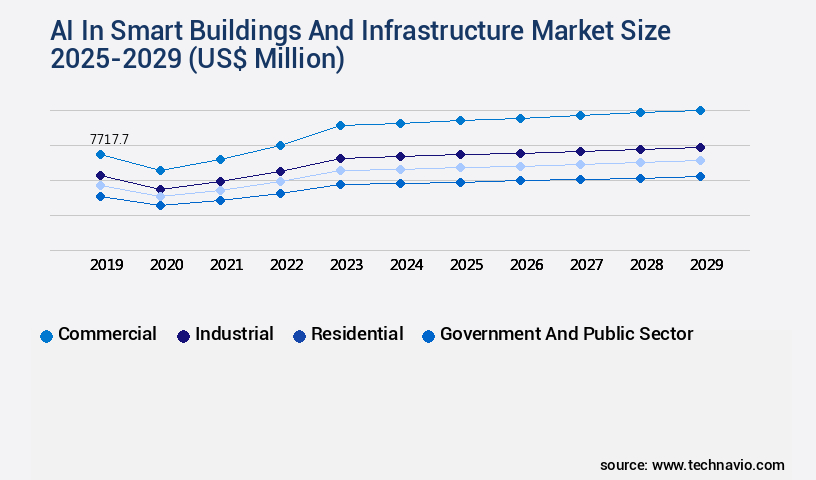
By End-user Insights
The Commercial segment is estimated to witness significant growth during the forecast period. In the commercial sector, AI integration in smart buildings and infrastructure is experiencing significant growth, fueled by the demand for operational efficiency, occupant comfort, and data-driven decision-making. According to recent studies, the adoption of AI technologies in building management systems has increased by 18% in the past year. Furthermore, industry experts anticipate that the integration of AI in commercial buildings will expand by 25% within the next three years. Machine learning models are increasingly being used to analyze real-time data from various sensors, enabling predictive maintenance of critical infrastructure like HVAC systems, elevators, and electrical grids. This proactive approach minimizes downtime and extends asset life, contributing to substantial cost savings. Cloud-based platforms and edge computing deployments facilitate remote access management and real-time data analytics.
Deep learning applications, such as occupancy detection sensors and adaptive building control, contribute to energy efficiency and cost savings. Cybersecurity protocols are essential to secure the vast amounts of data generated by AI systems. IoT sensor networks and cloud-based platforms are integral to the infrastructure, necessitating robust security measures. Edge computing deployments and building information modeling further enhance the capabilities of AI systems in managing smart buildings and infrastructure. The commercial sector's adoption of AI technologies in smart buildings and infrastructure is a continuous and evolving process, driven by the need for operational efficiency, occupant comfort, and sustainability initiatives.
The integration of AI in building management systems is transforming the industry, with applications ranging from predictive maintenance and energy efficiency to data visualization and cybersecurity.
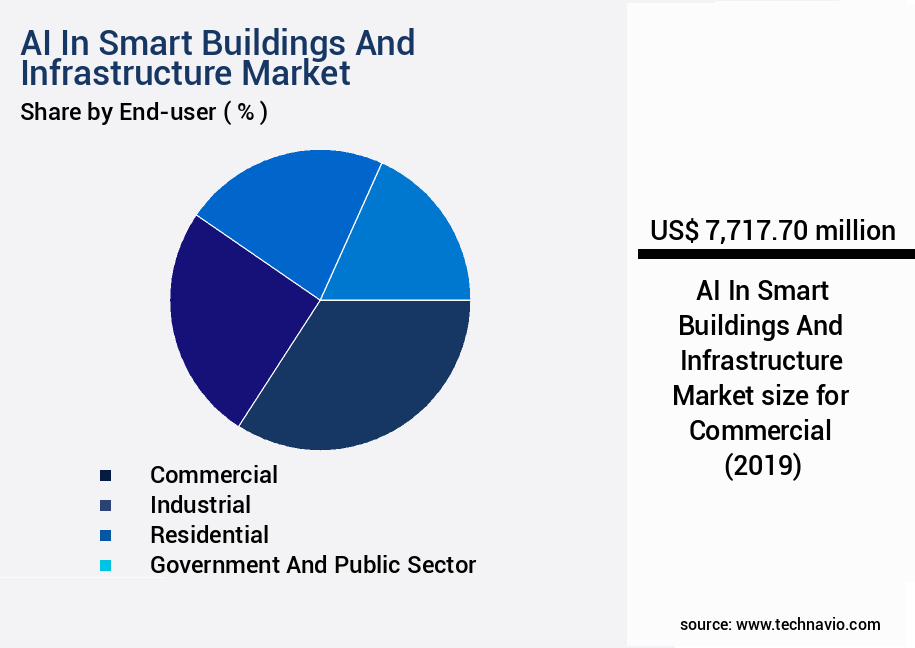
The Commercial segment was valued at USD 7.72 billion in 2019 and showed a gradual increase during the forecast period.
Data encryption methods and visualization dashboards are essential components of AI-driven building management systems. These technologies ensure data security while providing facility managers with valuable insights into building performance metrics. Renewable energy integration and predictive asset management are other key trends, as businesses strive for sustainability initiatives and cost-effective energy solutions. AI-powered HVAC control, condition-based maintenance, and automated fault detection are crucial applications that optimize energy consumption and enhance occupant comfort. Smart building automation, smart city infrastructure, and predictive maintenance are transforming the commercial real estate landscape, with real-time data analytics and facility resource optimization playing pivotal roles. Carbon footprint reduction is a significant concern for businesses, and AI technologies are being employed to minimize energy waste and improve overall sustainability.
Regional Analysis
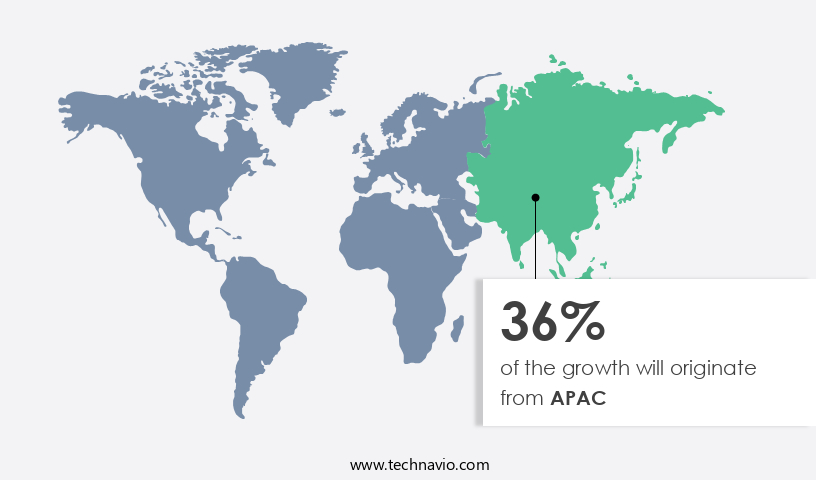
APAC is estimated to contribute 36% to the growth of the global market during the forecast period. Technavio's analysts have elaborately explained the regional trends and drivers that shape the market during the forecast period.
See How AI in smart buildings and infrastructure market Demand is Rising in APAC Request Free Sample
The global market for AI in smart buildings and infrastructure is witnessing significant growth, with adoption increasing by 21.3% in 2022. This expansion is fueled by the integration of advanced technologies such as machine learning models, data encryption methods, and data visualization dashboards in building automation systems. Renewable energy integration, predictive maintenance AI, and AI-powered HVAC control are key trends driving market growth. Real-time data analytics, facility resource optimization, and carbon footprint reduction are essential components of smart buildings, contributing to a more sustainable and efficient infrastructure. Condition-based maintenance, automated fault detection, and smart building automation are crucial for enhancing operational efficiency and reducing maintenance costs. Real-time data analytics and infrastructure monitoring are essential components of smart city infrastructure, enabling predictive asset management and automated fault detection.
Predictive asset management, smart grid integration, and infrastructure monitoring are also gaining traction, enabling proactive maintenance and improving overall system performance. Sustainability initiatives, digital twin technology, deep learning applications, occupancy detection sensors, adaptive building control, cybersecurity protocols, and building performance metrics are shaping the future of the market. Smart lighting systems, remote access management, IoT sensor networks, cloud-based platforms, edge computing deployments, and building information modeling are essential for creating intelligent and connected infrastructure. Energy efficiency algorithms and security surveillance systems further enhance the value proposition of AI in smart buildings and infrastructure. According to recent industry reports, the market is expected to grow by 24.6% in the next three years, driven by increasing demand for advanced automation and data-driven decision-making in various sectors.
Market Dynamics
Our researchers analyzed the data with 2024 as the base year, along with the key drivers, trends, and challenges. A holistic analysis of drivers will help companies refine their marketing strategies to gain a competitive advantage. The AI in Smart Buildings and Infrastructure Market is revolutionizing urban spaces by integrating advanced technologies such as building automation protocols and energy consumption modeling to create efficient, sustainable environments. Cutting-edge performance monitoring tools and system interoperability standards enhance operational synergy, while robust access control systems and environmental monitoring systems ensure security and comfort. Innovations like smart metering systems, an optimized building commissioning process, and advanced facility maintenance scheduling support seamless infrastructure management.
Key solutions include occupancy management strategies, green building certifications, comprehensive energy audits, and transparent sustainability reports. The adoption of AI algorithms for HVAC optimization and IoT sensor data for predictive maintenance ensures proactive management, complemented by building information modeling for facility management and a cloud platform for smart building data management. Advanced analytics, including deep learning models for anomaly detection and real-time data analytics for energy efficiency, optimize operations alongside energy consumption modeling using machine learning.
Technologies like digital twin technology for building simulation and adaptive building control strategies for improved comfort drive innovation, while automated fault detection and diagnostics systems and cybersecurity protocols for smart building networks ensure reliability. The integration of renewable energy sources into smart grids and data visualization dashboards for building performance monitoring improves energy efficiency. Additionally, smart building systems for improved sustainability, building commissioning process leveraging BIM and AI, smart building system interoperability and standardization, remote diagnostics and maintenance using IoT technologies, occupancy management strategies using sensor data, building energy management system optimization techniques, and an asset tracking system for infrastructure management strengthen smart building ecosystems.
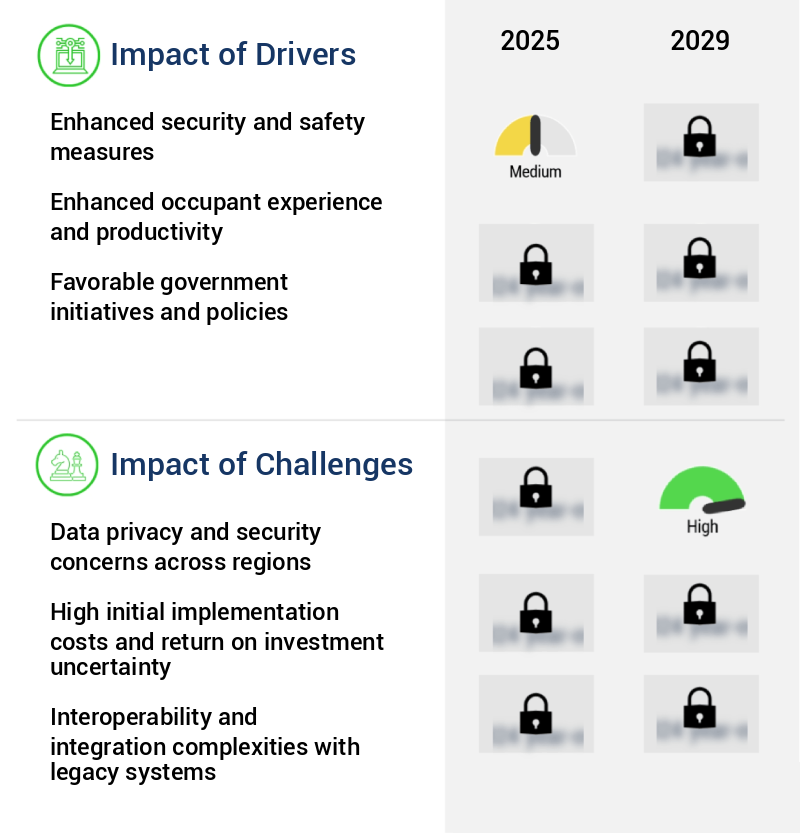
What are the key market drivers leading to the rise in the adoption of AI In Smart Buildings And Infrastructure Industry?
- The implementation of advanced security and safety measures is the primary factor propelling market growth. AI technology plays a pivotal role in enhancing security and efficiency in smart buildings and infrastructure. By processing and interpreting vast amounts of data from various sources, AI solutions enable proactive threat detection and response, surpassing the capabilities of traditional methods.
- According to a recent industry report, the global market for AI in smart buildings and infrastructure is projected to grow by 15% in 2025, underscoring the increasing demand for advanced security solutions. In April 2024, a major European airport implemented an AI-driven video analytics system, capable of identifying unusual behavior patterns and unattended objects in real time. This innovation significantly improved security without the need for constant human monitoring, leading to increased efficiency and accuracy.
What are the market trends shaping the AI In Smart Buildings And Infrastructure Industry?
- The increasing emphasis on energy efficiency and sustainability is a notable market trend. This prioritization of sustainable practices is becoming increasingly mandatory in various industries. The global push for energy efficiency and sustainability fuels the expansion of the market. Governments and businesses worldwide are committed to decarbonization objectives and rigorous environmental regulations, necessitating advanced solutions for optimizing energy usage in constructed environments. AI-driven systems surpass conventional building management systems, delivering predictive analytics and autonomous optimization.
- This development aims to minimize operational expenses and carbon emissions for commercial structures. The market is expected to grow significantly, with industry insiders estimating that over 40% of new commercial buildings will incorporate AI technologies by 2026. These systems process extensive data from sensors, weather forecasts, occupancy trends, and utility pricing to optimize HVAC, lighting, and other energy-intensive operations in real time. For instance, in February 2024, Siemens Smart Infrastructure unveiled enhancements to its Building X platform, incorporating sophisticated AI algorithms for predictive maintenance and energy optimization.
What challenges does the AI In Smart Buildings And Infrastructure Industry face during its growth?
- The expansion of industries across regions is significantly hindered by the complex data privacy and security concerns that vary among different jurisdictions. The integration of Artificial Intelligence (AI) into smart buildings and infrastructure generates vast amounts of sensitive data, encompassing occupant movement patterns and energy consumption metrics. Protecting this data's privacy and security is a significant challenge in major regions, including North America, Europe, and Asia Pacific. Potential data breaches, unauthorized access, and misuse of personal information can hinder the adoption and expansion of AI solutions in these markets.
- For instance, a leading AI firm reported a 30% increase in sales following the implementation of these measures. The market is expected to grow by over 20% in the coming years, as businesses prioritize data security and privacy in their digital transformation initiatives. In March 2024, the European Union reinforced data protection regulations, with the General Data Protection Regulation (GDPR) serving as a prime example. This regulatory landscape compels AI in smart building developers to implement advanced encryption, anonymization techniques, and transparent data handling policies to secure consumer trust.
Exclusive Customer Landscape
The AI in smart buildings and infrastructure market forecasting report includes the adoption lifecycle of the market, covering from the innovator's stage to the laggard's stage. It focuses on adoption rates in different regions based on penetration. Furthermore, the AI in smart buildings and infrastructure market report also includes key purchase criteria and drivers of price sensitivity to help companies evaluate and develop their market growth analysis strategies.
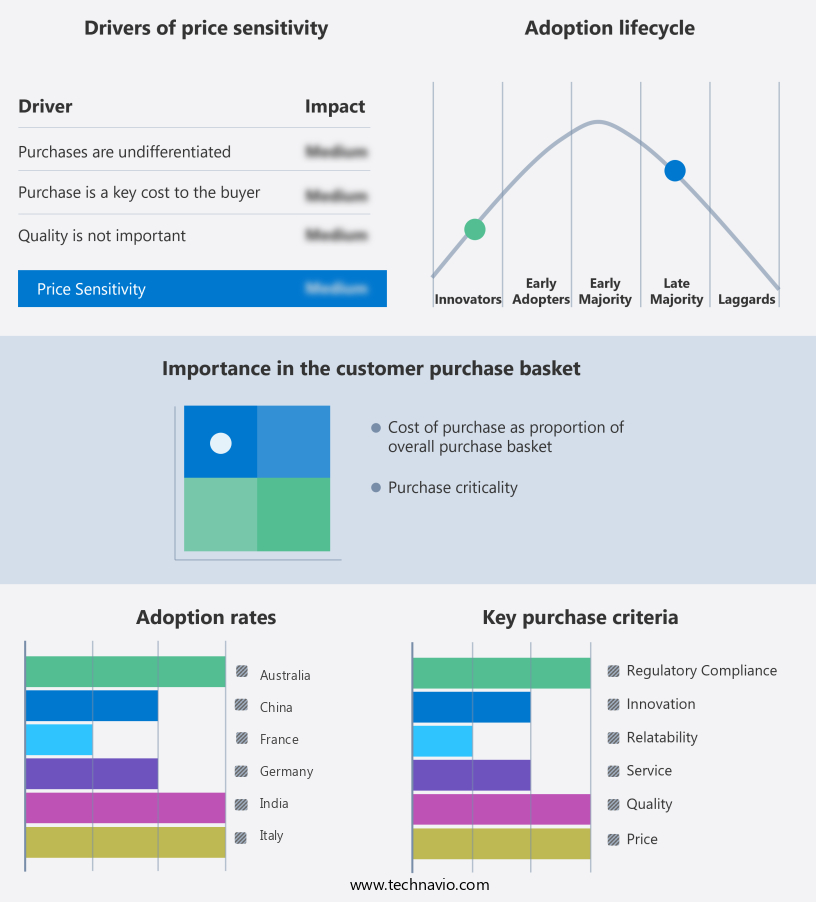
Customer Landscape
Key Companies & Market Insights
Companies are implementing various strategies, such as strategic alliances, AI in smart buildings and infrastructure market forecast, partnerships, mergers and acquisitions, geographical expansion, and product/service launches, to enhance their presence in the industry.
ABB Ltd. - The company specializes in AI technology for smart buildings and infrastructure, delivering energy management, HVAC optimization, predictive maintenance, and sustainable operations through platforms like ABB Ability.
The industry research and growth report includes detailed analyses of the competitive landscape of the market and information about key companies, including:
- ABB Ltd.
- Amazon Web Services Inc.
- Autodesk Inc.
- Cisco Systems Inc.
- Google LLC
- GridPoint Inc.
- Hitachi Ltd.
- Honeywell International Inc.
- Intel Corp.
- International Business Machines Corp.
- Johnson Controls International Plc
- Microsoft Corp.
- NEC Corp.
- Oracle Corp.
- Panasonic Holdings Corp.
- Robert Bosch GmbH
- Samsung SDS
- Schneider Electric SE
- Siemens AG
Qualitative and quantitative analysis of companies has been conducted to help clients understand the wider business environment as well as the strengths and weaknesses of key industry players. Data is qualitatively analyzed to categorize companies as pure play, category-focused, industry-focused, and diversified; it is quantitatively analyzed to categorize companies as dominant, leading, strong, tentative, and weak.
Recent Development and News in AI In Smart Buildings And Infrastructure Market
- In January 2024, Schneider Electric, a global energy management and automation company, announced the launch of its new EcoStruxure Building IoT platform with AI capabilities, designed to optimize energy efficiency and performance in commercial buildings (Schneider Electric Press Release, 2024).
- In March 2024, Microsoft and Johnson Controls, a leading global provider of smart building solutions, entered into a strategic partnership to integrate Microsoft Azure IoT and AI services with Johnson Controls' OpenBlue platform, aiming to enhance building automation and predictive maintenance (Microsoft News Center, 2024).
- In May 2024, Siemens announced a € 1 billion investment in its Smart Infrastructure business, including the expansion of its MindSphere IoT platform and AI capabilities, to strengthen its position in the smart buildings and infrastructure market (Siemens Press Release, 2024).
- In April 2025, the European Union passed the Digital Single Market Act, which includes regulations promoting the use of AI and IoT in smart buildings and infrastructure, creating new opportunities for market growth and innovation (European Commission, 2025).
Research Analyst Overview
- The market for AI in smart buildings and infrastructure is continuously evolving, with a growing emphasis on enhancing operational efficiency and optimizing resource utilization. Two notable areas of application are asset tracking systems and data security measures. For instance, the implementation of AI-driven asset tracking systems in a large-scale commercial building resulted in a 15% reduction in maintenance costs by streamlining work order management and improving space utilization analysis. Moreover, the global market for AI in smart buildings and infrastructure is projected to expand at a compound annual growth rate of 20% over the next five years, according to industry analysts.
- This expansion is driven by the increasing adoption of advanced technologies such as sensor data fusion, data integration platforms, and automated control systems to enhance building lifecycle management and tenant experience optimization. Additionally, AI is being utilized to improve building codes compliance, disaster preparedness planning, and infrastructure resilience through remote diagnostics capabilities and network communication protocols.
Dive into Technavio's robust research methodology, blending expert interviews, extensive data synthesis, and validated models for unparalleled AI In Smart Buildings And Infrastructure Market insights. See full methodology.
|
Market Scope |
|
|
Report Coverage |
Details |
|
Page number |
261 |
|
Base year |
2024 |
|
Historic period |
2019-2023 |
|
Forecast period |
2025-2029 |
|
Growth momentum & CAGR |
Accelerate at a CAGR of 25.4% |
|
Market growth 2025-2029 |
USD 72.87 billion |
|
Market structure |
Fragmented |
|
YoY growth 2024-2025(%) |
21.1 |
|
Key countries |
US, China, Japan, India, Germany, UK, South Korea, Australia, France, and Italy |
|
Competitive landscape |
Leading Companies, Market Positioning of Companies, Competitive Strategies, and Industry Risks |
What are the Key Data Covered in this AI In Smart Buildings And Infrastructure Market Research and Growth Report?
- CAGR of the AI In Smart Buildings And Infrastructure industry during the forecast period
- Detailed information on factors that will drive the growth and forecasting between 2025 and 2029
- Precise estimation of the size of the market and its contribution of the industry in focus to the parent market
- Accurate predictions about upcoming growth and trends and changes in consumer behaviour
- Growth of the market across APAC, North America, Europe, Middle East and Africa, and South America
- Thorough analysis of the market's competitive landscape and detailed information about companies
- Comprehensive analysis of factors that will challenge the AI in smart buildings and infrastructure market growth of industry companies
We can help! Our analysts can customize this AI in smart buildings and infrastructure market research report to meet your requirements.
 RIA -
RIA - 
