AI Workflow Orchestration Market Analysis, Size, and Forecast 2026-2030: North America (US, Canada, and Mexico), APAC (China, Japan, and India), Europe (Germany, UK, and France), South America (Brazil and Argentina), Middle East and Africa (Saudi Arabia, UAE, and South Africa), and Rest of World (ROW)

AI Workflow Orchestration Market Analysis, Size, and Forecast 2026-2030:
North America (US, Canada, and Mexico), APAC (China, Japan, and India), Europe (Germany, UK, and France), South America (Brazil and Argentina), Middle East and Africa (Saudi Arabia, UAE, and South Africa), and Rest of World (ROW)

Published: Apr 2026 300 Pages SKU: IRTNTR80709

Market Overview at a Glance

$20.75 B
Market Opportunity
35.3%
CAGR 2025 - 2030
32.6%
North America Growth
$2.50 B
Software segment 2024

AI Workflow Orchestration Market Size 2026-2030

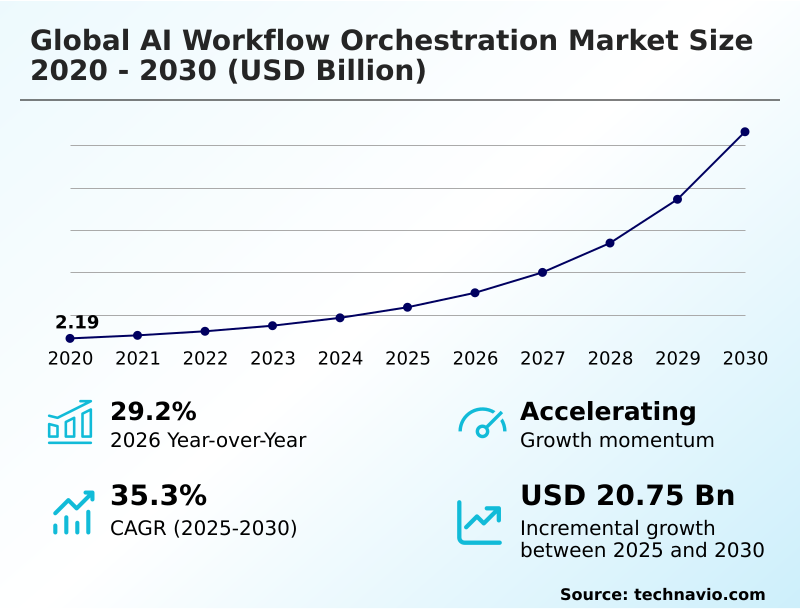
The ai workflow orchestration market size is valued to increase by USD 20.75 billion, at a CAGR of 35.3% from 2025 to 2030. Rise of agentic AI and multi-agent orchestration will drive the ai workflow orchestration market.

Major Market Trends & Insights

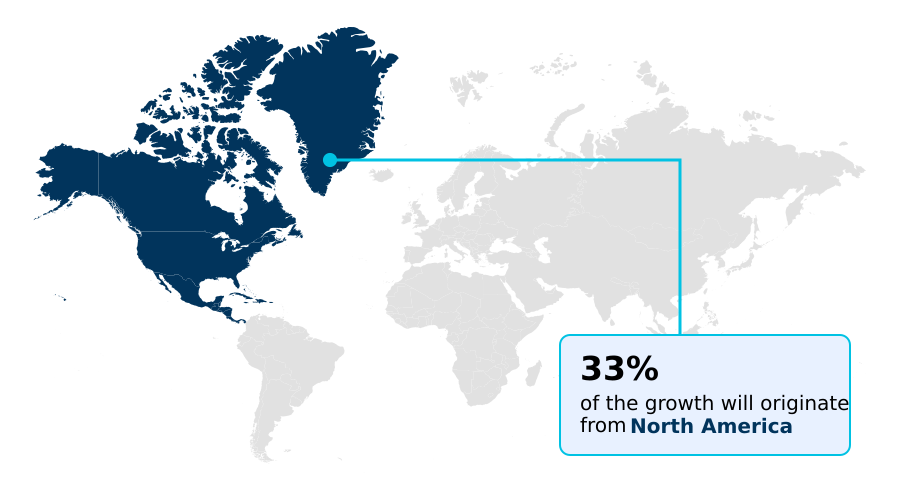
  • North America dominated the market and accounted for a 32.6% growth during the forecast period.
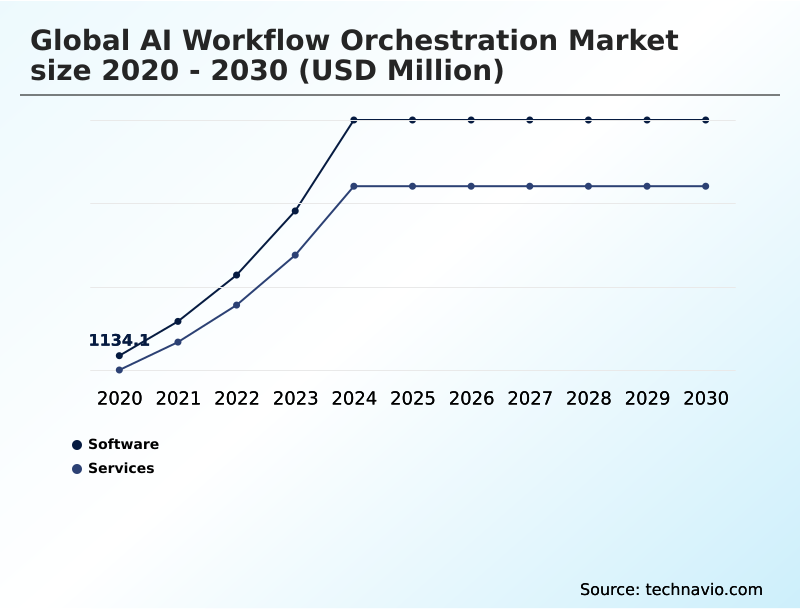
  • By Component - Software segment was valued at USD 2.50 billion in 2024
  • By Deployment - Cloud-based segment accounted for the largest market revenue share in 2024

Market Size & Forecast

  • Market Opportunities: USD 24.43 billion
  • Market Future Opportunities: USD 20.75 billion
  • CAGR from 2025 to 2030 : 35.3%

Market Summary

  • The AI workflow orchestration market is undergoing a significant transformation, moving beyond basic automation to manage the end-to-end lifecycle of intelligent systems. This evolution is driven by the need for scalable, reproducible, and governable AI deployments in complex enterprise environments.
  • Organizations are adopting these frameworks to coordinate disparate data sources, machine learning models, and computational resources, creating a cohesive operational pipeline. A key trend is the shift toward agentic AI, where autonomous agents perform multi-step reasoning and task execution, necessitating sophisticated orchestration layers for management.
  • For instance, in supply chain management, orchestration platforms coordinate predictive models for demand forecasting with automated inventory management systems, ensuring seamless adjustments to market fluctuations without manual intervention. However, the market faces challenges related to integrating modern orchestration tools with legacy infrastructures and a persistent shortage of skilled professionals.
  • The increasing regulatory scrutiny, particularly in Europe and North America, also drives demand for platforms with built-in compliance, model governance, and explainability features, ensuring automated decisions remain transparent and ethically sound. This makes orchestration a critical component for institutionalizing AI securely and effectively.

What will be the Size of the AI Workflow Orchestration Market during the forecast period?

Get Key Insights on Market Forecast (PDF) Get Free Sample

How is the AI Workflow Orchestration Market Segmented?

The ai workflow orchestration industry research report provides comprehensive data (region-wise segment analysis), with forecasts and estimates in "USD million" for the period 2026-2030, as well as historical data from 2020-2024 for the following segments.

  • Component
    • Software
    • Services
  • Deployment
    • Cloud-based
    • On-premises
  • Application
    • MT and HT
    • MD and I
    • DP and FE
    • Monitoring and maintenance
    • Automated decision-making
  • Geography
    • North America
      • US
      • Canada
      • Mexico
    • APAC
      • China
      • Japan
      • India
    • Europe
      • Germany
      • UK
      • France
    • South America
      • Brazil
      • Argentina
    • Middle East and Africa
      • Saudi Arabia
      • UAE
      • South Africa
    • Rest of World (ROW)

By Component Insights

The software segment is estimated to witness significant growth during the forecast period.

The software segment is the technological core of the AI workflow orchestration market, offering platforms for managing the entire lifecycle of machine learning models and automated processes.

These solutions provide a centralized, unified control plane for designing and monitoring complex algorithmic pipelines, featuring robust AI governance solutions. The shift toward agentic AI, where autonomous delegation of tasks is common, is a key driver.

Platforms increasingly integrate features for model governance and data lineage tracking. This ensures that even complex multimodal models operate transparently across hybrid cloud orchestration environments.

With tools like kubeflow pipelines for ML workflow orchestration and scalable AI workflow automation, organizations are seeing a more than 15% improvement in deployment speeds, enabling enterprise AI orchestration to move from experiment to production safely and efficiently.

Get Free Sample

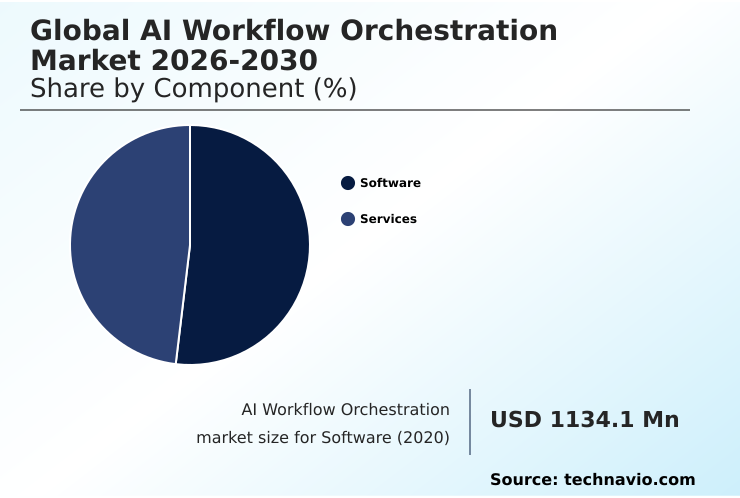
The Software segment was valued at USD 2.50 billion in 2024 and showed a gradual increase during the forecast period.

Get Free Sample

Regional Analysis

North America is estimated to contribute 32.6% to the growth of the global market during the forecast period.Technavio’s analysts have elaborately explained the regional trends and drivers that shape the market during the forecast period.

See How AI Workflow Orchestration Market Demand is Rising in North America Get Free Sample

The geographic landscape of the AI workflow orchestration market is diverse, with North America commanding over 32% of the market opportunity, driven by early adoption of advanced automation. This region leads in deploying production-grade AI agents and autonomous AI systems.

Europe's market is shaped by stringent regulations, creating strong demand for solutions emphasizing data sovereignty and compliance, with a focus on hybrid cloud AI workflows and open-source orchestration to avoid vendor lock-in.

The APAC region is the fastest-growing segment, characterized by a focus on mobile-first enterprise workflow orchestration and edge orchestration in manufacturing.

Countries like China are investing heavily in intelligent automation services and AI-native development lifecycles, while India is a hub for AI engineering services.

South America is an emerging market, with adoption accelerating in the financial and agricultural sectors, where intelligent business processes are being modernized.

Market Dynamics

Our researchers analyzed the data with 2025 as the base year, along with the key drivers, trends, and challenges. A holistic analysis of drivers will help companies refine their marketing strategies to gain a competitive advantage.

  • The AI workflow orchestration market is expanding as organizations implement specialized solutions tailored to specific business functions. For instance, AI workflow orchestration for financial services is crucial for automating fraud detection and algorithmic trading with high precision.
  • In parallel, the democratization of development through low-code AI workflow design for business users is empowering departments to create bespoke automation without deep technical expertise. The strategic importance of agentic AI orchestration in supply chain is growing, where it optimizes logistics and inventory in real time, delivering efficiency gains nearly double that of legacy automation systems.
  • As regulatory pressures mount, AI workflow orchestration for regulatory compliance becomes non-negotiable, providing auditable data lineage and transparent reporting. In customer-facing roles, multi-agent orchestration for customer service is transforming support centers into proactive, intelligent operations. A major hurdle is integrating AI orchestration with legacy systems, a complex task that requires careful planning and investment.
  • The push toward generative AI workflow orchestration at scale is driving demand for platforms that can manage large language models efficiently. To achieve flexibility, AI orchestration for hybrid cloud environments is becoming standard practice, allowing seamless workload management. The operational phase depends on real-time AI workflow monitoring and maintenance to ensure model accuracy and system health.
  • Foundational to this is the effective process of managing data pipelines with AI orchestration. Ultimately, the goal is automated decision-making using AI orchestration, while securing AI workflows with automated guardrails ensures these autonomous actions remain safe and aligned with business policies.

What are the key market drivers leading to the rise in the adoption of AI Workflow Orchestration Industry?

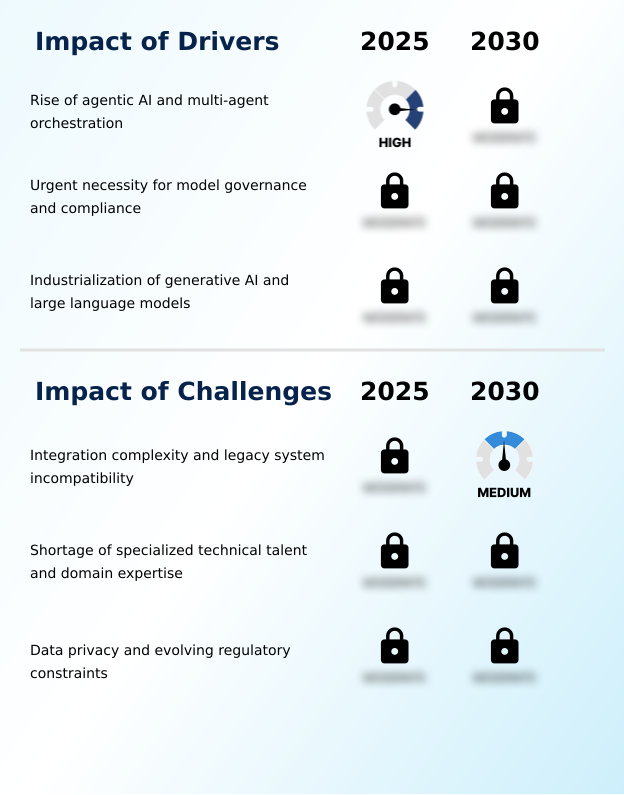
  • The rise of agentic AI and the need for multi-agent orchestration are primary drivers, creating demand for platforms that can manage dynamic, non-linear, and autonomous workflows at scale.

  • The industrialization of generative AI is a major driver, pushing organizations to adopt solutions for managing retrieval-augmented generation and complex interactions with vector databases. This shift toward production-ready AI agents necessitates platforms that can handle scalable AI workflow automation.
  • Another significant driver is the urgent need for model governance and regulatory compliance.
  • Orchestration platforms that provide comprehensive data lineage and explainable AI capabilities are in high demand, as they enable companies to meet stringent legal requirements and generate audit reports, reducing compliance risk by over 30%.
  • The implementation of automated guardrails within these agent-based workflow systems ensures models operate within safe parameters.
  • As enterprises build out AI-native development lifecycles, the ability to automate hyperparameter tuning and manage autonomous AI systems becomes essential for maintaining a competitive edge and operational resilience.

What are the market trends shaping the AI Workflow Orchestration Industry?

  • The market is evolving from static, sequential pipelines toward agentic orchestration frameworks. These advanced systems are defined by autonomous delegation capabilities, enabling self-directed adaptation to real-time variables.

  • A primary trend is the evolution toward agentic orchestration and multi-agent systems, which enable autonomous delegation of complex tasks. Unlike traditional AI workflow automation, these frameworks allow for dynamic, self-directed processes, with early adopters reporting a 25% increase in operational agility.
  • This trend is accompanied by the deep convergence of MLOps integration and DevSecOps convergence, creating unified pipelines for enterprise AI orchestration. The rise of low-code workflow design and natural language interfaces is also democratizing access to ML workflow orchestration, allowing non-technical users to build and manage automated processes.
  • Organizations using these intuitive tools for intelligent workflow automation have seen project initiation times drop by up to 40%. The focus on advanced prompt engineering is further refining the capabilities of these systems, making AI pipeline orchestration more precise and effective.

What challenges does the AI Workflow Orchestration Industry face during its growth?

  • A key challenge affecting industry growth is the integration complexity and incompatibility of modern orchestration frameworks with entrenched legacy systems, which creates significant technical friction.

  • A primary challenge is the technical complexity of integrating modern orchestration platforms with legacy systems, which can increase project timelines by up to 50% for large enterprises. Effective end-to-end AI lifecycle management requires seamless inference engine coordination and state persistence, which is difficult across fragmented IT environments.
  • Another constraint is the global shortage of specialized talent capable of managing sophisticated AI-driven orchestration and automated decision-making systems. This skills gap hinders the ability to implement continuous retraining loops and effective model versioning. Furthermore, as organizations adopt serverless computing and multi-modal AI models, ensuring tool-use capabilities and data consistency becomes more complex.
  • Many are turning to AI-powered orchestration services and synthetic data generation to accelerate development, yet a lack of unified standards for automated model evaluation remains a significant hurdle to achieving scalable and reliable operations.

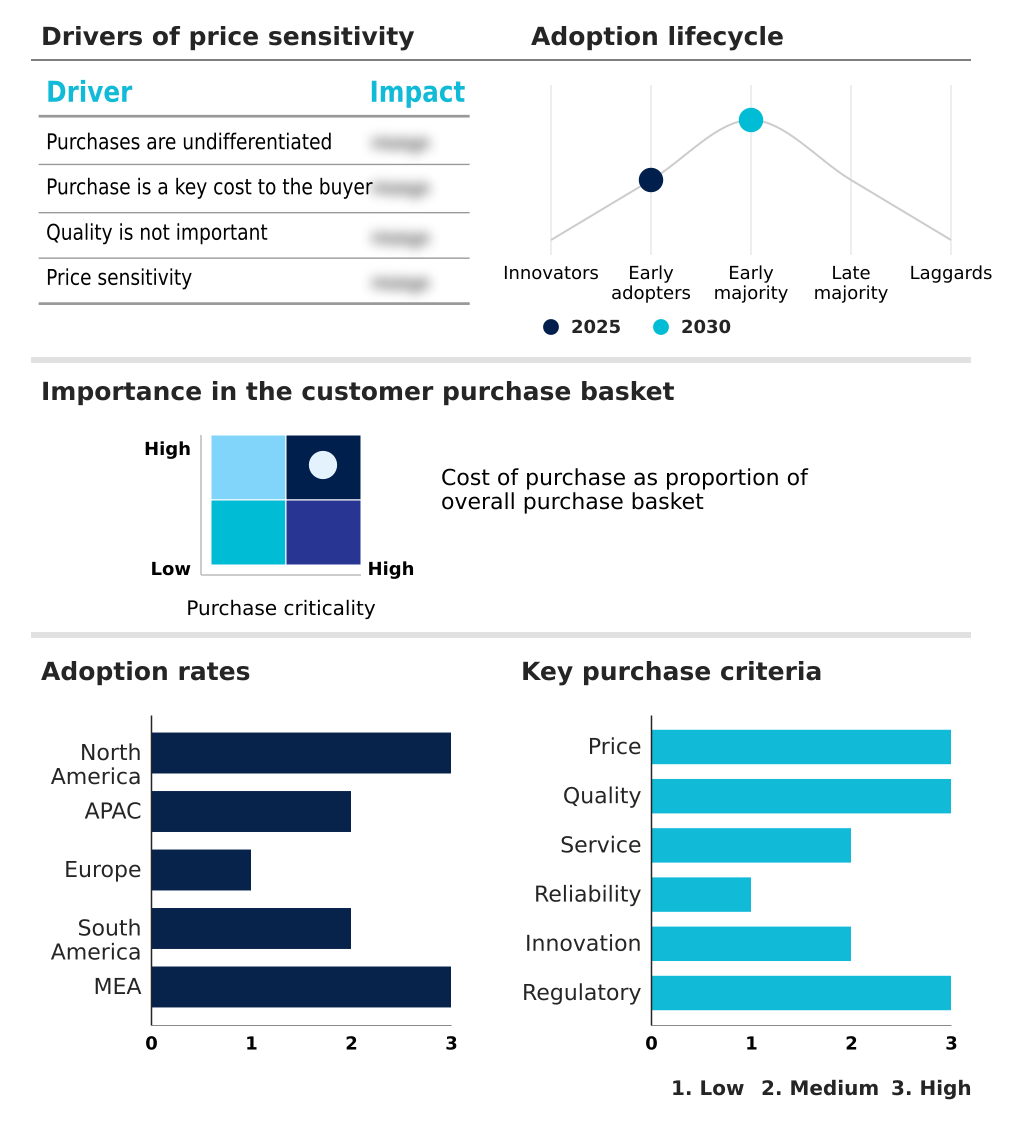
Exclusive Technavio Analysis on Customer Landscape

The ai workflow orchestration market forecasting report includes the adoption lifecycle of the market, covering from the innovator’s stage to the laggard’s stage. It focuses on adoption rates in different regions based on penetration. Furthermore, the ai workflow orchestration market report also includes key purchase criteria and drivers of price sensitivity to help companies evaluate and develop their market growth analysis strategies.

Customer Landscape of AI Workflow Orchestration Industry

Competitive Landscape

Companies are implementing various strategies, such as strategic alliances, ai workflow orchestration market forecast, partnerships, mergers and acquisitions, geographical expansion, and product/service launches, to enhance their presence in the industry.

Amazon.com Inc. - Offers scalable AI workflow automation and complete model lifecycle orchestration through a suite of integrated platforms and services for enterprise-wide deployment.

The industry research and growth report includes detailed analyses of the competitive landscape of the market and information about key companies, including:

  • Amazon.com Inc.
  • Capgemini SE
  • Cisco Systems Inc.
  • Databricks Inc.
  • DataRobot Inc.
  • ElixirClaw AI
  • Google LLC
  • H2O.ai Inc.
  • Hewlett Packard Enterprise Co.
  • IBM Corp.
  • Inngest Inc.
  • Meta Platforms Inc.
  • Microsoft Corp.
  • Oracle Corp.
  • Orkes Inc.
  • Prefect Technologies Inc.
  • SAP SE
  • SAS Institute Inc.
  • SuperAGI
  • Tredence.Inc.

Qualitative and quantitative analysis of companies has been conducted to help clients understand the wider business environment as well as the strengths and weaknesses of key industry players. Data is qualitatively analyzed to categorize companies as pure play, category-focused, industry-focused, and diversified; it is quantitatively analyzed to categorize companies as dominant, leading, strong, tentative, and weak.

Recent Development and News in Ai workflow orchestration market

  • In May 2025, IBM Corp. unveiled next-generation agentic AI orchestration capabilities for its watsonx Orchestrate platform, introducing multi-agent coordination and a no-code Agent Builder to simplify agent creation.
  • In April 2025, Google LLC launched the Agent2Agent Protocol (A2A) as an open standard to enable AI agents across different platforms to discover, communicate, and coordinate actions, backed by over 50 technology partners.
  • In March 2025, Microsoft introduced major updates to Copilot Studio, including the general availability of autonomous agents capable of monitoring events and executing workflows based on natural language instructions without manual intervention.
  • In February 2025, SAP SE and Databricks Inc. announced a strategic partnership to embed Databricks technology within the SAP ecosystem, launching the SAP Business Data Cloud to streamline data engineering and AI workloads.

Dive into Technavio’s robust research methodology, blending expert interviews, extensive data synthesis, and validated models for unparalleled AI Workflow Orchestration Market insights. See full methodology.

Market Scope
Page number 300
Base year 2025
Historic period 2020-2024
Forecast period 2026-2030
Growth momentum & CAGR Accelerate at a CAGR of 35.3%
Market growth 2026-2030 USD 20746.8 million
Market structure Fragmented
YoY growth 2025-2026(%) 29.2%
Key countries US, Canada, Mexico, China, Japan, India, South Korea, Australia, Indonesia, Germany, UK, France, Italy, Spain, The Netherlands, Brazil, Argentina, Chile, Saudi Arabia, UAE, South Africa, Israel and Turkey
Competitive landscape Leading Companies, Market Positioning of Companies, Competitive Strategies, and Industry Risks

Request Free Sample

Research Analyst Overview

  • The AI workflow orchestration market is rapidly maturing as organizations institutionalize AI, moving from isolated models to interconnected, multi-agent systems. This shift necessitates sophisticated frameworks that ensure model governance and complete data lineage. A key trend is the convergence of MLOps integration with DevSecOps convergence, creating a unified approach to the AI lifecycle.
  • For boardroom decisions, this means prioritizing platforms that offer robust, automated guardrails and policy-based security to mitigate regulatory risk. The technology is evolving toward an agentic AI platform model, where autonomous delegation is standard. We see a clear move to retrieval-augmented generation and advanced prompt engineering managed through kubeflow pipelines and vector databases.
  • This has led to a 20% improvement in the accuracy of outputs for complex tasks. This industrialization demands continuous retraining, hyperparameter tuning, and seamless inference engine coordination with state persistence, all while ensuring explainable AI. The rise of low-code workflow design and natural language orchestration is democratizing access, supported by serverless computing, synthetic data generation, and tool-use capabilities for multimodal models.
  • The demand for data sovereignty is driving adoption of hybrid cloud orchestration and edge orchestration, with vendors competing via offerings like an AI agent marketplace for production-grade AI agents and open-source orchestration solutions featuring intelligent automation services and cross-application agent logic for enterprise-grade agentic AI.

What are the Key Data Covered in this AI Workflow Orchestration Market Research and Growth Report?

  • What is the expected growth of the AI Workflow Orchestration Market between 2026 and 2030?

    • USD 20.75 billion, at a CAGR of 35.3%

  • What segmentation does the market report cover?

    • The report is segmented by Component (Software, and Services), Deployment (Cloud-based, and On-premises), Application (MT and HT, MD and I, DP and FE, Monitoring and maintenance, and Automated decision-making) and Geography (North America, APAC, Europe, South America, Middle East and Africa)

  • Which regions are analyzed in the report?

    • North America, APAC, Europe, South America and Middle East and Africa

  • What are the key growth drivers and market challenges?

    • Rise of agentic AI and multi-agent orchestration, Integration complexity and legacy system incompatibility

  • Who are the major players in the AI Workflow Orchestration Market?

    • Amazon.com Inc., Capgemini SE, Cisco Systems Inc., Databricks Inc., DataRobot Inc., ElixirClaw AI, Google LLC, H2O.ai Inc., Hewlett Packard Enterprise Co., IBM Corp., Inngest Inc., Meta Platforms Inc., Microsoft Corp., Oracle Corp., Orkes Inc., Prefect Technologies Inc., SAP SE, SAS Institute Inc., SuperAGI and Tredence.Inc.

Market Research Insights

  • Market dynamics are shaped by a strategic shift from experimental AI to industrialized intelligent workflow automation. This transition is evident as enterprises implementing end-to-end AI lifecycle management report up to a 30% reduction in model deployment times compared to traditional MLOps approaches. The demand for AI-driven automation tools is intensifying, with adoption of enterprise AI orchestration platforms growing significantly.
  • These platforms are becoming unified control planes for both AI pipeline orchestration and broader digital transformation services. Furthermore, organizations leveraging AI-powered orchestration services see a notable improvement in resource optimization, with some achieving a 15% decrease in computational costs through better model and data pipeline management.
  • The focus on AI governance solutions and scalable AI workflow automation is critical for navigating compliance and achieving reliable, enterprise-wide AI model lifecycle orchestration.

We can help! Our analysts can customize this ai workflow orchestration market research report to meet your requirements.

Get in touch

1. Executive Summary

1.1 Market overview

Executive Summary - Chart on Market Overview
Executive Summary - Data Table on Market Overview
Executive Summary - Chart on Global Market Characteristics
Executive Summary - Chart on Market by Geography
Executive Summary - Chart on Market Segmentation by Component
Executive Summary - Chart on Market Segmentation by Deployment
Executive Summary - Chart on Market Segmentation by Application
Executive Summary - Chart on Incremental Growth
Executive Summary - Data Table on Incremental Growth
Executive Summary - Chart on Company Market Positioning

2. Technavio Analysis

2.1 Analysis of price sensitivity, lifecycle, customer purchase basket, adoption rates, and purchase criteria

2.2 Criticality of inputs and Factors of differentiation

Chart on Overview on criticality of inputs and factors of differentiation

2.3 Factors of disruption

Chart on Overview on factors of disruption

2.4 Impact of drivers and challenges

Chart on Impact of drivers and challenges in 2025 and 2030

3. Market Landscape

3.1 Market ecosystem

Chart on Parent Market
Data Table on - Parent Market

3.2 Market characteristics

Chart on Market characteristics analysis

3.3 Value chain analysis

Chart on Value chain analysis

4. Market Sizing

4.1 Market definition

Data Table on Offerings of companies included in the market definition

4.2 Market segment analysis

Market segments

4.3 Market size 2025

4.4 Market outlook: Forecast for 2025-2030

Chart on Global - Market size and forecast 2025-2030 ($ million)
Data Table on Global - Market size and forecast 2025-2030 ($ million)
Chart on Global Market: Year-over-year growth 2025-2030 (%)
Data Table on Global Market: Year-over-year growth 2025-2030 (%)

5. Historic Market Size

5.1 Global AI Workflow Orchestration Market 2020 - 2024

Historic Market Size - Data Table on Global AI Workflow Orchestration Market 2020 - 2024 ($ million)

5.2 Component segment analysis 2020 - 2024

Historic Market Size - Component Segment 2020 - 2024 ($ million)

5.3 Deployment segment analysis 2020 - 2024

Historic Market Size - Deployment Segment 2020 - 2024 ($ million)

5.4 Application segment analysis 2020 - 2024

Historic Market Size - Application Segment 2020 - 2024 ($ million)

5.5 Geography segment analysis 2020 - 2024

Historic Market Size - Geography Segment 2020 - 2024 ($ million)

5.6 Country segment analysis 2020 - 2024

Historic Market Size - Country Segment 2020 - 2024 ($ million)

6. Qualitative Analysis

6.1 Impact of geopolitical conflict on global AI workflow orchestration market

7. Five Forces Analysis

7.1 Five forces summary

Five forces analysis - Comparison between 2025 and 2030

7.2 Bargaining power of buyers

Bargaining power of buyers - Impact of key factors 2025 and 2030

7.3 Bargaining power of suppliers

Bargaining power of suppliers - Impact of key factors in 2025 and 2030

7.4 Threat of new entrants

Threat of new entrants - Impact of key factors in 2025 and 2030

7.5 Threat of substitutes

Threat of substitutes - Impact of key factors in 2025 and 2030

7.6 Threat of rivalry

Threat of rivalry - Impact of key factors in 2025 and 2030

7.7 Market condition

Chart on Market condition - Five forces 2025 and 2030

8. Market Segmentation by Component

8.1 Market segments

Chart on Component - Market share 2025-2030 (%)
Data Table on Component - Market share 2025-2030 (%)

8.2 Comparison by Component

Chart on Comparison by Component
Data Table on Comparison by Component

8.3 Software - Market size and forecast 2025-2030

Chart on Software - Market size and forecast 2025-2030 ($ million)
Data Table on Software - Market size and forecast 2025-2030 ($ million)
Chart on Software - Year-over-year growth 2025-2030 (%)
Data Table on Software - Year-over-year growth 2025-2030 (%)

8.4 Services - Market size and forecast 2025-2030

Chart on Services - Market size and forecast 2025-2030 ($ million)
Data Table on Services - Market size and forecast 2025-2030 ($ million)
Chart on Services - Year-over-year growth 2025-2030 (%)
Data Table on Services - Year-over-year growth 2025-2030 (%)

8.5 Market opportunity by Component

Market opportunity by Component ($ million)
Data Table on Market opportunity by Component ($ million)

9. Market Segmentation by Deployment

9.1 Market segments

Chart on Deployment - Market share 2025-2030 (%)
Data Table on Deployment - Market share 2025-2030 (%)

9.2 Comparison by Deployment

Chart on Comparison by Deployment
Data Table on Comparison by Deployment

9.3 Cloud-based - Market size and forecast 2025-2030

Chart on Cloud-based - Market size and forecast 2025-2030 ($ million)
Data Table on Cloud-based - Market size and forecast 2025-2030 ($ million)
Chart on Cloud-based - Year-over-year growth 2025-2030 (%)
Data Table on Cloud-based - Year-over-year growth 2025-2030 (%)

9.4 On-premises - Market size and forecast 2025-2030

Chart on On-premises - Market size and forecast 2025-2030 ($ million)
Data Table on On-premises - Market size and forecast 2025-2030 ($ million)
Chart on On-premises - Year-over-year growth 2025-2030 (%)
Data Table on On-premises - Year-over-year growth 2025-2030 (%)

9.5 Market opportunity by Deployment

Market opportunity by Deployment ($ million)
Data Table on Market opportunity by Deployment ($ million)

10. Market Segmentation by Application

10.1 Market segments

Chart on Application - Market share 2025-2030 (%)
Data Table on Application - Market share 2025-2030 (%)

10.2 Comparison by Application

Chart on Comparison by Application
Data Table on Comparison by Application

10.3 MT and HT - Market size and forecast 2025-2030

Chart on MT and HT - Market size and forecast 2025-2030 ($ million)
Data Table on MT and HT - Market size and forecast 2025-2030 ($ million)
Chart on MT and HT - Year-over-year growth 2025-2030 (%)
Data Table on MT and HT - Year-over-year growth 2025-2030 (%)

10.4 MD and I - Market size and forecast 2025-2030

Chart on MD and I - Market size and forecast 2025-2030 ($ million)
Data Table on MD and I - Market size and forecast 2025-2030 ($ million)
Chart on MD and I - Year-over-year growth 2025-2030 (%)
Data Table on MD and I - Year-over-year growth 2025-2030 (%)

10.5 DP and FE - Market size and forecast 2025-2030

Chart on DP and FE - Market size and forecast 2025-2030 ($ million)
Data Table on DP and FE - Market size and forecast 2025-2030 ($ million)
Chart on DP and FE - Year-over-year growth 2025-2030 (%)
Data Table on DP and FE - Year-over-year growth 2025-2030 (%)

10.6 Monitoring and maintenance - Market size and forecast 2025-2030

Chart on Monitoring and maintenance - Market size and forecast 2025-2030 ($ million)
Data Table on Monitoring and maintenance - Market size and forecast 2025-2030 ($ million)
Chart on Monitoring and maintenance - Year-over-year growth 2025-2030 (%)
Data Table on Monitoring and maintenance - Year-over-year growth 2025-2030 (%)

10.7 Automated decision-making - Market size and forecast 2025-2030

Chart on Automated decision-making - Market size and forecast 2025-2030 ($ million)
Data Table on Automated decision-making - Market size and forecast 2025-2030 ($ million)
Chart on Automated decision-making - Year-over-year growth 2025-2030 (%)
Data Table on Automated decision-making - Year-over-year growth 2025-2030 (%)

10.8 Market opportunity by Application

Market opportunity by Application ($ million)
Data Table on Market opportunity by Application ($ million)

11. Customer Landscape

11.1 Customer landscape overview

Analysis of price sensitivity, lifecycle, customer purchase basket, adoption rates, and purchase criteria

12. Geographic Landscape

12.1 Geographic segmentation

Chart on Market share by geography 2025-2030 (%)
Data Table on Market share by geography 2025-2030 (%)

12.2 Geographic comparison

Chart on Geographic comparison
Data Table on Geographic comparison

12.3 North America - Market size and forecast 2025-2030

Chart on North America - Market size and forecast 2025-2030 ($ million)
Data Table on North America - Market size and forecast 2025-2030 ($ million)
Chart on North America - Year-over-year growth 2025-2030 (%)
Data Table on North America - Year-over-year growth 2025-2030 (%)
Chart on Regional Comparison - North America
Data Table on Regional Comparison - North America

12.3.1 US - Market size and forecast 2025-2030

Chart on US - Market size and forecast 2025-2030 ($ million)
Data Table on US - Market size and forecast 2025-2030 ($ million)
Chart on US - Year-over-year growth 2025-2030 (%)
Data Table on US - Year-over-year growth 2025-2030 (%)

12.3.2 Canada - Market size and forecast 2025-2030

Chart on Canada - Market size and forecast 2025-2030 ($ million)
Data Table on Canada - Market size and forecast 2025-2030 ($ million)
Chart on Canada - Year-over-year growth 2025-2030 (%)
Data Table on Canada - Year-over-year growth 2025-2030 (%)

12.3.3 Mexico - Market size and forecast 2025-2030

Chart on Mexico - Market size and forecast 2025-2030 ($ million)
Data Table on Mexico - Market size and forecast 2025-2030 ($ million)
Chart on Mexico - Year-over-year growth 2025-2030 (%)
Data Table on Mexico - Year-over-year growth 2025-2030 (%)

12.4 APAC - Market size and forecast 2025-2030

Chart on APAC - Market size and forecast 2025-2030 ($ million)
Data Table on APAC - Market size and forecast 2025-2030 ($ million)
Chart on APAC - Year-over-year growth 2025-2030 (%)
Data Table on APAC - Year-over-year growth 2025-2030 (%)
Chart on Regional Comparison - APAC
Data Table on Regional Comparison - APAC

12.4.1 China - Market size and forecast 2025-2030

Chart on China - Market size and forecast 2025-2030 ($ million)
Data Table on China - Market size and forecast 2025-2030 ($ million)
Chart on China - Year-over-year growth 2025-2030 (%)
Data Table on China - Year-over-year growth 2025-2030 (%)

12.4.2 Japan - Market size and forecast 2025-2030

Chart on Japan - Market size and forecast 2025-2030 ($ million)
Data Table on Japan - Market size and forecast 2025-2030 ($ million)
Chart on Japan - Year-over-year growth 2025-2030 (%)
Data Table on Japan - Year-over-year growth 2025-2030 (%)

12.4.3 India - Market size and forecast 2025-2030

Chart on India - Market size and forecast 2025-2030 ($ million)
Data Table on India - Market size and forecast 2025-2030 ($ million)
Chart on India - Year-over-year growth 2025-2030 (%)
Data Table on India - Year-over-year growth 2025-2030 (%)

12.4.4 South Korea - Market size and forecast 2025-2030

Chart on South Korea - Market size and forecast 2025-2030 ($ million)
Data Table on South Korea - Market size and forecast 2025-2030 ($ million)
Chart on South Korea - Year-over-year growth 2025-2030 (%)
Data Table on South Korea - Year-over-year growth 2025-2030 (%)

12.4.5 Australia - Market size and forecast 2025-2030

Chart on Australia - Market size and forecast 2025-2030 ($ million)
Data Table on Australia - Market size and forecast 2025-2030 ($ million)
Chart on Australia - Year-over-year growth 2025-2030 (%)
Data Table on Australia - Year-over-year growth 2025-2030 (%)

12.4.6 Indonesia - Market size and forecast 2025-2030

Chart on Indonesia - Market size and forecast 2025-2030 ($ million)
Data Table on Indonesia - Market size and forecast 2025-2030 ($ million)
Chart on Indonesia - Year-over-year growth 2025-2030 (%)
Data Table on Indonesia - Year-over-year growth 2025-2030 (%)

12.5 Europe - Market size and forecast 2025-2030

Chart on Europe - Market size and forecast 2025-2030 ($ million)
Data Table on Europe - Market size and forecast 2025-2030 ($ million)
Chart on Europe - Year-over-year growth 2025-2030 (%)
Data Table on Europe - Year-over-year growth 2025-2030 (%)
Chart on Regional Comparison - Europe
Data Table on Regional Comparison - Europe

12.5.1 Germany - Market size and forecast 2025-2030

Chart on Germany - Market size and forecast 2025-2030 ($ million)
Data Table on Germany - Market size and forecast 2025-2030 ($ million)
Chart on Germany - Year-over-year growth 2025-2030 (%)
Data Table on Germany - Year-over-year growth 2025-2030 (%)

12.5.2 UK - Market size and forecast 2025-2030

Chart on UK - Market size and forecast 2025-2030 ($ million)
Data Table on UK - Market size and forecast 2025-2030 ($ million)
Chart on UK - Year-over-year growth 2025-2030 (%)
Data Table on UK - Year-over-year growth 2025-2030 (%)

12.5.3 France - Market size and forecast 2025-2030

Chart on France - Market size and forecast 2025-2030 ($ million)
Data Table on France - Market size and forecast 2025-2030 ($ million)
Chart on France - Year-over-year growth 2025-2030 (%)
Data Table on France - Year-over-year growth 2025-2030 (%)

12.5.4 Italy - Market size and forecast 2025-2030

Chart on Italy - Market size and forecast 2025-2030 ($ million)
Data Table on Italy - Market size and forecast 2025-2030 ($ million)
Chart on Italy - Year-over-year growth 2025-2030 (%)
Data Table on Italy - Year-over-year growth 2025-2030 (%)

12.5.5 Spain - Market size and forecast 2025-2030

Chart on Spain - Market size and forecast 2025-2030 ($ million)
Data Table on Spain - Market size and forecast 2025-2030 ($ million)
Chart on Spain - Year-over-year growth 2025-2030 (%)
Data Table on Spain - Year-over-year growth 2025-2030 (%)

12.5.6 The Netherlands - Market size and forecast 2025-2030

Chart on The Netherlands - Market size and forecast 2025-2030 ($ million)
Data Table on The Netherlands - Market size and forecast 2025-2030 ($ million)
Chart on The Netherlands - Year-over-year growth 2025-2030 (%)
Data Table on The Netherlands - Year-over-year growth 2025-2030 (%)

12.6 South America - Market size and forecast 2025-2030

Chart on South America - Market size and forecast 2025-2030 ($ million)
Data Table on South America - Market size and forecast 2025-2030 ($ million)
Chart on South America - Year-over-year growth 2025-2030 (%)
Data Table on South America - Year-over-year growth 2025-2030 (%)
Chart on Regional Comparison - South America
Data Table on Regional Comparison - South America

12.6.1 Brazil - Market size and forecast 2025-2030

Chart on Brazil - Market size and forecast 2025-2030 ($ million)
Data Table on Brazil - Market size and forecast 2025-2030 ($ million)
Chart on Brazil - Year-over-year growth 2025-2030 (%)
Data Table on Brazil - Year-over-year growth 2025-2030 (%)

12.6.2 Argentina - Market size and forecast 2025-2030

Chart on Argentina - Market size and forecast 2025-2030 ($ million)
Data Table on Argentina - Market size and forecast 2025-2030 ($ million)
Chart on Argentina - Year-over-year growth 2025-2030 (%)
Data Table on Argentina - Year-over-year growth 2025-2030 (%)

12.6.3 Chile - Market size and forecast 2025-2030

Chart on Chile - Market size and forecast 2025-2030 ($ million)
Data Table on Chile - Market size and forecast 2025-2030 ($ million)
Chart on Chile - Year-over-year growth 2025-2030 (%)
Data Table on Chile - Year-over-year growth 2025-2030 (%)

12.7 Middle East and Africa - Market size and forecast 2025-2030

Chart on Middle East and Africa - Market size and forecast 2025-2030 ($ million)
Data Table on Middle East and Africa - Market size and forecast 2025-2030 ($ million)
Chart on Middle East and Africa - Year-over-year growth 2025-2030 (%)
Data Table on Middle East and Africa - Year-over-year growth 2025-2030 (%)
Chart on Regional Comparison - Middle East and Africa
Data Table on Regional Comparison - Middle East and Africa

12.7.1 Saudi Arabia - Market size and forecast 2025-2030

Chart on Saudi Arabia - Market size and forecast 2025-2030 ($ million)
Data Table on Saudi Arabia - Market size and forecast 2025-2030 ($ million)
Chart on Saudi Arabia - Year-over-year growth 2025-2030 (%)
Data Table on Saudi Arabia - Year-over-year growth 2025-2030 (%)

12.7.2 UAE - Market size and forecast 2025-2030

Chart on UAE - Market size and forecast 2025-2030 ($ million)
Data Table on UAE - Market size and forecast 2025-2030 ($ million)
Chart on UAE - Year-over-year growth 2025-2030 (%)
Data Table on UAE - Year-over-year growth 2025-2030 (%)

12.7.3 South Africa - Market size and forecast 2025-2030

Chart on South Africa - Market size and forecast 2025-2030 ($ million)
Data Table on South Africa - Market size and forecast 2025-2030 ($ million)
Chart on South Africa - Year-over-year growth 2025-2030 (%)
Data Table on South Africa - Year-over-year growth 2025-2030 (%)

12.7.4 Israel - Market size and forecast 2025-2030

Chart on Israel - Market size and forecast 2025-2030 ($ million)
Data Table on Israel - Market size and forecast 2025-2030 ($ million)
Chart on Israel - Year-over-year growth 2025-2030 (%)
Data Table on Israel - Year-over-year growth 2025-2030 (%)

12.7.5 Turkey - Market size and forecast 2025-2030

Chart on Turkey - Market size and forecast 2025-2030 ($ million)
Data Table on Turkey - Market size and forecast 2025-2030 ($ million)
Chart on Turkey - Year-over-year growth 2025-2030 (%)
Data Table on Turkey - Year-over-year growth 2025-2030 (%)

12.8 Market opportunity by geography

Market opportunity by geography ($ million)
Data Tables on Market opportunity by geography ($ million)

13. Drivers, Challenges, and Opportunity

13.1 Market drivers

Rise of agentic AI and multi-agent orchestration
Urgent necessity for model governance and compliance
Industrialization of generative AI and large language models

13.2 Market challenges

Integration complexity and legacy system incompatibility
Shortage of specialized technical talent and domain expertise
Data privacy and evolving regulatory constraints

13.3 Impact of drivers and challenges

Impact of drivers and challenges in 2025 and 2030

13.4 Market opportunities

Evolution toward agentic orchestration and autonomous delegation
Convergence of AI orchestration with MLOps and DevSecOps
Expansion of low-code and natural language workflow design

14. Competitive Landscape

14.1 Overview

14.2

Overview on criticality of inputs and factors of differentiation

14.3 Landscape disruption

Overview on factors of disruption

14.4 Industry risks

Impact of key risks on business

15. Competitive Analysis

15.1 Companies profiled

Companies covered

15.2 Company ranking index

15.3 Market positioning of companies

Matrix on companies position and classification

15.4 Amazon.com Inc.

Amazon.com Inc. - Overview
Amazon.com Inc. - Business segments
Amazon.com Inc. - Key news
Amazon.com Inc. - Key offerings
Amazon.com Inc. - Segment focus
SWOT

15.5 Capgemini SE

Capgemini SE - Overview
Capgemini SE - Business segments
Capgemini SE - Key news
Capgemini SE - Key offerings
Capgemini SE - Segment focus
SWOT

15.6 Cisco Systems Inc.

Cisco Systems Inc. - Overview
Cisco Systems Inc. - Business segments
Cisco Systems Inc. - Key news
Cisco Systems Inc. - Key offerings
Cisco Systems Inc. - Segment focus
SWOT

15.7 Databricks Inc.

Databricks Inc. - Overview
Databricks Inc. - Product / Service
Databricks Inc. - Key offerings
SWOT

15.8 DataRobot Inc.

DataRobot Inc. - Overview
DataRobot Inc. - Product / Service
DataRobot Inc. - Key offerings
SWOT

15.9 Google LLC

Google LLC - Overview
Google LLC - Product / Service
Google LLC - Key offerings
SWOT

15.10 H2O.ai Inc.

H2O.ai Inc. - Overview
H2O.ai Inc. - Product / Service
H2O.ai Inc. - Key offerings
SWOT

15.11 Hewlett Packard Enterprise Co.

Hewlett Packard Enterprise Co. - Overview
Hewlett Packard Enterprise Co. - Business segments
Hewlett Packard Enterprise Co. - Key news
Hewlett Packard Enterprise Co. - Key offerings
Hewlett Packard Enterprise Co. - Segment focus
SWOT

15.12 IBM Corp.

IBM Corp. - Overview
IBM Corp. - Business segments
IBM Corp. - Key news
IBM Corp. - Key offerings
IBM Corp. - Segment focus
SWOT

15.13 Meta Platforms Inc.

Meta Platforms Inc. - Overview
Meta Platforms Inc. - Business segments
Meta Platforms Inc. - Key offerings
Meta Platforms Inc. - Segment focus
SWOT

15.14 Microsoft Corp.

Microsoft Corp. - Overview
Microsoft Corp. - Business segments
Microsoft Corp. - Key news
Microsoft Corp. - Key offerings
Microsoft Corp. - Segment focus
SWOT

15.15 Oracle Corp.

Oracle Corp. - Overview
Oracle Corp. - Business segments
Oracle Corp. - Key news
Oracle Corp. - Key offerings
Oracle Corp. - Segment focus
SWOT

15.16 SAP SE

SAP SE - Overview
SAP SE - Business segments
SAP SE - Key news
SAP SE - Key offerings
SAP SE - Segment focus
SWOT

15.17 SAS Institute Inc.

SAS Institute Inc. - Overview
SAS Institute Inc. - Product / Service
SAS Institute Inc. - Key offerings
SWOT

15.18 Tredence.Inc.

Tredence.Inc. - Overview
Tredence.Inc. - Product / Service
Tredence.Inc. - Key offerings
SWOT

16. Appendix

16.1 Scope of the report

Market definition
Objectives
Notes and caveats

16.2 Inclusions and exclusions checklist

Inclusions checklist
Exclusions checklist

16.3 Currency conversion rates for US$

16.4 Research methodology

16.5 Data procurement

Information sources

16.6 Data validation

16.7 Validation techniques employed for market sizing

16.8 Data synthesis

16.9 360 degree market analysis

16.10 List of abbreviations

Research Methodology

Technavio presents a detailed picture of the market by way of study, synthesis, and summation of data from multiple sources. The analysts have presented the various facets of the market with a particular focus on identifying the key industry influencers. The data thus presented is comprehensive, reliable, and the result of extensive research, both primary and secondary.

INFORMATION SOURCES

Primary sources

  • Manufacturers and suppliers
  • Channel partners
  • Industry experts
  • Strategic decision makers

Secondary sources

  • Industry journals and periodicals
  • Government data
  • Financial reports of key industry players
  • Historical data
  • Press releases

DATA ANALYSIS

Data Synthesis

  • Collation of data
  • Estimation of key figures
  • Analysis of derived insights

Data Validation

  • Triangulation with data models
  • Reference against proprietary databases
  • Corroboration with industry experts

REPORT WRITING

Qualitative

  • Market drivers
  • Market challenges
  • Market trends
  • Five forces analysis

Quantitative

  • Market size and forecast
  • Market segmentation
  • Geographical insights
  • Competitive landscape

Interested in this report?

Get your sample now to see our research methodology and insights!

Download Now

Frequently Asked Questions

AI Workflow Orchestration market growth will increase by USD 20746.8 million during 2026-2030.

The AI Workflow Orchestration market is expected to grow at a CAGR of 35.3% during 2026-2030.

AI Workflow Orchestration market is segmented by Component (Software, Services) Deployment (Cloud-based, On-premises) Application (MT and HT, MD and I, DP and FE, Monitoring and maintenance, Automated decision-making)

Amazon.com Inc., Capgemini SE, Cisco Systems Inc., Databricks Inc., DataRobot Inc., ElixirClaw AI, Google LLC, H2O.ai Inc., Hewlett Packard Enterprise Co., IBM Corp., Inngest Inc., Meta Platforms Inc., Microsoft Corp., Oracle Corp., Orkes Inc., Prefect Technologies Inc., SAP SE, SAS Institute Inc., SuperAGI, Tredence.Inc. are a few of the key vendors in the AI Workflow Orchestration market.

North America will register the highest growth rate of 32.6% among the other regions. Therefore, the AI Workflow Orchestration market in North America is expected to garner significant business opportunities for the vendors during the forecast period.

US, Canada, Mexico, China, Japan, India, South Korea, Australia, Indonesia, Germany, UK, France, Italy, Spain, The Netherlands, Brazil, Argentina, Chile, Saudi Arabia, UAE, South Africa, Israel, Turkey

  • Rise of agentic AI and multi-agent orchestration is the driving factor this market.

The AI Workflow Orchestration market vendors should focus on grabbing business opportunities from the Component segment as it accounted for the largest market share in the base year.
RIA - Research AI Assistant
Ask RIA